Free Statistics

of Irreproducible Research!

Author's title

Author*The author of this computation has been verified*
R Software Modulerwasp_arimabackwardselection.wasp
Title produced by softwareARIMA Backward Selection
Date of computationMon, 19 Dec 2016 11:21:22 +0100
Cite this page as followsStatistical Computations at FreeStatistics.org, Office for Research Development and Education, URL https://freestatistics.org/blog/index.php?v=date/2016/Dec/19/t1482143200w7sa6bujerpjstm.htm/, Retrieved Sat, 18 May 2024 02:29:05 +0000
Statistical Computations at FreeStatistics.org, Office for Research Development and Education, URL https://freestatistics.org/blog/index.php?pk=301276, Retrieved Sat, 18 May 2024 02:29:05 +0000
QR Codes:

Original text written by user:
IsPrivate?No (this computation is public)
User-defined keywords
Estimated Impact110
Family? (F = Feedback message, R = changed R code, M = changed R Module, P = changed Parameters, D = changed Data)
-       [ARIMA Backward Selection] [arima 1] [2016-12-19 10:21:22] [2d1dd91c3b5ba64567b1d6b2c9fe9017] [Current]
Feedback Forum

Post a new message
Dataseries X:
5797.8
5784.3
5714.8
5748.8
5793.8
5783.2
5765
5846.1
5879.4
5922.7
5992.7
6032.5
6028.3
6096.3
6184.8
6206.1
6324
6380.6
6504.6
6591
6637.9
6653.8
6611.3
6603.1
6562.8
6554.9
6529.8
6543.4
6481.5
6489.6
6452.3
6444.5
6409.6
6427.5
6374.2
6400.5
6268.2
6239.5
6220.1
6226.6
6207.1
6217.4
6196.9
6132.9
6151.2
6115.2
6122.6
6140.9
6146.5
6126
6131.9
6190.8
6209.2
6230.8
6196.5
6168.2
6213.4
6243
6298.1
6361.4
6388.7
6416.3
6505.7
6538.7
6605.5
6668.9
6741.7
6813.2
6864.3
6870
6889.8
6938.8
7033.3
7104
7168.7
7156
7156.6
7171.8
7251.2
7258.8
7231.5
7261.7
7252.8
7194.2
7211.9
7177.8
7145.9
7170.6
7189.6
7161
7219.9
7155.3
7155.8
7232.1
7254.9
7278.8
7291.2
7298.6
7256.3
7187.7
7126.3
7034.6
7018.6
7024.4
7028.2
7042.2
7022.2
6998.7
6982.7
6936.6
6887.2
6881.1
6890.9
6947.7
6887.5
6937.1


Summary of computational transaction
Raw Input view raw input (R code)
Raw Outputview raw output of R engine
Computing time3 seconds
R ServerBig Analytics Cloud Computing Center

\begin{tabular}{lllllllll}
\hline
Summary of computational transaction \tabularnewline
Raw Input view raw input (R code)  \tabularnewline
Raw Outputview raw output of R engine  \tabularnewline
Computing time3 seconds \tabularnewline
R ServerBig Analytics Cloud Computing Center \tabularnewline
\hline
\end{tabular}
%Source: https://freestatistics.org/blog/index.php?pk=301276&T=0

[TABLE]
[ROW]
Summary of computational transaction[/C][/ROW] [ROW]Raw Input[/C] view raw input (R code) [/C][/ROW] [ROW]Raw Output[/C]view raw output of R engine [/C][/ROW] [ROW]Computing time[/C]3 seconds[/C][/ROW] [ROW]R Server[/C]Big Analytics Cloud Computing Center[/C][/ROW] [/TABLE] Source: https://freestatistics.org/blog/index.php?pk=301276&T=0

Globally Unique Identifier (entire table): ba.freestatistics.org/blog/index.php?pk=301276&T=0

As an alternative you can also use a QR Code:  

The GUIDs for individual cells are displayed in the table below:

Summary of computational transaction
Raw Input view raw input (R code)
Raw Outputview raw output of R engine
Computing time3 seconds
R ServerBig Analytics Cloud Computing Center


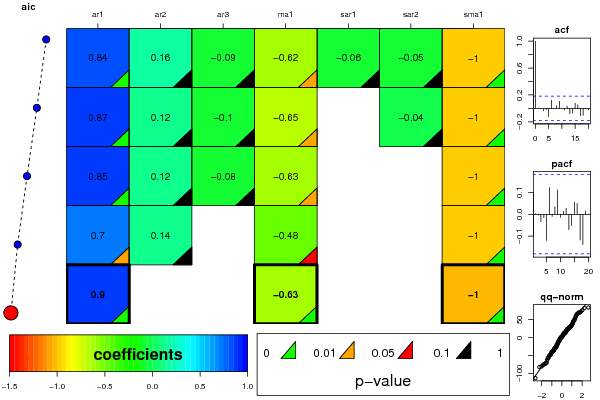
ARIMA Parameter Estimation and Backward Selection
Iterationar1ar2ar3ma1sar1sar2sma1
Estimates ( 1 )0.83880.1582-0.0944-0.621-0.0576-0.0529-1
(p-val)(0.0052 )(0.3234 )(0.5712 )(0.023 )(0.6458 )(0.6441 )(0 )
Estimates ( 2 )0.8740.1241-0.0965-0.65050-0.0379-1
(p-val)(0.0024 )(0.3849 )(0.543 )(0.0132 )(NA )(0.7287 )(0 )
Estimates ( 3 )0.85120.1213-0.0805-0.631500-1
(p-val)(0.0054 )(0.3977 )(0.6129 )(0.0263 )(NA )(NA )(0 )
Estimates ( 4 )0.7020.13790-0.483700-1
(p-val)(0.0123 )(0.4182 )(NA )(0.0737 )(NA )(NA )(0 )
Estimates ( 5 )0.895700-0.633800-1
(p-val)(0 )(NA )(NA )(0 )(NA )(NA )(0 )
Estimates ( 6 )NANANANANANANA
(p-val)(NA )(NA )(NA )(NA )(NA )(NA )(NA )
Estimates ( 7 )NANANANANANANA
(p-val)(NA )(NA )(NA )(NA )(NA )(NA )(NA )
Estimates ( 8 )NANANANANANANA
(p-val)(NA )(NA )(NA )(NA )(NA )(NA )(NA )
Estimates ( 9 )NANANANANANANA
(p-val)(NA )(NA )(NA )(NA )(NA )(NA )(NA )
Estimates ( 10 )NANANANANANANA
(p-val)(NA )(NA )(NA )(NA )(NA )(NA )(NA )
Estimates ( 11 )NANANANANANANA
(p-val)(NA )(NA )(NA )(NA )(NA )(NA )(NA )
Estimates ( 12 )NANANANANANANA
(p-val)(NA )(NA )(NA )(NA )(NA )(NA )(NA )
Estimates ( 13 )NANANANANANANA
(p-val)(NA )(NA )(NA )(NA )(NA )(NA )(NA )

\begin{tabular}{lllllllll}
\hline
ARIMA Parameter Estimation and Backward Selection \tabularnewline
Iteration & ar1 & ar2 & ar3 & ma1 & sar1 & sar2 & sma1 \tabularnewline
Estimates ( 1 ) & 0.8388 & 0.1582 & -0.0944 & -0.621 & -0.0576 & -0.0529 & -1 \tabularnewline
(p-val) & (0.0052 ) & (0.3234 ) & (0.5712 ) & (0.023 ) & (0.6458 ) & (0.6441 ) & (0 ) \tabularnewline
Estimates ( 2 ) & 0.874 & 0.1241 & -0.0965 & -0.6505 & 0 & -0.0379 & -1 \tabularnewline
(p-val) & (0.0024 ) & (0.3849 ) & (0.543 ) & (0.0132 ) & (NA ) & (0.7287 ) & (0 ) \tabularnewline
Estimates ( 3 ) & 0.8512 & 0.1213 & -0.0805 & -0.6315 & 0 & 0 & -1 \tabularnewline
(p-val) & (0.0054 ) & (0.3977 ) & (0.6129 ) & (0.0263 ) & (NA ) & (NA ) & (0 ) \tabularnewline
Estimates ( 4 ) & 0.702 & 0.1379 & 0 & -0.4837 & 0 & 0 & -1 \tabularnewline
(p-val) & (0.0123 ) & (0.4182 ) & (NA ) & (0.0737 ) & (NA ) & (NA ) & (0 ) \tabularnewline
Estimates ( 5 ) & 0.8957 & 0 & 0 & -0.6338 & 0 & 0 & -1 \tabularnewline
(p-val) & (0 ) & (NA ) & (NA ) & (0 ) & (NA ) & (NA ) & (0 ) \tabularnewline
Estimates ( 6 ) & NA & NA & NA & NA & NA & NA & NA \tabularnewline
(p-val) & (NA ) & (NA ) & (NA ) & (NA ) & (NA ) & (NA ) & (NA ) \tabularnewline
Estimates ( 7 ) & NA & NA & NA & NA & NA & NA & NA \tabularnewline
(p-val) & (NA ) & (NA ) & (NA ) & (NA ) & (NA ) & (NA ) & (NA ) \tabularnewline
Estimates ( 8 ) & NA & NA & NA & NA & NA & NA & NA \tabularnewline
(p-val) & (NA ) & (NA ) & (NA ) & (NA ) & (NA ) & (NA ) & (NA ) \tabularnewline
Estimates ( 9 ) & NA & NA & NA & NA & NA & NA & NA \tabularnewline
(p-val) & (NA ) & (NA ) & (NA ) & (NA ) & (NA ) & (NA ) & (NA ) \tabularnewline
Estimates ( 10 ) & NA & NA & NA & NA & NA & NA & NA \tabularnewline
(p-val) & (NA ) & (NA ) & (NA ) & (NA ) & (NA ) & (NA ) & (NA ) \tabularnewline
Estimates ( 11 ) & NA & NA & NA & NA & NA & NA & NA \tabularnewline
(p-val) & (NA ) & (NA ) & (NA ) & (NA ) & (NA ) & (NA ) & (NA ) \tabularnewline
Estimates ( 12 ) & NA & NA & NA & NA & NA & NA & NA \tabularnewline
(p-val) & (NA ) & (NA ) & (NA ) & (NA ) & (NA ) & (NA ) & (NA ) \tabularnewline
Estimates ( 13 ) & NA & NA & NA & NA & NA & NA & NA \tabularnewline
(p-val) & (NA ) & (NA ) & (NA ) & (NA ) & (NA ) & (NA ) & (NA ) \tabularnewline
\hline
\end{tabular}
%Source: https://freestatistics.org/blog/index.php?pk=301276&T=1

[TABLE]
[ROW][C]ARIMA Parameter Estimation and Backward Selection[/C][/ROW]
[ROW][C]Iteration[/C][C]ar1[/C][C]ar2[/C][C]ar3[/C][C]ma1[/C][C]sar1[/C][C]sar2[/C][C]sma1[/C][/ROW]
[ROW][C]Estimates ( 1 )[/C][C]0.8388[/C][C]0.1582[/C][C]-0.0944[/C][C]-0.621[/C][C]-0.0576[/C][C]-0.0529[/C][C]-1[/C][/ROW]
[ROW][C](p-val)[/C][C](0.0052 )[/C][C](0.3234 )[/C][C](0.5712 )[/C][C](0.023 )[/C][C](0.6458 )[/C][C](0.6441 )[/C][C](0 )[/C][/ROW]
[ROW][C]Estimates ( 2 )[/C][C]0.874[/C][C]0.1241[/C][C]-0.0965[/C][C]-0.6505[/C][C]0[/C][C]-0.0379[/C][C]-1[/C][/ROW]
[ROW][C](p-val)[/C][C](0.0024 )[/C][C](0.3849 )[/C][C](0.543 )[/C][C](0.0132 )[/C][C](NA )[/C][C](0.7287 )[/C][C](0 )[/C][/ROW]
[ROW][C]Estimates ( 3 )[/C][C]0.8512[/C][C]0.1213[/C][C]-0.0805[/C][C]-0.6315[/C][C]0[/C][C]0[/C][C]-1[/C][/ROW]
[ROW][C](p-val)[/C][C](0.0054 )[/C][C](0.3977 )[/C][C](0.6129 )[/C][C](0.0263 )[/C][C](NA )[/C][C](NA )[/C][C](0 )[/C][/ROW]
[ROW][C]Estimates ( 4 )[/C][C]0.702[/C][C]0.1379[/C][C]0[/C][C]-0.4837[/C][C]0[/C][C]0[/C][C]-1[/C][/ROW]
[ROW][C](p-val)[/C][C](0.0123 )[/C][C](0.4182 )[/C][C](NA )[/C][C](0.0737 )[/C][C](NA )[/C][C](NA )[/C][C](0 )[/C][/ROW]
[ROW][C]Estimates ( 5 )[/C][C]0.8957[/C][C]0[/C][C]0[/C][C]-0.6338[/C][C]0[/C][C]0[/C][C]-1[/C][/ROW]
[ROW][C](p-val)[/C][C](0 )[/C][C](NA )[/C][C](NA )[/C][C](0 )[/C][C](NA )[/C][C](NA )[/C][C](0 )[/C][/ROW]
[ROW][C]Estimates ( 6 )[/C][C]NA[/C][C]NA[/C][C]NA[/C][C]NA[/C][C]NA[/C][C]NA[/C][C]NA[/C][/ROW]
[ROW][C](p-val)[/C][C](NA )[/C][C](NA )[/C][C](NA )[/C][C](NA )[/C][C](NA )[/C][C](NA )[/C][C](NA )[/C][/ROW]
[ROW][C]Estimates ( 7 )[/C][C]NA[/C][C]NA[/C][C]NA[/C][C]NA[/C][C]NA[/C][C]NA[/C][C]NA[/C][/ROW]
[ROW][C](p-val)[/C][C](NA )[/C][C](NA )[/C][C](NA )[/C][C](NA )[/C][C](NA )[/C][C](NA )[/C][C](NA )[/C][/ROW]
[ROW][C]Estimates ( 8 )[/C][C]NA[/C][C]NA[/C][C]NA[/C][C]NA[/C][C]NA[/C][C]NA[/C][C]NA[/C][/ROW]
[ROW][C](p-val)[/C][C](NA )[/C][C](NA )[/C][C](NA )[/C][C](NA )[/C][C](NA )[/C][C](NA )[/C][C](NA )[/C][/ROW]
[ROW][C]Estimates ( 9 )[/C][C]NA[/C][C]NA[/C][C]NA[/C][C]NA[/C][C]NA[/C][C]NA[/C][C]NA[/C][/ROW]
[ROW][C](p-val)[/C][C](NA )[/C][C](NA )[/C][C](NA )[/C][C](NA )[/C][C](NA )[/C][C](NA )[/C][C](NA )[/C][/ROW]
[ROW][C]Estimates ( 10 )[/C][C]NA[/C][C]NA[/C][C]NA[/C][C]NA[/C][C]NA[/C][C]NA[/C][C]NA[/C][/ROW]
[ROW][C](p-val)[/C][C](NA )[/C][C](NA )[/C][C](NA )[/C][C](NA )[/C][C](NA )[/C][C](NA )[/C][C](NA )[/C][/ROW]
[ROW][C]Estimates ( 11 )[/C][C]NA[/C][C]NA[/C][C]NA[/C][C]NA[/C][C]NA[/C][C]NA[/C][C]NA[/C][/ROW]
[ROW][C](p-val)[/C][C](NA )[/C][C](NA )[/C][C](NA )[/C][C](NA )[/C][C](NA )[/C][C](NA )[/C][C](NA )[/C][/ROW]
[ROW][C]Estimates ( 12 )[/C][C]NA[/C][C]NA[/C][C]NA[/C][C]NA[/C][C]NA[/C][C]NA[/C][C]NA[/C][/ROW]
[ROW][C](p-val)[/C][C](NA )[/C][C](NA )[/C][C](NA )[/C][C](NA )[/C][C](NA )[/C][C](NA )[/C][C](NA )[/C][/ROW]
[ROW][C]Estimates ( 13 )[/C][C]NA[/C][C]NA[/C][C]NA[/C][C]NA[/C][C]NA[/C][C]NA[/C][C]NA[/C][/ROW]
[ROW][C](p-val)[/C][C](NA )[/C][C](NA )[/C][C](NA )[/C][C](NA )[/C][C](NA )[/C][C](NA )[/C][C](NA )[/C][/ROW]
[/TABLE]
Source: https://freestatistics.org/blog/index.php?pk=301276&T=1

Globally Unique Identifier (entire table): ba.freestatistics.org/blog/index.php?pk=301276&T=1

As an alternative you can also use a QR Code:  

The GUIDs for individual cells are displayed in the table below:

ARIMA Parameter Estimation and Backward Selection
Iterationar1ar2ar3ma1sar1sar2sma1
Estimates ( 1 )0.83880.1582-0.0944-0.621-0.0576-0.0529-1
(p-val)(0.0052 )(0.3234 )(0.5712 )(0.023 )(0.6458 )(0.6441 )(0 )
Estimates ( 2 )0.8740.1241-0.0965-0.65050-0.0379-1
(p-val)(0.0024 )(0.3849 )(0.543 )(0.0132 )(NA )(0.7287 )(0 )
Estimates ( 3 )0.85120.1213-0.0805-0.631500-1
(p-val)(0.0054 )(0.3977 )(0.6129 )(0.0263 )(NA )(NA )(0 )
Estimates ( 4 )0.7020.13790-0.483700-1
(p-val)(0.0123 )(0.4182 )(NA )(0.0737 )(NA )(NA )(0 )
Estimates ( 5 )0.895700-0.633800-1
(p-val)(0 )(NA )(NA )(0 )(NA )(NA )(0 )
Estimates ( 6 )NANANANANANANA
(p-val)(NA )(NA )(NA )(NA )(NA )(NA )(NA )
Estimates ( 7 )NANANANANANANA
(p-val)(NA )(NA )(NA )(NA )(NA )(NA )(NA )
Estimates ( 8 )NANANANANANANA
(p-val)(NA )(NA )(NA )(NA )(NA )(NA )(NA )
Estimates ( 9 )NANANANANANANA
(p-val)(NA )(NA )(NA )(NA )(NA )(NA )(NA )
Estimates ( 10 )NANANANANANANA
(p-val)(NA )(NA )(NA )(NA )(NA )(NA )(NA )
Estimates ( 11 )NANANANANANANA
(p-val)(NA )(NA )(NA )(NA )(NA )(NA )(NA )
Estimates ( 12 )NANANANANANANA
(p-val)(NA )(NA )(NA )(NA )(NA )(NA )(NA )
Estimates ( 13 )NANANANANANANA
(p-val)(NA )(NA )(NA )(NA )(NA )(NA )(NA )


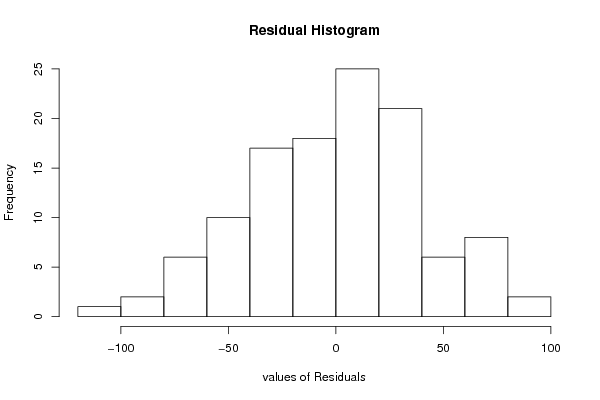
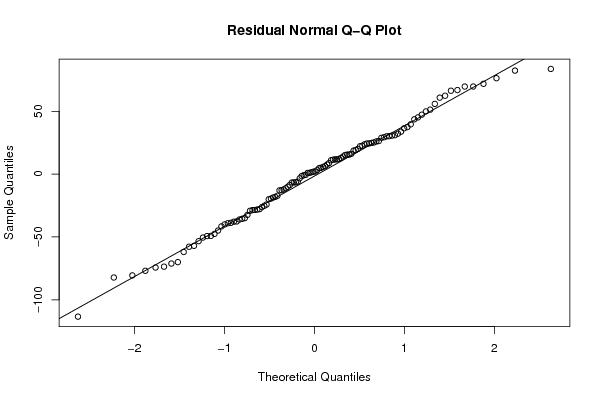
Estimated ARIMA Residuals
Value
-12.2240012648942
2.11866740779379
37.4274406125409
30.100431882391
-17.2258025595306
36.4439341797012
83.673738279454
-40.0029742341087
-53.3404499217993
49.9064475852378
76.3043208478708
-49.2635699777173
69.6802077506195
8.83705206550683
69.7043110436911
5.78006896520063
-32.4149230435131
-36.093914945969
-82.2378514236693
-39.0661339647818
-47.5199184515068
5.04821617973538
-10.0545014207306
7.64545970744395
-57.0366679369963
22.1892877069209
-19.4687753583353
-12.8793042849506
-18.1091767801118
28.9082230281741
-37.8597884961562
20.0913823473699
-113.371567006795
-5.98377181866131
26.3194518152727
11.7050227410717
11.4661966265339
14.0574515333756
-8.67270102158855
-76.8864854667724
51.2837854132075
-27.825225264845
25.2119358276317
12.1106089846209
15.5954620996426
-28.1576754825969
11.758977063922
43.6079781142527
15.255500446691
1.03500368829365
-44.8807437875102
-49.1794072778005
60.8293024565152
24.8167850330483
47.274263593349
24.3414389392455
-0.594698793247143
-6.50057000069406
66.8784429223507
-18.6016153788621
33.7807971441917
22.5306696386391
30.9899463355744
11.0837166385798
6.41119177593268
-41.5577618402703
-11.2506494018449
12.8409544140984
71.8496727050344
29.3448055632534
16.1676370125857
-74.2978864580847
-29.1811325782315
-0.899847149251543
66.3282340564023
-28.6050918220866
-50.4640484118613
19.0996020361953
-20.0026228278761
-73.6222510751042
30.660089714267
-28.5073356224924
-26.1607514624247
32.1944831064042
26.0124180074601
-35.5316432629232
55.8846058435024
-80.5451098348197
1.93690244621857
82.3536796800842
4.89384188995559
-3.29636167851328
-6.6744396348908
-12.815006772544
-57.7656489712669
-69.9947475483444
-38.7201520112976
-61.9329618422222
24.4187083716242
39.6506913306102
23.6934145699715
18.685424700154
-24.1724668441972
-25.2162205376708
-6.58329925071118
-37.6583759109314
-35.0196191141765
15.4927823516227
30.2132130615442
62.3524512236008
-71.1179114867714
45.1526026340597

\begin{tabular}{lllllllll}
\hline
Estimated ARIMA Residuals \tabularnewline
Value \tabularnewline
-12.2240012648942 \tabularnewline
2.11866740779379 \tabularnewline
37.4274406125409 \tabularnewline
30.100431882391 \tabularnewline
-17.2258025595306 \tabularnewline
36.4439341797012 \tabularnewline
83.673738279454 \tabularnewline
-40.0029742341087 \tabularnewline
-53.3404499217993 \tabularnewline
49.9064475852378 \tabularnewline
76.3043208478708 \tabularnewline
-49.2635699777173 \tabularnewline
69.6802077506195 \tabularnewline
8.83705206550683 \tabularnewline
69.7043110436911 \tabularnewline
5.78006896520063 \tabularnewline
-32.4149230435131 \tabularnewline
-36.093914945969 \tabularnewline
-82.2378514236693 \tabularnewline
-39.0661339647818 \tabularnewline
-47.5199184515068 \tabularnewline
5.04821617973538 \tabularnewline
-10.0545014207306 \tabularnewline
7.64545970744395 \tabularnewline
-57.0366679369963 \tabularnewline
22.1892877069209 \tabularnewline
-19.4687753583353 \tabularnewline
-12.8793042849506 \tabularnewline
-18.1091767801118 \tabularnewline
28.9082230281741 \tabularnewline
-37.8597884961562 \tabularnewline
20.0913823473699 \tabularnewline
-113.371567006795 \tabularnewline
-5.98377181866131 \tabularnewline
26.3194518152727 \tabularnewline
11.7050227410717 \tabularnewline
11.4661966265339 \tabularnewline
14.0574515333756 \tabularnewline
-8.67270102158855 \tabularnewline
-76.8864854667724 \tabularnewline
51.2837854132075 \tabularnewline
-27.825225264845 \tabularnewline
25.2119358276317 \tabularnewline
12.1106089846209 \tabularnewline
15.5954620996426 \tabularnewline
-28.1576754825969 \tabularnewline
11.758977063922 \tabularnewline
43.6079781142527 \tabularnewline
15.255500446691 \tabularnewline
1.03500368829365 \tabularnewline
-44.8807437875102 \tabularnewline
-49.1794072778005 \tabularnewline
60.8293024565152 \tabularnewline
24.8167850330483 \tabularnewline
47.274263593349 \tabularnewline
24.3414389392455 \tabularnewline
-0.594698793247143 \tabularnewline
-6.50057000069406 \tabularnewline
66.8784429223507 \tabularnewline
-18.6016153788621 \tabularnewline
33.7807971441917 \tabularnewline
22.5306696386391 \tabularnewline
30.9899463355744 \tabularnewline
11.0837166385798 \tabularnewline
6.41119177593268 \tabularnewline
-41.5577618402703 \tabularnewline
-11.2506494018449 \tabularnewline
12.8409544140984 \tabularnewline
71.8496727050344 \tabularnewline
29.3448055632534 \tabularnewline
16.1676370125857 \tabularnewline
-74.2978864580847 \tabularnewline
-29.1811325782315 \tabularnewline
-0.899847149251543 \tabularnewline
66.3282340564023 \tabularnewline
-28.6050918220866 \tabularnewline
-50.4640484118613 \tabularnewline
19.0996020361953 \tabularnewline
-20.0026228278761 \tabularnewline
-73.6222510751042 \tabularnewline
30.660089714267 \tabularnewline
-28.5073356224924 \tabularnewline
-26.1607514624247 \tabularnewline
32.1944831064042 \tabularnewline
26.0124180074601 \tabularnewline
-35.5316432629232 \tabularnewline
55.8846058435024 \tabularnewline
-80.5451098348197 \tabularnewline
1.93690244621857 \tabularnewline
82.3536796800842 \tabularnewline
4.89384188995559 \tabularnewline
-3.29636167851328 \tabularnewline
-6.6744396348908 \tabularnewline
-12.815006772544 \tabularnewline
-57.7656489712669 \tabularnewline
-69.9947475483444 \tabularnewline
-38.7201520112976 \tabularnewline
-61.9329618422222 \tabularnewline
24.4187083716242 \tabularnewline
39.6506913306102 \tabularnewline
23.6934145699715 \tabularnewline
18.685424700154 \tabularnewline
-24.1724668441972 \tabularnewline
-25.2162205376708 \tabularnewline
-6.58329925071118 \tabularnewline
-37.6583759109314 \tabularnewline
-35.0196191141765 \tabularnewline
15.4927823516227 \tabularnewline
30.2132130615442 \tabularnewline
62.3524512236008 \tabularnewline
-71.1179114867714 \tabularnewline
45.1526026340597 \tabularnewline
\hline
\end{tabular}
%Source: https://freestatistics.org/blog/index.php?pk=301276&T=2

[TABLE]
[ROW][C]Estimated ARIMA Residuals[/C][/ROW]
[ROW][C]Value[/C][/ROW]
[ROW][C]-12.2240012648942[/C][/ROW]
[ROW][C]2.11866740779379[/C][/ROW]
[ROW][C]37.4274406125409[/C][/ROW]
[ROW][C]30.100431882391[/C][/ROW]
[ROW][C]-17.2258025595306[/C][/ROW]
[ROW][C]36.4439341797012[/C][/ROW]
[ROW][C]83.673738279454[/C][/ROW]
[ROW][C]-40.0029742341087[/C][/ROW]
[ROW][C]-53.3404499217993[/C][/ROW]
[ROW][C]49.9064475852378[/C][/ROW]
[ROW][C]76.3043208478708[/C][/ROW]
[ROW][C]-49.2635699777173[/C][/ROW]
[ROW][C]69.6802077506195[/C][/ROW]
[ROW][C]8.83705206550683[/C][/ROW]
[ROW][C]69.7043110436911[/C][/ROW]
[ROW][C]5.78006896520063[/C][/ROW]
[ROW][C]-32.4149230435131[/C][/ROW]
[ROW][C]-36.093914945969[/C][/ROW]
[ROW][C]-82.2378514236693[/C][/ROW]
[ROW][C]-39.0661339647818[/C][/ROW]
[ROW][C]-47.5199184515068[/C][/ROW]
[ROW][C]5.04821617973538[/C][/ROW]
[ROW][C]-10.0545014207306[/C][/ROW]
[ROW][C]7.64545970744395[/C][/ROW]
[ROW][C]-57.0366679369963[/C][/ROW]
[ROW][C]22.1892877069209[/C][/ROW]
[ROW][C]-19.4687753583353[/C][/ROW]
[ROW][C]-12.8793042849506[/C][/ROW]
[ROW][C]-18.1091767801118[/C][/ROW]
[ROW][C]28.9082230281741[/C][/ROW]
[ROW][C]-37.8597884961562[/C][/ROW]
[ROW][C]20.0913823473699[/C][/ROW]
[ROW][C]-113.371567006795[/C][/ROW]
[ROW][C]-5.98377181866131[/C][/ROW]
[ROW][C]26.3194518152727[/C][/ROW]
[ROW][C]11.7050227410717[/C][/ROW]
[ROW][C]11.4661966265339[/C][/ROW]
[ROW][C]14.0574515333756[/C][/ROW]
[ROW][C]-8.67270102158855[/C][/ROW]
[ROW][C]-76.8864854667724[/C][/ROW]
[ROW][C]51.2837854132075[/C][/ROW]
[ROW][C]-27.825225264845[/C][/ROW]
[ROW][C]25.2119358276317[/C][/ROW]
[ROW][C]12.1106089846209[/C][/ROW]
[ROW][C]15.5954620996426[/C][/ROW]
[ROW][C]-28.1576754825969[/C][/ROW]
[ROW][C]11.758977063922[/C][/ROW]
[ROW][C]43.6079781142527[/C][/ROW]
[ROW][C]15.255500446691[/C][/ROW]
[ROW][C]1.03500368829365[/C][/ROW]
[ROW][C]-44.8807437875102[/C][/ROW]
[ROW][C]-49.1794072778005[/C][/ROW]
[ROW][C]60.8293024565152[/C][/ROW]
[ROW][C]24.8167850330483[/C][/ROW]
[ROW][C]47.274263593349[/C][/ROW]
[ROW][C]24.3414389392455[/C][/ROW]
[ROW][C]-0.594698793247143[/C][/ROW]
[ROW][C]-6.50057000069406[/C][/ROW]
[ROW][C]66.8784429223507[/C][/ROW]
[ROW][C]-18.6016153788621[/C][/ROW]
[ROW][C]33.7807971441917[/C][/ROW]
[ROW][C]22.5306696386391[/C][/ROW]
[ROW][C]30.9899463355744[/C][/ROW]
[ROW][C]11.0837166385798[/C][/ROW]
[ROW][C]6.41119177593268[/C][/ROW]
[ROW][C]-41.5577618402703[/C][/ROW]
[ROW][C]-11.2506494018449[/C][/ROW]
[ROW][C]12.8409544140984[/C][/ROW]
[ROW][C]71.8496727050344[/C][/ROW]
[ROW][C]29.3448055632534[/C][/ROW]
[ROW][C]16.1676370125857[/C][/ROW]
[ROW][C]-74.2978864580847[/C][/ROW]
[ROW][C]-29.1811325782315[/C][/ROW]
[ROW][C]-0.899847149251543[/C][/ROW]
[ROW][C]66.3282340564023[/C][/ROW]
[ROW][C]-28.6050918220866[/C][/ROW]
[ROW][C]-50.4640484118613[/C][/ROW]
[ROW][C]19.0996020361953[/C][/ROW]
[ROW][C]-20.0026228278761[/C][/ROW]
[ROW][C]-73.6222510751042[/C][/ROW]
[ROW][C]30.660089714267[/C][/ROW]
[ROW][C]-28.5073356224924[/C][/ROW]
[ROW][C]-26.1607514624247[/C][/ROW]
[ROW][C]32.1944831064042[/C][/ROW]
[ROW][C]26.0124180074601[/C][/ROW]
[ROW][C]-35.5316432629232[/C][/ROW]
[ROW][C]55.8846058435024[/C][/ROW]
[ROW][C]-80.5451098348197[/C][/ROW]
[ROW][C]1.93690244621857[/C][/ROW]
[ROW][C]82.3536796800842[/C][/ROW]
[ROW][C]4.89384188995559[/C][/ROW]
[ROW][C]-3.29636167851328[/C][/ROW]
[ROW][C]-6.6744396348908[/C][/ROW]
[ROW][C]-12.815006772544[/C][/ROW]
[ROW][C]-57.7656489712669[/C][/ROW]
[ROW][C]-69.9947475483444[/C][/ROW]
[ROW][C]-38.7201520112976[/C][/ROW]
[ROW][C]-61.9329618422222[/C][/ROW]
[ROW][C]24.4187083716242[/C][/ROW]
[ROW][C]39.6506913306102[/C][/ROW]
[ROW][C]23.6934145699715[/C][/ROW]
[ROW][C]18.685424700154[/C][/ROW]
[ROW][C]-24.1724668441972[/C][/ROW]
[ROW][C]-25.2162205376708[/C][/ROW]
[ROW][C]-6.58329925071118[/C][/ROW]
[ROW][C]-37.6583759109314[/C][/ROW]
[ROW][C]-35.0196191141765[/C][/ROW]
[ROW][C]15.4927823516227[/C][/ROW]
[ROW][C]30.2132130615442[/C][/ROW]
[ROW][C]62.3524512236008[/C][/ROW]
[ROW][C]-71.1179114867714[/C][/ROW]
[ROW][C]45.1526026340597[/C][/ROW]
[/TABLE]
Source: https://freestatistics.org/blog/index.php?pk=301276&T=2

Globally Unique Identifier (entire table): ba.freestatistics.org/blog/index.php?pk=301276&T=2

As an alternative you can also use a QR Code:  

The GUIDs for individual cells are displayed in the table below:

Estimated ARIMA Residuals
Value
-12.2240012648942
2.11866740779379
37.4274406125409
30.100431882391
-17.2258025595306
36.4439341797012
83.673738279454
-40.0029742341087
-53.3404499217993
49.9064475852378
76.3043208478708
-49.2635699777173
69.6802077506195
8.83705206550683
69.7043110436911
5.78006896520063
-32.4149230435131
-36.093914945969
-82.2378514236693
-39.0661339647818
-47.5199184515068
5.04821617973538
-10.0545014207306
7.64545970744395
-57.0366679369963
22.1892877069209
-19.4687753583353
-12.8793042849506
-18.1091767801118
28.9082230281741
-37.8597884961562
20.0913823473699
-113.371567006795
-5.98377181866131
26.3194518152727
11.7050227410717
11.4661966265339
14.0574515333756
-8.67270102158855
-76.8864854667724
51.2837854132075
-27.825225264845
25.2119358276317
12.1106089846209
15.5954620996426
-28.1576754825969
11.758977063922
43.6079781142527
15.255500446691
1.03500368829365
-44.8807437875102
-49.1794072778005
60.8293024565152
24.8167850330483
47.274263593349
24.3414389392455
-0.594698793247143
-6.50057000069406
66.8784429223507
-18.6016153788621
33.7807971441917
22.5306696386391
30.9899463355744
11.0837166385798
6.41119177593268
-41.5577618402703
-11.2506494018449
12.8409544140984
71.8496727050344
29.3448055632534
16.1676370125857
-74.2978864580847
-29.1811325782315
-0.899847149251543
66.3282340564023
-28.6050918220866
-50.4640484118613
19.0996020361953
-20.0026228278761
-73.6222510751042
30.660089714267
-28.5073356224924
-26.1607514624247
32.1944831064042
26.0124180074601
-35.5316432629232
55.8846058435024
-80.5451098348197
1.93690244621857
82.3536796800842
4.89384188995559
-3.29636167851328
-6.6744396348908
-12.815006772544
-57.7656489712669
-69.9947475483444
-38.7201520112976
-61.9329618422222
24.4187083716242
39.6506913306102
23.6934145699715
18.685424700154
-24.1724668441972
-25.2162205376708
-6.58329925071118
-37.6583759109314
-35.0196191141765
15.4927823516227
30.2132130615442
62.3524512236008
-71.1179114867714
45.1526026340597


Parameters (Session):
par1 = FALSE ; par2 = 1 ; par3 = 1 ; par4 = 1 ; par5 = 4 ; par6 = 3 ; par7 = 1 ; par8 = 2 ; par9 = 1 ;
Parameters (R input):
par1 = FALSE ; par2 = 1 ; par3 = 1 ; par4 = 1 ; par5 = 4 ; par6 = 3 ; par7 = 1 ; par8 = 2 ; par9 = 1 ;
R code (references can be found in the software module):
library(lattice)
if (par1 == 'TRUE') par1 <- TRUE
if (par1 == 'FALSE') par1 <- FALSE
par2 <- as.numeric(par2) #Box-Cox lambda transformation parameter
par3 <- as.numeric(par3) #degree of non-seasonal differencing
par4 <- as.numeric(par4) #degree of seasonal differencing
par5 <- as.numeric(par5) #seasonal period
par6 <- as.numeric(par6) #degree (p) of the non-seasonal AR(p) polynomial
par7 <- as.numeric(par7) #degree (q) of the non-seasonal MA(q) polynomial
par8 <- as.numeric(par8) #degree (P) of the seasonal AR(P) polynomial
par9 <- as.numeric(par9) #degree (Q) of the seasonal MA(Q) polynomial
armaGR <- function(arima.out, names, n){
try1 <- arima.out$coef
try2 <- sqrt(diag(arima.out$var.coef))
try.data.frame <- data.frame(matrix(NA,ncol=4,nrow=length(names)))
dimnames(try.data.frame) <- list(names,c('coef','std','tstat','pv'))
try.data.frame[,1] <- try1
for(i in 1:length(try2)) try.data.frame[which(rownames(try.data.frame)==names(try2)[i]),2] <- try2[i]
try.data.frame[,3] <- try.data.frame[,1] / try.data.frame[,2]
try.data.frame[,4] <- round((1-pt(abs(try.data.frame[,3]),df=n-(length(try2)+1)))*2,5)
vector <- rep(NA,length(names))
vector[is.na(try.data.frame[,4])] <- 0
maxi <- which.max(try.data.frame[,4])
continue <- max(try.data.frame[,4],na.rm=TRUE) > .05
vector[maxi] <- 0
list(summary=try.data.frame,next.vector=vector,continue=continue)
}
arimaSelect <- function(series, order=c(13,0,0), seasonal=list(order=c(2,0,0),period=12), include.mean=F){
nrc <- order[1]+order[3]+seasonal$order[1]+seasonal$order[3]
coeff <- matrix(NA, nrow=nrc*2, ncol=nrc)
pval <- matrix(NA, nrow=nrc*2, ncol=nrc)
mylist <- rep(list(NULL), nrc)
names <- NULL
if(order[1] > 0) names <- paste('ar',1:order[1],sep='')
if(order[3] > 0) names <- c( names , paste('ma',1:order[3],sep='') )
if(seasonal$order[1] > 0) names <- c(names, paste('sar',1:seasonal$order[1],sep=''))
if(seasonal$order[3] > 0) names <- c(names, paste('sma',1:seasonal$order[3],sep=''))
arima.out <- arima(series, order=order, seasonal=seasonal, include.mean=include.mean, method='ML')
mylist[[1]] <- arima.out
last.arma <- armaGR(arima.out, names, length(series))
mystop <- FALSE
i <- 1
coeff[i,] <- last.arma[[1]][,1]
pval [i,] <- last.arma[[1]][,4]
i <- 2
aic <- arima.out$aic
while(!mystop){
mylist[[i]] <- arima.out
arima.out <- arima(series, order=order, seasonal=seasonal, include.mean=include.mean, method='ML', fixed=last.arma$next.vector)
aic <- c(aic, arima.out$aic)
last.arma <- armaGR(arima.out, names, length(series))
mystop <- !last.arma$continue
coeff[i,] <- last.arma[[1]][,1]
pval [i,] <- last.arma[[1]][,4]
i <- i+1
}
list(coeff, pval, mylist, aic=aic)
}
arimaSelectplot <- function(arimaSelect.out,noms,choix){
noms <- names(arimaSelect.out[[3]][[1]]$coef)
coeff <- arimaSelect.out[[1]]
k <- min(which(is.na(coeff[,1])))-1
coeff <- coeff[1:k,]
pval <- arimaSelect.out[[2]][1:k,]
aic <- arimaSelect.out$aic[1:k]
coeff[coeff==0] <- NA
n <- ncol(coeff)
if(missing(choix)) choix <- k
layout(matrix(c(1,1,1,2,
3,3,3,2,
3,3,3,4,
5,6,7,7),nr=4),
widths=c(10,35,45,15),
heights=c(30,30,15,15))
couleurs <- rainbow(75)[1:50]#(50)
ticks <- pretty(coeff)
par(mar=c(1,1,3,1))
plot(aic,k:1-.5,type='o',pch=21,bg='blue',cex=2,axes=F,lty=2,xpd=NA)
points(aic[choix],k-choix+.5,pch=21,cex=4,bg=2,xpd=NA)
title('aic',line=2)
par(mar=c(3,0,0,0))
plot(0,axes=F,xlab='',ylab='',xlim=range(ticks),ylim=c(.1,1))
rect(xleft = min(ticks) + (0:49)/50*(max(ticks)-min(ticks)),
xright = min(ticks) + (1:50)/50*(max(ticks)-min(ticks)),
ytop = rep(1,50),
ybottom= rep(0,50),col=couleurs,border=NA)
axis(1,ticks)
rect(xleft=min(ticks),xright=max(ticks),ytop=1,ybottom=0)
text(mean(coeff,na.rm=T),.5,'coefficients',cex=2,font=2)
par(mar=c(1,1,3,1))
image(1:n,1:k,t(coeff[k:1,]),axes=F,col=couleurs,zlim=range(ticks))
for(i in 1:n) for(j in 1:k) if(!is.na(coeff[j,i])) {
if(pval[j,i]<.01) symb = 'green'
else if( (pval[j,i]<.05) & (pval[j,i]>=.01)) symb = 'orange'
else if( (pval[j,i]<.1) & (pval[j,i]>=.05)) symb = 'red'
else symb = 'black'
polygon(c(i+.5 ,i+.2 ,i+.5 ,i+.5),
c(k-j+0.5,k-j+0.5,k-j+0.8,k-j+0.5),
col=symb)
if(j==choix) {
rect(xleft=i-.5,
xright=i+.5,
ybottom=k-j+1.5,
ytop=k-j+.5,
lwd=4)
text(i,
k-j+1,
round(coeff[j,i],2),
cex=1.2,
font=2)
}
else{
rect(xleft=i-.5,xright=i+.5,ybottom=k-j+1.5,ytop=k-j+.5)
text(i,k-j+1,round(coeff[j,i],2),cex=1.2,font=1)
}
}
axis(3,1:n,noms)
par(mar=c(0.5,0,0,0.5))
plot(0,axes=F,xlab='',ylab='',type='n',xlim=c(0,8),ylim=c(-.2,.8))
cols <- c('green','orange','red','black')
niv <- c('0','0.01','0.05','0.1')
for(i in 0:3){
polygon(c(1+2*i ,1+2*i ,1+2*i-.5 ,1+2*i),
c(.4 ,.7 , .4 , .4),
col=cols[i+1])
text(2*i,0.5,niv[i+1],cex=1.5)
}
text(8,.5,1,cex=1.5)
text(4,0,'p-value',cex=2)
box()
residus <- arimaSelect.out[[3]][[choix]]$res
par(mar=c(1,2,4,1))
acf(residus,main='')
title('acf',line=.5)
par(mar=c(1,2,4,1))
pacf(residus,main='')
title('pacf',line=.5)
par(mar=c(2,2,4,1))
qqnorm(residus,main='')
title('qq-norm',line=.5)
qqline(residus)
residus
}
if (par2 == 0) x <- log(x)
if (par2 != 0) x <- x^par2
(selection <- arimaSelect(x, order=c(par6,par3,par7), seasonal=list(order=c(par8,par4,par9), period=par5)))
bitmap(file='test1.png')
resid <- arimaSelectplot(selection)
dev.off()
resid
bitmap(file='test2.png')
acf(resid,length(resid)/2, main='Residual Autocorrelation Function')
dev.off()
bitmap(file='test3.png')
pacf(resid,length(resid)/2, main='Residual Partial Autocorrelation Function')
dev.off()
bitmap(file='test4.png')
cpgram(resid, main='Residual Cumulative Periodogram')
dev.off()
bitmap(file='test5.png')
hist(resid, main='Residual Histogram', xlab='values of Residuals')
dev.off()
bitmap(file='test6.png')
densityplot(~resid,col='black',main='Residual Density Plot', xlab='values of Residuals')
dev.off()
bitmap(file='test7.png')
qqnorm(resid, main='Residual Normal Q-Q Plot')
qqline(resid)
dev.off()
ncols <- length(selection[[1]][1,])
nrows <- length(selection[[2]][,1])-1
load(file='createtable')
a<-table.start()
a<-table.row.start(a)
a<-table.element(a,'ARIMA Parameter Estimation and Backward Selection', ncols+1,TRUE)
a<-table.row.end(a)
a<-table.row.start(a)
a<-table.element(a,'Iteration', header=TRUE)
for (i in 1:ncols) {
a<-table.element(a,names(selection[[3]][[1]]$coef)[i],header=TRUE)
}
a<-table.row.end(a)
for (j in 1:nrows) {
a<-table.row.start(a)
mydum <- 'Estimates ('
mydum <- paste(mydum,j)
mydum <- paste(mydum,')')
a<-table.element(a,mydum, header=TRUE)
for (i in 1:ncols) {
a<-table.element(a,round(selection[[1]][j,i],4))
}
a<-table.row.end(a)
a<-table.row.start(a)
a<-table.element(a,'(p-val)', header=TRUE)
for (i in 1:ncols) {
mydum <- '('
mydum <- paste(mydum,round(selection[[2]][j,i],4),sep='')
mydum <- paste(mydum,')')
a<-table.element(a,mydum)
}
a<-table.row.end(a)
}
a<-table.end(a)
table.save(a,file='mytable.tab')
a<-table.start()
a<-table.row.start(a)
a<-table.element(a,'Estimated ARIMA Residuals', 1,TRUE)
a<-table.row.end(a)
a<-table.row.start(a)
a<-table.element(a,'Value', 1,TRUE)
a<-table.row.end(a)
for (i in (par4*par5+par3):length(resid)) {
a<-table.row.start(a)
a<-table.element(a,resid[i])
a<-table.row.end(a)
}
a<-table.end(a)
table.save(a,file='mytable1.tab')