Free Statistics

of Irreproducible Research!

Author's title

Author*The author of this computation has been verified*
R Software Modulerwasp_arimabackwardselection.wasp
Title produced by softwareARIMA Backward Selection
Date of computationThu, 15 Dec 2016 12:03:59 +0100
Cite this page as followsStatistical Computations at FreeStatistics.org, Office for Research Development and Education, URL https://freestatistics.org/blog/index.php?v=date/2016/Dec/15/t1481800773sgke416ze6priht.htm/, Retrieved Sat, 18 May 2024 07:45:08 +0000
Statistical Computations at FreeStatistics.org, Office for Research Development and Education, URL https://freestatistics.org/blog/index.php?pk=299873, Retrieved Sat, 18 May 2024 07:45:08 +0000
QR Codes:

Original text written by user:
IsPrivate?No (this computation is public)
User-defined keywords
Estimated Impact45
Family? (F = Feedback message, R = changed R code, M = changed R Module, P = changed Parameters, D = changed Data)
-       [ARIMA Backward Selection] [F1 ARIMA backward ] [2016-12-15 11:03:59] [10299735033611e1e2dae6371997f8c9] [Current]
Feedback Forum

Post a new message
Dataseries X:
7235.6
7268.3
7271.3
7327.4
7339.5
7303.2
7300.7
7311.8
7329
7330.8
7328.6
7346.5
7356.9
7385.7
7394.9
7422.8
7446.6
7441.2
7476.1
7461.6
7450.2
7483.8
7479.7
7509.3
7518.6
7495.4
7507.5
7533.8
7544.7
7564.7
7573.6
7604.6
7605.6
7619.9
7661
7664.1
7663.9
7652.1
7632.8
7677.7
7677.3
7727
7746.4
7771.2
7781.2
7819.4
7819.1
7849.1
7757.8
7823
7825.6
7827
7884.7
7912
7897
7881.1
7885.8
7891.3
7920.9
7946.3
7952.3
8001.9
8007.9
8028.1
8012.5
8069.6
8082.7
8110.6
8129
8149.4
8139.7
8162.4
8207.7
8215.5
8244.6
8269
8245.6
8244.6
8287.6
8284.3
8290.6
8325
8344.2
8353.6
8367.8
8334.6
8330.2
8368.2
8384.7
8351.4
8411.4
8442.8
8443.1
8462.6
8508.5
8522.7
8559.6
8556.7
8618.9
8613.2
8634
8653.4


Summary of computational transaction
Raw Input view raw input (R code)
Raw Outputview raw output of R engine
Computing time3 seconds
R ServerBig Analytics Cloud Computing Center

\begin{tabular}{lllllllll}
\hline
Summary of computational transaction \tabularnewline
Raw Input view raw input (R code)  \tabularnewline
Raw Outputview raw output of R engine  \tabularnewline
Computing time3 seconds \tabularnewline
R ServerBig Analytics Cloud Computing Center \tabularnewline
\hline
\end{tabular}
%Source: https://freestatistics.org/blog/index.php?pk=299873&T=0

[TABLE]
[ROW]
Summary of computational transaction[/C][/ROW] [ROW]Raw Input[/C] view raw input (R code) [/C][/ROW] [ROW]Raw Output[/C]view raw output of R engine [/C][/ROW] [ROW]Computing time[/C]3 seconds[/C][/ROW] [ROW]R Server[/C]Big Analytics Cloud Computing Center[/C][/ROW] [/TABLE] Source: https://freestatistics.org/blog/index.php?pk=299873&T=0

Globally Unique Identifier (entire table): ba.freestatistics.org/blog/index.php?pk=299873&T=0

As an alternative you can also use a QR Code:  

The GUIDs for individual cells are displayed in the table below:

Summary of computational transaction
Raw Input view raw input (R code)
Raw Outputview raw output of R engine
Computing time3 seconds
R ServerBig Analytics Cloud Computing Center


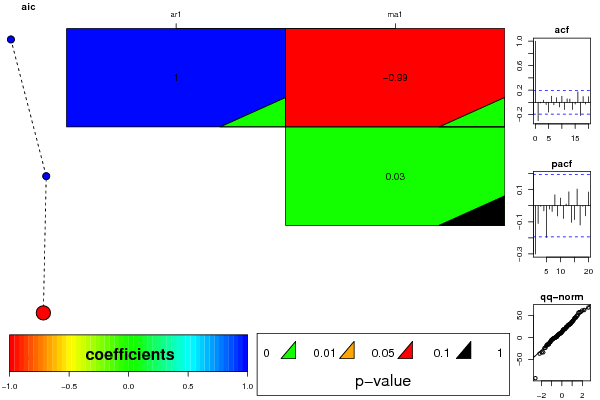
ARIMA Parameter Estimation and Backward Selection
Iterationar1ma1
Estimates ( 1 )0.9999-0.9909
(p-val)(0 )(0 )
Estimates ( 2 )00.0299
(p-val)(NA )(0.7219 )
Estimates ( 3 )00
(p-val)(NA )(NA )

\begin{tabular}{lllllllll}
\hline
ARIMA Parameter Estimation and Backward Selection \tabularnewline
Iteration & ar1 & ma1 \tabularnewline
Estimates ( 1 ) & 0.9999 & -0.9909 \tabularnewline
(p-val) & (0 ) & (0 ) \tabularnewline
Estimates ( 2 ) & 0 & 0.0299 \tabularnewline
(p-val) & (NA ) & (0.7219 ) \tabularnewline
Estimates ( 3 ) & 0 & 0 \tabularnewline
(p-val) & (NA ) & (NA ) \tabularnewline
\hline
\end{tabular}
%Source: https://freestatistics.org/blog/index.php?pk=299873&T=1

[TABLE]
[ROW][C]ARIMA Parameter Estimation and Backward Selection[/C][/ROW]
[ROW][C]Iteration[/C][C]ar1[/C][C]ma1[/C][/ROW]
[ROW][C]Estimates ( 1 )[/C][C]0.9999[/C][C]-0.9909[/C][/ROW]
[ROW][C](p-val)[/C][C](0 )[/C][C](0 )[/C][/ROW]
[ROW][C]Estimates ( 2 )[/C][C]0[/C][C]0.0299[/C][/ROW]
[ROW][C](p-val)[/C][C](NA )[/C][C](0.7219 )[/C][/ROW]
[ROW][C]Estimates ( 3 )[/C][C]0[/C][C]0[/C][/ROW]
[ROW][C](p-val)[/C][C](NA )[/C][C](NA )[/C][/ROW]
[/TABLE]
Source: https://freestatistics.org/blog/index.php?pk=299873&T=1

Globally Unique Identifier (entire table): ba.freestatistics.org/blog/index.php?pk=299873&T=1

As an alternative you can also use a QR Code:  

The GUIDs for individual cells are displayed in the table below:

ARIMA Parameter Estimation and Backward Selection
Iterationar1ma1
Estimates ( 1 )0.9999-0.9909
(p-val)(0 )(0 )
Estimates ( 2 )00.0299
(p-val)(NA )(0.7219 )
Estimates ( 3 )00
(p-val)(NA )(NA )


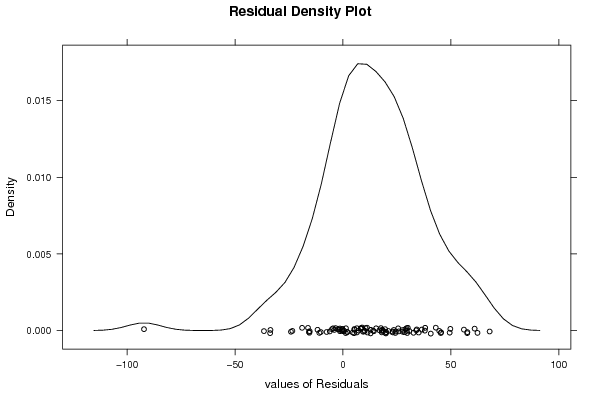
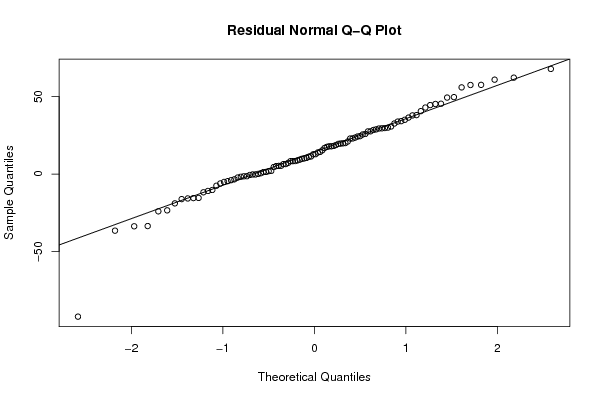
Estimated ARIMA Residuals
Value
7.23559637896618
32.6851665225879
2.02281837898255
56.039497228898
10.4238509498421
-36.6117788120655
-1.40493667258215
11.1420218486355
16.8667405978176
1.2955134745971
-2.23874898577014
17.9669612893213
9.86260572276296
28.5050081096797
8.3474112965423
27.6503277828533
22.9729749023809
-6.08712483123054
35.082066738858
-15.5493094294307
-10.9349180215959
33.9270648983011
-5.11476316591325
29.7529832680402
8.41008418833371
-23.4515467719402
12.8014389815098
25.9171072037016
10.124815767701
19.6971653712599
8.31085508128854
30.7514211842663
0.0802207732731404
14.2976005856644
40.6723568048474
1.88348422770559
-0.256335271666103
-11.7923329768546
-18.9472897027499
45.4667160345834
-1.75991571464328
49.7526393204862
17.9118917318447
24.264252860783
9.27425286787002
37.9226058242912
-1.43427034319848
30.0428992227471
-92.198587237649
67.9576723939563
0.567376694881204
1.38302968521111
57.6586333923633
25.5754223644499
-15.7649643918776
-15.42846775208
5.16146758725608
5.34561979630962
29.440111778471
24.5194422175127
5.26662011919871
49.4424746696523
4.52116879910591
20.0647712209138
-16.2001400601112
57.5845484118627
11.377638256381
27.5596932787366
17.5756857928336
19.8743088265455
-10.2944433037637
23.0079082116163
44.6118303086987
6.46565403470777
28.9066114007328
23.5353992870059
-24.1039470217383
-0.279047637510303
43.0083463531228
-4.58638554018216
6.43717942076182
34.2074630803418
18.1768500859926
8.85632792005708
13.9351060168192
-33.616800932863
-3.39451687186011
38.1015304653665
15.3603779962377
-33.7594310133172
61.0097492134137
29.5751900304676
-0.584597991535702
19.5174854061333
45.3162293336973
12.8445853632275
36.5158166895035
-3.99219308716602
62.3194070429672
-7.56398201489901
21.0262397398456
18.7711022845742

\begin{tabular}{lllllllll}
\hline
Estimated ARIMA Residuals \tabularnewline
Value \tabularnewline
7.23559637896618 \tabularnewline
32.6851665225879 \tabularnewline
2.02281837898255 \tabularnewline
56.039497228898 \tabularnewline
10.4238509498421 \tabularnewline
-36.6117788120655 \tabularnewline
-1.40493667258215 \tabularnewline
11.1420218486355 \tabularnewline
16.8667405978176 \tabularnewline
1.2955134745971 \tabularnewline
-2.23874898577014 \tabularnewline
17.9669612893213 \tabularnewline
9.86260572276296 \tabularnewline
28.5050081096797 \tabularnewline
8.3474112965423 \tabularnewline
27.6503277828533 \tabularnewline
22.9729749023809 \tabularnewline
-6.08712483123054 \tabularnewline
35.082066738858 \tabularnewline
-15.5493094294307 \tabularnewline
-10.9349180215959 \tabularnewline
33.9270648983011 \tabularnewline
-5.11476316591325 \tabularnewline
29.7529832680402 \tabularnewline
8.41008418833371 \tabularnewline
-23.4515467719402 \tabularnewline
12.8014389815098 \tabularnewline
25.9171072037016 \tabularnewline
10.124815767701 \tabularnewline
19.6971653712599 \tabularnewline
8.31085508128854 \tabularnewline
30.7514211842663 \tabularnewline
0.0802207732731404 \tabularnewline
14.2976005856644 \tabularnewline
40.6723568048474 \tabularnewline
1.88348422770559 \tabularnewline
-0.256335271666103 \tabularnewline
-11.7923329768546 \tabularnewline
-18.9472897027499 \tabularnewline
45.4667160345834 \tabularnewline
-1.75991571464328 \tabularnewline
49.7526393204862 \tabularnewline
17.9118917318447 \tabularnewline
24.264252860783 \tabularnewline
9.27425286787002 \tabularnewline
37.9226058242912 \tabularnewline
-1.43427034319848 \tabularnewline
30.0428992227471 \tabularnewline
-92.198587237649 \tabularnewline
67.9576723939563 \tabularnewline
0.567376694881204 \tabularnewline
1.38302968521111 \tabularnewline
57.6586333923633 \tabularnewline
25.5754223644499 \tabularnewline
-15.7649643918776 \tabularnewline
-15.42846775208 \tabularnewline
5.16146758725608 \tabularnewline
5.34561979630962 \tabularnewline
29.440111778471 \tabularnewline
24.5194422175127 \tabularnewline
5.26662011919871 \tabularnewline
49.4424746696523 \tabularnewline
4.52116879910591 \tabularnewline
20.0647712209138 \tabularnewline
-16.2001400601112 \tabularnewline
57.5845484118627 \tabularnewline
11.377638256381 \tabularnewline
27.5596932787366 \tabularnewline
17.5756857928336 \tabularnewline
19.8743088265455 \tabularnewline
-10.2944433037637 \tabularnewline
23.0079082116163 \tabularnewline
44.6118303086987 \tabularnewline
6.46565403470777 \tabularnewline
28.9066114007328 \tabularnewline
23.5353992870059 \tabularnewline
-24.1039470217383 \tabularnewline
-0.279047637510303 \tabularnewline
43.0083463531228 \tabularnewline
-4.58638554018216 \tabularnewline
6.43717942076182 \tabularnewline
34.2074630803418 \tabularnewline
18.1768500859926 \tabularnewline
8.85632792005708 \tabularnewline
13.9351060168192 \tabularnewline
-33.616800932863 \tabularnewline
-3.39451687186011 \tabularnewline
38.1015304653665 \tabularnewline
15.3603779962377 \tabularnewline
-33.7594310133172 \tabularnewline
61.0097492134137 \tabularnewline
29.5751900304676 \tabularnewline
-0.584597991535702 \tabularnewline
19.5174854061333 \tabularnewline
45.3162293336973 \tabularnewline
12.8445853632275 \tabularnewline
36.5158166895035 \tabularnewline
-3.99219308716602 \tabularnewline
62.3194070429672 \tabularnewline
-7.56398201489901 \tabularnewline
21.0262397398456 \tabularnewline
18.7711022845742 \tabularnewline
\hline
\end{tabular}
%Source: https://freestatistics.org/blog/index.php?pk=299873&T=2

[TABLE]
[ROW][C]Estimated ARIMA Residuals[/C][/ROW]
[ROW][C]Value[/C][/ROW]
[ROW][C]7.23559637896618[/C][/ROW]
[ROW][C]32.6851665225879[/C][/ROW]
[ROW][C]2.02281837898255[/C][/ROW]
[ROW][C]56.039497228898[/C][/ROW]
[ROW][C]10.4238509498421[/C][/ROW]
[ROW][C]-36.6117788120655[/C][/ROW]
[ROW][C]-1.40493667258215[/C][/ROW]
[ROW][C]11.1420218486355[/C][/ROW]
[ROW][C]16.8667405978176[/C][/ROW]
[ROW][C]1.2955134745971[/C][/ROW]
[ROW][C]-2.23874898577014[/C][/ROW]
[ROW][C]17.9669612893213[/C][/ROW]
[ROW][C]9.86260572276296[/C][/ROW]
[ROW][C]28.5050081096797[/C][/ROW]
[ROW][C]8.3474112965423[/C][/ROW]
[ROW][C]27.6503277828533[/C][/ROW]
[ROW][C]22.9729749023809[/C][/ROW]
[ROW][C]-6.08712483123054[/C][/ROW]
[ROW][C]35.082066738858[/C][/ROW]
[ROW][C]-15.5493094294307[/C][/ROW]
[ROW][C]-10.9349180215959[/C][/ROW]
[ROW][C]33.9270648983011[/C][/ROW]
[ROW][C]-5.11476316591325[/C][/ROW]
[ROW][C]29.7529832680402[/C][/ROW]
[ROW][C]8.41008418833371[/C][/ROW]
[ROW][C]-23.4515467719402[/C][/ROW]
[ROW][C]12.8014389815098[/C][/ROW]
[ROW][C]25.9171072037016[/C][/ROW]
[ROW][C]10.124815767701[/C][/ROW]
[ROW][C]19.6971653712599[/C][/ROW]
[ROW][C]8.31085508128854[/C][/ROW]
[ROW][C]30.7514211842663[/C][/ROW]
[ROW][C]0.0802207732731404[/C][/ROW]
[ROW][C]14.2976005856644[/C][/ROW]
[ROW][C]40.6723568048474[/C][/ROW]
[ROW][C]1.88348422770559[/C][/ROW]
[ROW][C]-0.256335271666103[/C][/ROW]
[ROW][C]-11.7923329768546[/C][/ROW]
[ROW][C]-18.9472897027499[/C][/ROW]
[ROW][C]45.4667160345834[/C][/ROW]
[ROW][C]-1.75991571464328[/C][/ROW]
[ROW][C]49.7526393204862[/C][/ROW]
[ROW][C]17.9118917318447[/C][/ROW]
[ROW][C]24.264252860783[/C][/ROW]
[ROW][C]9.27425286787002[/C][/ROW]
[ROW][C]37.9226058242912[/C][/ROW]
[ROW][C]-1.43427034319848[/C][/ROW]
[ROW][C]30.0428992227471[/C][/ROW]
[ROW][C]-92.198587237649[/C][/ROW]
[ROW][C]67.9576723939563[/C][/ROW]
[ROW][C]0.567376694881204[/C][/ROW]
[ROW][C]1.38302968521111[/C][/ROW]
[ROW][C]57.6586333923633[/C][/ROW]
[ROW][C]25.5754223644499[/C][/ROW]
[ROW][C]-15.7649643918776[/C][/ROW]
[ROW][C]-15.42846775208[/C][/ROW]
[ROW][C]5.16146758725608[/C][/ROW]
[ROW][C]5.34561979630962[/C][/ROW]
[ROW][C]29.440111778471[/C][/ROW]
[ROW][C]24.5194422175127[/C][/ROW]
[ROW][C]5.26662011919871[/C][/ROW]
[ROW][C]49.4424746696523[/C][/ROW]
[ROW][C]4.52116879910591[/C][/ROW]
[ROW][C]20.0647712209138[/C][/ROW]
[ROW][C]-16.2001400601112[/C][/ROW]
[ROW][C]57.5845484118627[/C][/ROW]
[ROW][C]11.377638256381[/C][/ROW]
[ROW][C]27.5596932787366[/C][/ROW]
[ROW][C]17.5756857928336[/C][/ROW]
[ROW][C]19.8743088265455[/C][/ROW]
[ROW][C]-10.2944433037637[/C][/ROW]
[ROW][C]23.0079082116163[/C][/ROW]
[ROW][C]44.6118303086987[/C][/ROW]
[ROW][C]6.46565403470777[/C][/ROW]
[ROW][C]28.9066114007328[/C][/ROW]
[ROW][C]23.5353992870059[/C][/ROW]
[ROW][C]-24.1039470217383[/C][/ROW]
[ROW][C]-0.279047637510303[/C][/ROW]
[ROW][C]43.0083463531228[/C][/ROW]
[ROW][C]-4.58638554018216[/C][/ROW]
[ROW][C]6.43717942076182[/C][/ROW]
[ROW][C]34.2074630803418[/C][/ROW]
[ROW][C]18.1768500859926[/C][/ROW]
[ROW][C]8.85632792005708[/C][/ROW]
[ROW][C]13.9351060168192[/C][/ROW]
[ROW][C]-33.616800932863[/C][/ROW]
[ROW][C]-3.39451687186011[/C][/ROW]
[ROW][C]38.1015304653665[/C][/ROW]
[ROW][C]15.3603779962377[/C][/ROW]
[ROW][C]-33.7594310133172[/C][/ROW]
[ROW][C]61.0097492134137[/C][/ROW]
[ROW][C]29.5751900304676[/C][/ROW]
[ROW][C]-0.584597991535702[/C][/ROW]
[ROW][C]19.5174854061333[/C][/ROW]
[ROW][C]45.3162293336973[/C][/ROW]
[ROW][C]12.8445853632275[/C][/ROW]
[ROW][C]36.5158166895035[/C][/ROW]
[ROW][C]-3.99219308716602[/C][/ROW]
[ROW][C]62.3194070429672[/C][/ROW]
[ROW][C]-7.56398201489901[/C][/ROW]
[ROW][C]21.0262397398456[/C][/ROW]
[ROW][C]18.7711022845742[/C][/ROW]
[/TABLE]
Source: https://freestatistics.org/blog/index.php?pk=299873&T=2

Globally Unique Identifier (entire table): ba.freestatistics.org/blog/index.php?pk=299873&T=2

As an alternative you can also use a QR Code:  

The GUIDs for individual cells are displayed in the table below:

Estimated ARIMA Residuals
Value
7.23559637896618
32.6851665225879
2.02281837898255
56.039497228898
10.4238509498421
-36.6117788120655
-1.40493667258215
11.1420218486355
16.8667405978176
1.2955134745971
-2.23874898577014
17.9669612893213
9.86260572276296
28.5050081096797
8.3474112965423
27.6503277828533
22.9729749023809
-6.08712483123054
35.082066738858
-15.5493094294307
-10.9349180215959
33.9270648983011
-5.11476316591325
29.7529832680402
8.41008418833371
-23.4515467719402
12.8014389815098
25.9171072037016
10.124815767701
19.6971653712599
8.31085508128854
30.7514211842663
0.0802207732731404
14.2976005856644
40.6723568048474
1.88348422770559
-0.256335271666103
-11.7923329768546
-18.9472897027499
45.4667160345834
-1.75991571464328
49.7526393204862
17.9118917318447
24.264252860783
9.27425286787002
37.9226058242912
-1.43427034319848
30.0428992227471
-92.198587237649
67.9576723939563
0.567376694881204
1.38302968521111
57.6586333923633
25.5754223644499
-15.7649643918776
-15.42846775208
5.16146758725608
5.34561979630962
29.440111778471
24.5194422175127
5.26662011919871
49.4424746696523
4.52116879910591
20.0647712209138
-16.2001400601112
57.5845484118627
11.377638256381
27.5596932787366
17.5756857928336
19.8743088265455
-10.2944433037637
23.0079082116163
44.6118303086987
6.46565403470777
28.9066114007328
23.5353992870059
-24.1039470217383
-0.279047637510303
43.0083463531228
-4.58638554018216
6.43717942076182
34.2074630803418
18.1768500859926
8.85632792005708
13.9351060168192
-33.616800932863
-3.39451687186011
38.1015304653665
15.3603779962377
-33.7594310133172
61.0097492134137
29.5751900304676
-0.584597991535702
19.5174854061333
45.3162293336973
12.8445853632275
36.5158166895035
-3.99219308716602
62.3194070429672
-7.56398201489901
21.0262397398456
18.7711022845742


Parameters (Session):
par1 = 1 ; par2 = 1 ; par3 = 0 ; par4 = 1 ;
Parameters (R input):
par1 = FALSE ; par2 = 1 ; par3 = 1 ; par4 = 0 ; par5 = 1 ; par6 = 1 ; par7 = 1 ; par8 = 0 ; par9 = 0 ;
R code (references can be found in the software module):
library(lattice)
if (par1 == 'TRUE') par1 <- TRUE
if (par1 == 'FALSE') par1 <- FALSE
par2 <- as.numeric(par2) #Box-Cox lambda transformation parameter
par3 <- as.numeric(par3) #degree of non-seasonal differencing
par4 <- as.numeric(par4) #degree of seasonal differencing
par5 <- as.numeric(par5) #seasonal period
par6 <- as.numeric(par6) #degree (p) of the non-seasonal AR(p) polynomial
par7 <- as.numeric(par7) #degree (q) of the non-seasonal MA(q) polynomial
par8 <- as.numeric(par8) #degree (P) of the seasonal AR(P) polynomial
par9 <- as.numeric(par9) #degree (Q) of the seasonal MA(Q) polynomial
armaGR <- function(arima.out, names, n){
try1 <- arima.out$coef
try2 <- sqrt(diag(arima.out$var.coef))
try.data.frame <- data.frame(matrix(NA,ncol=4,nrow=length(names)))
dimnames(try.data.frame) <- list(names,c('coef','std','tstat','pv'))
try.data.frame[,1] <- try1
for(i in 1:length(try2)) try.data.frame[which(rownames(try.data.frame)==names(try2)[i]),2] <- try2[i]
try.data.frame[,3] <- try.data.frame[,1] / try.data.frame[,2]
try.data.frame[,4] <- round((1-pt(abs(try.data.frame[,3]),df=n-(length(try2)+1)))*2,5)
vector <- rep(NA,length(names))
vector[is.na(try.data.frame[,4])] <- 0
maxi <- which.max(try.data.frame[,4])
continue <- max(try.data.frame[,4],na.rm=TRUE) > .05
vector[maxi] <- 0
list(summary=try.data.frame,next.vector=vector,continue=continue)
}
arimaSelect <- function(series, order=c(13,0,0), seasonal=list(order=c(2,0,0),period=12), include.mean=F){
nrc <- order[1]+order[3]+seasonal$order[1]+seasonal$order[3]
coeff <- matrix(NA, nrow=nrc*2, ncol=nrc)
pval <- matrix(NA, nrow=nrc*2, ncol=nrc)
mylist <- rep(list(NULL), nrc)
names <- NULL
if(order[1] > 0) names <- paste('ar',1:order[1],sep='')
if(order[3] > 0) names <- c( names , paste('ma',1:order[3],sep='') )
if(seasonal$order[1] > 0) names <- c(names, paste('sar',1:seasonal$order[1],sep=''))
if(seasonal$order[3] > 0) names <- c(names, paste('sma',1:seasonal$order[3],sep=''))
arima.out <- arima(series, order=order, seasonal=seasonal, include.mean=include.mean, method='ML')
mylist[[1]] <- arima.out
last.arma <- armaGR(arima.out, names, length(series))
mystop <- FALSE
i <- 1
coeff[i,] <- last.arma[[1]][,1]
pval [i,] <- last.arma[[1]][,4]
i <- 2
aic <- arima.out$aic
while(!mystop){
mylist[[i]] <- arima.out
arima.out <- arima(series, order=order, seasonal=seasonal, include.mean=include.mean, method='ML', fixed=last.arma$next.vector)
aic <- c(aic, arima.out$aic)
last.arma <- armaGR(arima.out, names, length(series))
mystop <- !last.arma$continue
coeff[i,] <- last.arma[[1]][,1]
pval [i,] <- last.arma[[1]][,4]
i <- i+1
}
list(coeff, pval, mylist, aic=aic)
}
arimaSelectplot <- function(arimaSelect.out,noms,choix){
noms <- names(arimaSelect.out[[3]][[1]]$coef)
coeff <- arimaSelect.out[[1]]
k <- min(which(is.na(coeff[,1])))-1
coeff <- coeff[1:k,]
pval <- arimaSelect.out[[2]][1:k,]
aic <- arimaSelect.out$aic[1:k]
coeff[coeff==0] <- NA
n <- ncol(coeff)
if(missing(choix)) choix <- k
layout(matrix(c(1,1,1,2,
3,3,3,2,
3,3,3,4,
5,6,7,7),nr=4),
widths=c(10,35,45,15),
heights=c(30,30,15,15))
couleurs <- rainbow(75)[1:50]#(50)
ticks <- pretty(coeff)
par(mar=c(1,1,3,1))
plot(aic,k:1-.5,type='o',pch=21,bg='blue',cex=2,axes=F,lty=2,xpd=NA)
points(aic[choix],k-choix+.5,pch=21,cex=4,bg=2,xpd=NA)
title('aic',line=2)
par(mar=c(3,0,0,0))
plot(0,axes=F,xlab='',ylab='',xlim=range(ticks),ylim=c(.1,1))
rect(xleft = min(ticks) + (0:49)/50*(max(ticks)-min(ticks)),
xright = min(ticks) + (1:50)/50*(max(ticks)-min(ticks)),
ytop = rep(1,50),
ybottom= rep(0,50),col=couleurs,border=NA)
axis(1,ticks)
rect(xleft=min(ticks),xright=max(ticks),ytop=1,ybottom=0)
text(mean(coeff,na.rm=T),.5,'coefficients',cex=2,font=2)
par(mar=c(1,1,3,1))
image(1:n,1:k,t(coeff[k:1,]),axes=F,col=couleurs,zlim=range(ticks))
for(i in 1:n) for(j in 1:k) if(!is.na(coeff[j,i])) {
if(pval[j,i]<.01) symb = 'green'
else if( (pval[j,i]<.05) & (pval[j,i]>=.01)) symb = 'orange'
else if( (pval[j,i]<.1) & (pval[j,i]>=.05)) symb = 'red'
else symb = 'black'
polygon(c(i+.5 ,i+.2 ,i+.5 ,i+.5),
c(k-j+0.5,k-j+0.5,k-j+0.8,k-j+0.5),
col=symb)
if(j==choix) {
rect(xleft=i-.5,
xright=i+.5,
ybottom=k-j+1.5,
ytop=k-j+.5,
lwd=4)
text(i,
k-j+1,
round(coeff[j,i],2),
cex=1.2,
font=2)
}
else{
rect(xleft=i-.5,xright=i+.5,ybottom=k-j+1.5,ytop=k-j+.5)
text(i,k-j+1,round(coeff[j,i],2),cex=1.2,font=1)
}
}
axis(3,1:n,noms)
par(mar=c(0.5,0,0,0.5))
plot(0,axes=F,xlab='',ylab='',type='n',xlim=c(0,8),ylim=c(-.2,.8))
cols <- c('green','orange','red','black')
niv <- c('0','0.01','0.05','0.1')
for(i in 0:3){
polygon(c(1+2*i ,1+2*i ,1+2*i-.5 ,1+2*i),
c(.4 ,.7 , .4 , .4),
col=cols[i+1])
text(2*i,0.5,niv[i+1],cex=1.5)
}
text(8,.5,1,cex=1.5)
text(4,0,'p-value',cex=2)
box()
residus <- arimaSelect.out[[3]][[choix]]$res
par(mar=c(1,2,4,1))
acf(residus,main='')
title('acf',line=.5)
par(mar=c(1,2,4,1))
pacf(residus,main='')
title('pacf',line=.5)
par(mar=c(2,2,4,1))
qqnorm(residus,main='')
title('qq-norm',line=.5)
qqline(residus)
residus
}
if (par2 == 0) x <- log(x)
if (par2 != 0) x <- x^par2
(selection <- arimaSelect(x, order=c(par6,par3,par7), seasonal=list(order=c(par8,par4,par9), period=par5)))
bitmap(file='test1.png')
resid <- arimaSelectplot(selection)
dev.off()
resid
bitmap(file='test2.png')
acf(resid,length(resid)/2, main='Residual Autocorrelation Function')
dev.off()
bitmap(file='test3.png')
pacf(resid,length(resid)/2, main='Residual Partial Autocorrelation Function')
dev.off()
bitmap(file='test4.png')
cpgram(resid, main='Residual Cumulative Periodogram')
dev.off()
bitmap(file='test5.png')
hist(resid, main='Residual Histogram', xlab='values of Residuals')
dev.off()
bitmap(file='test6.png')
densityplot(~resid,col='black',main='Residual Density Plot', xlab='values of Residuals')
dev.off()
bitmap(file='test7.png')
qqnorm(resid, main='Residual Normal Q-Q Plot')
qqline(resid)
dev.off()
ncols <- length(selection[[1]][1,])
nrows <- length(selection[[2]][,1])-1
load(file='createtable')
a<-table.start()
a<-table.row.start(a)
a<-table.element(a,'ARIMA Parameter Estimation and Backward Selection', ncols+1,TRUE)
a<-table.row.end(a)
a<-table.row.start(a)
a<-table.element(a,'Iteration', header=TRUE)
for (i in 1:ncols) {
a<-table.element(a,names(selection[[3]][[1]]$coef)[i],header=TRUE)
}
a<-table.row.end(a)
for (j in 1:nrows) {
a<-table.row.start(a)
mydum <- 'Estimates ('
mydum <- paste(mydum,j)
mydum <- paste(mydum,')')
a<-table.element(a,mydum, header=TRUE)
for (i in 1:ncols) {
a<-table.element(a,round(selection[[1]][j,i],4))
}
a<-table.row.end(a)
a<-table.row.start(a)
a<-table.element(a,'(p-val)', header=TRUE)
for (i in 1:ncols) {
mydum <- '('
mydum <- paste(mydum,round(selection[[2]][j,i],4),sep='')
mydum <- paste(mydum,')')
a<-table.element(a,mydum)
}
a<-table.row.end(a)
}
a<-table.end(a)
table.save(a,file='mytable.tab')
a<-table.start()
a<-table.row.start(a)
a<-table.element(a,'Estimated ARIMA Residuals', 1,TRUE)
a<-table.row.end(a)
a<-table.row.start(a)
a<-table.element(a,'Value', 1,TRUE)
a<-table.row.end(a)
for (i in (par4*par5+par3):length(resid)) {
a<-table.row.start(a)
a<-table.element(a,resid[i])
a<-table.row.end(a)
}
a<-table.end(a)
table.save(a,file='mytable1.tab')