Free Statistics

of Irreproducible Research!

Author's title

Author*The author of this computation has been verified*
R Software Modulerwasp_arimabackwardselection.wasp
Title produced by softwareARIMA Backward Selection
Date of computationThu, 15 Dec 2016 09:28:26 +0100
Cite this page as followsStatistical Computations at FreeStatistics.org, Office for Research Development and Education, URL https://freestatistics.org/blog/index.php?v=date/2016/Dec/15/t1481790540gbbjfnb6njfw4nh.htm/, Retrieved Sat, 18 May 2024 07:46:43 +0000
Statistical Computations at FreeStatistics.org, Office for Research Development and Education, URL https://freestatistics.org/blog/index.php?pk=299765, Retrieved Sat, 18 May 2024 07:46:43 +0000
QR Codes:

Original text written by user:
IsPrivate?No (this computation is public)
User-defined keywords
Estimated Impact94
Family? (F = Feedback message, R = changed R code, M = changed R Module, P = changed Parameters, D = changed Data)
-       [ARIMA Backward Selection] [jqslnds,] [2016-12-15 08:28:26] [4c05fa0998bf98e29c2e453b139976f4] [Current]
Feedback Forum

Post a new message
Dataseries X:
3281
3397
3498.5
3538
3449.5
3673
3350.5
3604
3673.5
3747
3616
3580.5
3710
3994.5
4091
3954.5
4004
4287
3831
4046.5
4079.5
4029.5
3880
3855
3841.5
4123.5
4133
3958.5
4003
4151.5
3723
3957
3965.5
3861.5
3917.5
3704
3950
4140.5
4090
4162
4066
4358.5
4022.5
4285.5
4373.5
4284.5
4077.5
4122
4181.5
4535.5
4497
4420.5
4370
4712
4475
4578.5
4751.5
4746
4581.5
4645.5
4751
4952.5
4996.5
4998
4986.5
5348
4933
5263
5330.5
5301
5159
5258.5
5411.5
5536.5
5613
5505.5
5476
5782.5
5283
5451.5
5578
5548.5
5379.5
5117.5
5316.5
5505.5
5620.5
5383.5
5461.5
5658.5
5357.5
5622
5608
5604.5
5399
5185
5221
5379.5
5333
5214
5206.5
5630
5285.5
5512.5
5592.5
5554.5
5284.5
5198.5
5241.5
5455
5548.5
5375
5346
5730.5
5457
5603


Summary of computational transaction
Raw Input view raw input (R code)
Raw Outputview raw output of R engine
Computing time7 seconds
R ServerBig Analytics Cloud Computing Center

\begin{tabular}{lllllllll}
\hline
Summary of computational transaction \tabularnewline
Raw Input view raw input (R code)  \tabularnewline
Raw Outputview raw output of R engine  \tabularnewline
Computing time7 seconds \tabularnewline
R ServerBig Analytics Cloud Computing Center \tabularnewline
\hline
\end{tabular}
%Source: https://freestatistics.org/blog/index.php?pk=299765&T=0

[TABLE]
[ROW]
Summary of computational transaction[/C][/ROW] [ROW]Raw Input[/C] view raw input (R code) [/C][/ROW] [ROW]Raw Output[/C]view raw output of R engine [/C][/ROW] [ROW]Computing time[/C]7 seconds[/C][/ROW] [ROW]R Server[/C]Big Analytics Cloud Computing Center[/C][/ROW] [/TABLE] Source: https://freestatistics.org/blog/index.php?pk=299765&T=0

Globally Unique Identifier (entire table): ba.freestatistics.org/blog/index.php?pk=299765&T=0

As an alternative you can also use a QR Code:  

The GUIDs for individual cells are displayed in the table below:

Summary of computational transaction
Raw Input view raw input (R code)
Raw Outputview raw output of R engine
Computing time7 seconds
R ServerBig Analytics Cloud Computing Center


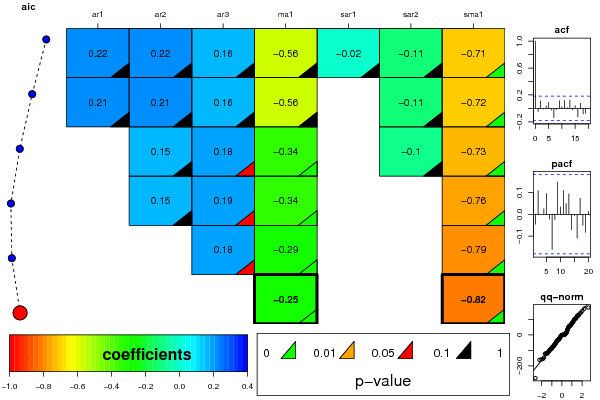
ARIMA Parameter Estimation and Backward Selection
Iterationar1ar2ar3ma1sar1sar2sma1
Estimates ( 1 )0.21810.21540.1647-0.5612-0.0157-0.1145-0.7052
(p-val)(0.6042 )(0.1704 )(0.1427 )(0.1903 )(0.9286 )(0.402 )(4e-04 )
Estimates ( 2 )0.21360.21310.1646-0.55650-0.1079-0.7187
(p-val)(0.6107 )(0.172 )(0.1407 )(0.1924 )(NA )(0.3519 )(0 )
Estimates ( 3 )00.15130.1777-0.34240-0.101-0.7312
(p-val)(NA )(0.1524 )(0.0835 )(0.0015 )(NA )(0.3834 )(0 )
Estimates ( 4 )00.15130.1938-0.336500-0.7648
(p-val)(NA )(0.15 )(0.0545 )(0.0018 )(NA )(NA )(0 )
Estimates ( 5 )000.1845-0.289300-0.7894
(p-val)(NA )(NA )(0.0761 )(0.0018 )(NA )(NA )(0 )
Estimates ( 6 )000-0.251200-0.8179
(p-val)(NA )(NA )(NA )(0.0032 )(NA )(NA )(0 )
Estimates ( 7 )NANANANANANANA
(p-val)(NA )(NA )(NA )(NA )(NA )(NA )(NA )
Estimates ( 8 )NANANANANANANA
(p-val)(NA )(NA )(NA )(NA )(NA )(NA )(NA )
Estimates ( 9 )NANANANANANANA
(p-val)(NA )(NA )(NA )(NA )(NA )(NA )(NA )
Estimates ( 10 )NANANANANANANA
(p-val)(NA )(NA )(NA )(NA )(NA )(NA )(NA )
Estimates ( 11 )NANANANANANANA
(p-val)(NA )(NA )(NA )(NA )(NA )(NA )(NA )
Estimates ( 12 )NANANANANANANA
(p-val)(NA )(NA )(NA )(NA )(NA )(NA )(NA )
Estimates ( 13 )NANANANANANANA
(p-val)(NA )(NA )(NA )(NA )(NA )(NA )(NA )

\begin{tabular}{lllllllll}
\hline
ARIMA Parameter Estimation and Backward Selection \tabularnewline
Iteration & ar1 & ar2 & ar3 & ma1 & sar1 & sar2 & sma1 \tabularnewline
Estimates ( 1 ) & 0.2181 & 0.2154 & 0.1647 & -0.5612 & -0.0157 & -0.1145 & -0.7052 \tabularnewline
(p-val) & (0.6042 ) & (0.1704 ) & (0.1427 ) & (0.1903 ) & (0.9286 ) & (0.402 ) & (4e-04 ) \tabularnewline
Estimates ( 2 ) & 0.2136 & 0.2131 & 0.1646 & -0.5565 & 0 & -0.1079 & -0.7187 \tabularnewline
(p-val) & (0.6107 ) & (0.172 ) & (0.1407 ) & (0.1924 ) & (NA ) & (0.3519 ) & (0 ) \tabularnewline
Estimates ( 3 ) & 0 & 0.1513 & 0.1777 & -0.3424 & 0 & -0.101 & -0.7312 \tabularnewline
(p-val) & (NA ) & (0.1524 ) & (0.0835 ) & (0.0015 ) & (NA ) & (0.3834 ) & (0 ) \tabularnewline
Estimates ( 4 ) & 0 & 0.1513 & 0.1938 & -0.3365 & 0 & 0 & -0.7648 \tabularnewline
(p-val) & (NA ) & (0.15 ) & (0.0545 ) & (0.0018 ) & (NA ) & (NA ) & (0 ) \tabularnewline
Estimates ( 5 ) & 0 & 0 & 0.1845 & -0.2893 & 0 & 0 & -0.7894 \tabularnewline
(p-val) & (NA ) & (NA ) & (0.0761 ) & (0.0018 ) & (NA ) & (NA ) & (0 ) \tabularnewline
Estimates ( 6 ) & 0 & 0 & 0 & -0.2512 & 0 & 0 & -0.8179 \tabularnewline
(p-val) & (NA ) & (NA ) & (NA ) & (0.0032 ) & (NA ) & (NA ) & (0 ) \tabularnewline
Estimates ( 7 ) & NA & NA & NA & NA & NA & NA & NA \tabularnewline
(p-val) & (NA ) & (NA ) & (NA ) & (NA ) & (NA ) & (NA ) & (NA ) \tabularnewline
Estimates ( 8 ) & NA & NA & NA & NA & NA & NA & NA \tabularnewline
(p-val) & (NA ) & (NA ) & (NA ) & (NA ) & (NA ) & (NA ) & (NA ) \tabularnewline
Estimates ( 9 ) & NA & NA & NA & NA & NA & NA & NA \tabularnewline
(p-val) & (NA ) & (NA ) & (NA ) & (NA ) & (NA ) & (NA ) & (NA ) \tabularnewline
Estimates ( 10 ) & NA & NA & NA & NA & NA & NA & NA \tabularnewline
(p-val) & (NA ) & (NA ) & (NA ) & (NA ) & (NA ) & (NA ) & (NA ) \tabularnewline
Estimates ( 11 ) & NA & NA & NA & NA & NA & NA & NA \tabularnewline
(p-val) & (NA ) & (NA ) & (NA ) & (NA ) & (NA ) & (NA ) & (NA ) \tabularnewline
Estimates ( 12 ) & NA & NA & NA & NA & NA & NA & NA \tabularnewline
(p-val) & (NA ) & (NA ) & (NA ) & (NA ) & (NA ) & (NA ) & (NA ) \tabularnewline
Estimates ( 13 ) & NA & NA & NA & NA & NA & NA & NA \tabularnewline
(p-val) & (NA ) & (NA ) & (NA ) & (NA ) & (NA ) & (NA ) & (NA ) \tabularnewline
\hline
\end{tabular}
%Source: https://freestatistics.org/blog/index.php?pk=299765&T=1

[TABLE]
[ROW][C]ARIMA Parameter Estimation and Backward Selection[/C][/ROW]
[ROW][C]Iteration[/C][C]ar1[/C][C]ar2[/C][C]ar3[/C][C]ma1[/C][C]sar1[/C][C]sar2[/C][C]sma1[/C][/ROW]
[ROW][C]Estimates ( 1 )[/C][C]0.2181[/C][C]0.2154[/C][C]0.1647[/C][C]-0.5612[/C][C]-0.0157[/C][C]-0.1145[/C][C]-0.7052[/C][/ROW]
[ROW][C](p-val)[/C][C](0.6042 )[/C][C](0.1704 )[/C][C](0.1427 )[/C][C](0.1903 )[/C][C](0.9286 )[/C][C](0.402 )[/C][C](4e-04 )[/C][/ROW]
[ROW][C]Estimates ( 2 )[/C][C]0.2136[/C][C]0.2131[/C][C]0.1646[/C][C]-0.5565[/C][C]0[/C][C]-0.1079[/C][C]-0.7187[/C][/ROW]
[ROW][C](p-val)[/C][C](0.6107 )[/C][C](0.172 )[/C][C](0.1407 )[/C][C](0.1924 )[/C][C](NA )[/C][C](0.3519 )[/C][C](0 )[/C][/ROW]
[ROW][C]Estimates ( 3 )[/C][C]0[/C][C]0.1513[/C][C]0.1777[/C][C]-0.3424[/C][C]0[/C][C]-0.101[/C][C]-0.7312[/C][/ROW]
[ROW][C](p-val)[/C][C](NA )[/C][C](0.1524 )[/C][C](0.0835 )[/C][C](0.0015 )[/C][C](NA )[/C][C](0.3834 )[/C][C](0 )[/C][/ROW]
[ROW][C]Estimates ( 4 )[/C][C]0[/C][C]0.1513[/C][C]0.1938[/C][C]-0.3365[/C][C]0[/C][C]0[/C][C]-0.7648[/C][/ROW]
[ROW][C](p-val)[/C][C](NA )[/C][C](0.15 )[/C][C](0.0545 )[/C][C](0.0018 )[/C][C](NA )[/C][C](NA )[/C][C](0 )[/C][/ROW]
[ROW][C]Estimates ( 5 )[/C][C]0[/C][C]0[/C][C]0.1845[/C][C]-0.2893[/C][C]0[/C][C]0[/C][C]-0.7894[/C][/ROW]
[ROW][C](p-val)[/C][C](NA )[/C][C](NA )[/C][C](0.0761 )[/C][C](0.0018 )[/C][C](NA )[/C][C](NA )[/C][C](0 )[/C][/ROW]
[ROW][C]Estimates ( 6 )[/C][C]0[/C][C]0[/C][C]0[/C][C]-0.2512[/C][C]0[/C][C]0[/C][C]-0.8179[/C][/ROW]
[ROW][C](p-val)[/C][C](NA )[/C][C](NA )[/C][C](NA )[/C][C](0.0032 )[/C][C](NA )[/C][C](NA )[/C][C](0 )[/C][/ROW]
[ROW][C]Estimates ( 7 )[/C][C]NA[/C][C]NA[/C][C]NA[/C][C]NA[/C][C]NA[/C][C]NA[/C][C]NA[/C][/ROW]
[ROW][C](p-val)[/C][C](NA )[/C][C](NA )[/C][C](NA )[/C][C](NA )[/C][C](NA )[/C][C](NA )[/C][C](NA )[/C][/ROW]
[ROW][C]Estimates ( 8 )[/C][C]NA[/C][C]NA[/C][C]NA[/C][C]NA[/C][C]NA[/C][C]NA[/C][C]NA[/C][/ROW]
[ROW][C](p-val)[/C][C](NA )[/C][C](NA )[/C][C](NA )[/C][C](NA )[/C][C](NA )[/C][C](NA )[/C][C](NA )[/C][/ROW]
[ROW][C]Estimates ( 9 )[/C][C]NA[/C][C]NA[/C][C]NA[/C][C]NA[/C][C]NA[/C][C]NA[/C][C]NA[/C][/ROW]
[ROW][C](p-val)[/C][C](NA )[/C][C](NA )[/C][C](NA )[/C][C](NA )[/C][C](NA )[/C][C](NA )[/C][C](NA )[/C][/ROW]
[ROW][C]Estimates ( 10 )[/C][C]NA[/C][C]NA[/C][C]NA[/C][C]NA[/C][C]NA[/C][C]NA[/C][C]NA[/C][/ROW]
[ROW][C](p-val)[/C][C](NA )[/C][C](NA )[/C][C](NA )[/C][C](NA )[/C][C](NA )[/C][C](NA )[/C][C](NA )[/C][/ROW]
[ROW][C]Estimates ( 11 )[/C][C]NA[/C][C]NA[/C][C]NA[/C][C]NA[/C][C]NA[/C][C]NA[/C][C]NA[/C][/ROW]
[ROW][C](p-val)[/C][C](NA )[/C][C](NA )[/C][C](NA )[/C][C](NA )[/C][C](NA )[/C][C](NA )[/C][C](NA )[/C][/ROW]
[ROW][C]Estimates ( 12 )[/C][C]NA[/C][C]NA[/C][C]NA[/C][C]NA[/C][C]NA[/C][C]NA[/C][C]NA[/C][/ROW]
[ROW][C](p-val)[/C][C](NA )[/C][C](NA )[/C][C](NA )[/C][C](NA )[/C][C](NA )[/C][C](NA )[/C][C](NA )[/C][/ROW]
[ROW][C]Estimates ( 13 )[/C][C]NA[/C][C]NA[/C][C]NA[/C][C]NA[/C][C]NA[/C][C]NA[/C][C]NA[/C][/ROW]
[ROW][C](p-val)[/C][C](NA )[/C][C](NA )[/C][C](NA )[/C][C](NA )[/C][C](NA )[/C][C](NA )[/C][C](NA )[/C][/ROW]
[/TABLE]
Source: https://freestatistics.org/blog/index.php?pk=299765&T=1

Globally Unique Identifier (entire table): ba.freestatistics.org/blog/index.php?pk=299765&T=1

As an alternative you can also use a QR Code:  

The GUIDs for individual cells are displayed in the table below:

ARIMA Parameter Estimation and Backward Selection
Iterationar1ar2ar3ma1sar1sar2sma1
Estimates ( 1 )0.21810.21540.1647-0.5612-0.0157-0.1145-0.7052
(p-val)(0.6042 )(0.1704 )(0.1427 )(0.1903 )(0.9286 )(0.402 )(4e-04 )
Estimates ( 2 )0.21360.21310.1646-0.55650-0.1079-0.7187
(p-val)(0.6107 )(0.172 )(0.1407 )(0.1924 )(NA )(0.3519 )(0 )
Estimates ( 3 )00.15130.1777-0.34240-0.101-0.7312
(p-val)(NA )(0.1524 )(0.0835 )(0.0015 )(NA )(0.3834 )(0 )
Estimates ( 4 )00.15130.1938-0.336500-0.7648
(p-val)(NA )(0.15 )(0.0545 )(0.0018 )(NA )(NA )(0 )
Estimates ( 5 )000.1845-0.289300-0.7894
(p-val)(NA )(NA )(0.0761 )(0.0018 )(NA )(NA )(0 )
Estimates ( 6 )000-0.251200-0.8179
(p-val)(NA )(NA )(NA )(0.0032 )(NA )(NA )(0 )
Estimates ( 7 )NANANANANANANA
(p-val)(NA )(NA )(NA )(NA )(NA )(NA )(NA )
Estimates ( 8 )NANANANANANANA
(p-val)(NA )(NA )(NA )(NA )(NA )(NA )(NA )
Estimates ( 9 )NANANANANANANA
(p-val)(NA )(NA )(NA )(NA )(NA )(NA )(NA )
Estimates ( 10 )NANANANANANANA
(p-val)(NA )(NA )(NA )(NA )(NA )(NA )(NA )
Estimates ( 11 )NANANANANANANA
(p-val)(NA )(NA )(NA )(NA )(NA )(NA )(NA )
Estimates ( 12 )NANANANANANANA
(p-val)(NA )(NA )(NA )(NA )(NA )(NA )(NA )
Estimates ( 13 )NANANANANANANA
(p-val)(NA )(NA )(NA )(NA )(NA )(NA )(NA )


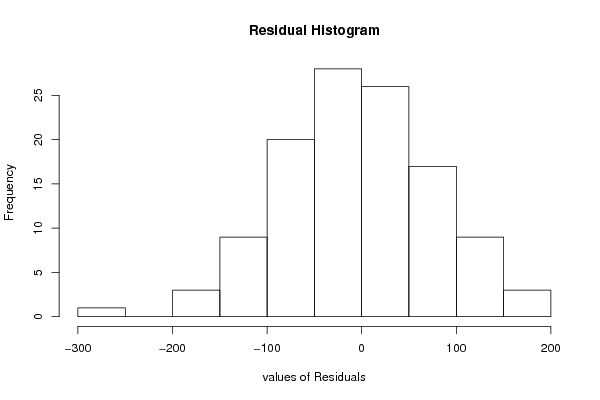
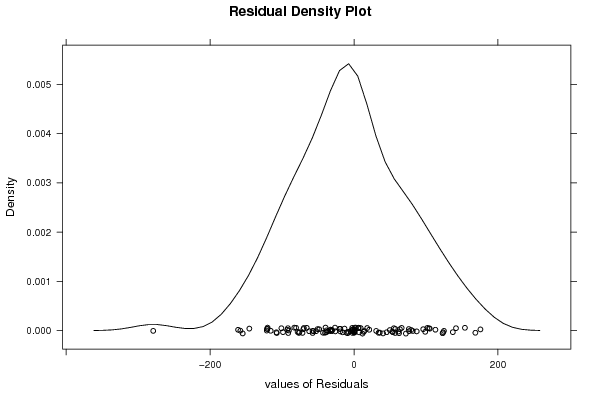
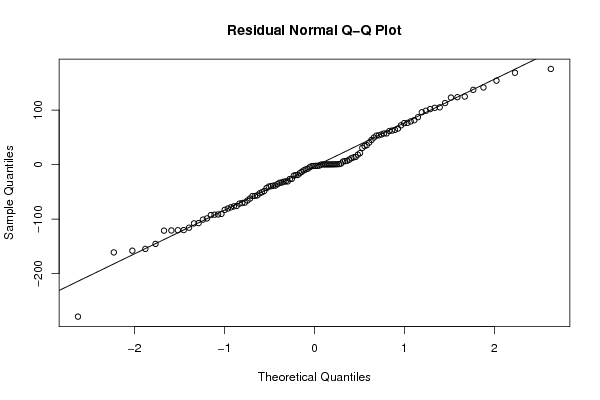
Estimated ARIMA Residuals
Value
-10.6759561381352
124.922603700003
30.7554367725333
-120.864382359703
49.6892300195277
61.7621318745479
-62.3161776391999
-65.7324733699459
-56.3572815176161
-98.7050209925264
-26.0309020449434
5.65904295898135
-120.151827809159
40.3382344405209
-69.6865643808704
-107.891705681528
11.7782844775146
-76.678475650458
-35.9580668412012
-19.1530816152278
-26.4382801449695
-107.402404790671
154.064342229655
-115.807299331388
137.229274841165
-32.9594464024516
-90.4446357313901
105.1850539352
-57.6594654506506
76.1300290571009
57.3020086378029
62.5198768110565
53.8456440783955
-52.6938404732427
-145.49645363338
79.3254326991085
-38.6190994302883
141.651471900289
-50.7223217058593
-30.7685251071571
-57.6082808696995
96.1126728719515
175.609687529083
-78.4237843080784
76.5048735322254
35.7728227509333
-13.2219976080125
87.0829936465776
9.09138411303757
-40.3750488233343
-2.38391851733019
55.3298179387558
45.3358510747719
101.865435072803
-48.4411066832659
104.211583347447
-2.49618080190483
18.2605399130129
-31.4759187981541
113.068470307496
72.0385938070634
-91.8940483338776
6.50115736312916
-71.6266002847896
-2.10480359528969
7.04027528882425
-121.239009283614
-100.970578291926
14.1796211214054
34.0865682132194
-15.7565742478182
-279.07713581803
-4.91923674832444
-20.2311969952575
123.782593675661
-158.006529893768
63.7306894284804
-91.4160022105454
98.862083214583
53.1561260985072
-70.4324550390894
-7.7275712797203
-75.946088148047
-161.150691023676
-154.708352925996
-83.0375650791363
-92.6204362792888
-30.7166189254826
-3.0052461122816
168.583130057834
81.5698344023089
21.126997727951
-8.8945547838812
-19.0447902725831
-120.404409011006
-33.3405681274728
-80.5954912962382
13.2669928183645
66.1280666684864
-39.6266520230791
-38.4173187060889
57.0547505629716
123.054691628181
-43.1626305831317

\begin{tabular}{lllllllll}
\hline
Estimated ARIMA Residuals \tabularnewline
Value \tabularnewline
-10.6759561381352 \tabularnewline
124.922603700003 \tabularnewline
30.7554367725333 \tabularnewline
-120.864382359703 \tabularnewline
49.6892300195277 \tabularnewline
61.7621318745479 \tabularnewline
-62.3161776391999 \tabularnewline
-65.7324733699459 \tabularnewline
-56.3572815176161 \tabularnewline
-98.7050209925264 \tabularnewline
-26.0309020449434 \tabularnewline
5.65904295898135 \tabularnewline
-120.151827809159 \tabularnewline
40.3382344405209 \tabularnewline
-69.6865643808704 \tabularnewline
-107.891705681528 \tabularnewline
11.7782844775146 \tabularnewline
-76.678475650458 \tabularnewline
-35.9580668412012 \tabularnewline
-19.1530816152278 \tabularnewline
-26.4382801449695 \tabularnewline
-107.402404790671 \tabularnewline
154.064342229655 \tabularnewline
-115.807299331388 \tabularnewline
137.229274841165 \tabularnewline
-32.9594464024516 \tabularnewline
-90.4446357313901 \tabularnewline
105.1850539352 \tabularnewline
-57.6594654506506 \tabularnewline
76.1300290571009 \tabularnewline
57.3020086378029 \tabularnewline
62.5198768110565 \tabularnewline
53.8456440783955 \tabularnewline
-52.6938404732427 \tabularnewline
-145.49645363338 \tabularnewline
79.3254326991085 \tabularnewline
-38.6190994302883 \tabularnewline
141.651471900289 \tabularnewline
-50.7223217058593 \tabularnewline
-30.7685251071571 \tabularnewline
-57.6082808696995 \tabularnewline
96.1126728719515 \tabularnewline
175.609687529083 \tabularnewline
-78.4237843080784 \tabularnewline
76.5048735322254 \tabularnewline
35.7728227509333 \tabularnewline
-13.2219976080125 \tabularnewline
87.0829936465776 \tabularnewline
9.09138411303757 \tabularnewline
-40.3750488233343 \tabularnewline
-2.38391851733019 \tabularnewline
55.3298179387558 \tabularnewline
45.3358510747719 \tabularnewline
101.865435072803 \tabularnewline
-48.4411066832659 \tabularnewline
104.211583347447 \tabularnewline
-2.49618080190483 \tabularnewline
18.2605399130129 \tabularnewline
-31.4759187981541 \tabularnewline
113.068470307496 \tabularnewline
72.0385938070634 \tabularnewline
-91.8940483338776 \tabularnewline
6.50115736312916 \tabularnewline
-71.6266002847896 \tabularnewline
-2.10480359528969 \tabularnewline
7.04027528882425 \tabularnewline
-121.239009283614 \tabularnewline
-100.970578291926 \tabularnewline
14.1796211214054 \tabularnewline
34.0865682132194 \tabularnewline
-15.7565742478182 \tabularnewline
-279.07713581803 \tabularnewline
-4.91923674832444 \tabularnewline
-20.2311969952575 \tabularnewline
123.782593675661 \tabularnewline
-158.006529893768 \tabularnewline
63.7306894284804 \tabularnewline
-91.4160022105454 \tabularnewline
98.862083214583 \tabularnewline
53.1561260985072 \tabularnewline
-70.4324550390894 \tabularnewline
-7.7275712797203 \tabularnewline
-75.946088148047 \tabularnewline
-161.150691023676 \tabularnewline
-154.708352925996 \tabularnewline
-83.0375650791363 \tabularnewline
-92.6204362792888 \tabularnewline
-30.7166189254826 \tabularnewline
-3.0052461122816 \tabularnewline
168.583130057834 \tabularnewline
81.5698344023089 \tabularnewline
21.126997727951 \tabularnewline
-8.8945547838812 \tabularnewline
-19.0447902725831 \tabularnewline
-120.404409011006 \tabularnewline
-33.3405681274728 \tabularnewline
-80.5954912962382 \tabularnewline
13.2669928183645 \tabularnewline
66.1280666684864 \tabularnewline
-39.6266520230791 \tabularnewline
-38.4173187060889 \tabularnewline
57.0547505629716 \tabularnewline
123.054691628181 \tabularnewline
-43.1626305831317 \tabularnewline
\hline
\end{tabular}
%Source: https://freestatistics.org/blog/index.php?pk=299765&T=2

[TABLE]
[ROW][C]Estimated ARIMA Residuals[/C][/ROW]
[ROW][C]Value[/C][/ROW]
[ROW][C]-10.6759561381352[/C][/ROW]
[ROW][C]124.922603700003[/C][/ROW]
[ROW][C]30.7554367725333[/C][/ROW]
[ROW][C]-120.864382359703[/C][/ROW]
[ROW][C]49.6892300195277[/C][/ROW]
[ROW][C]61.7621318745479[/C][/ROW]
[ROW][C]-62.3161776391999[/C][/ROW]
[ROW][C]-65.7324733699459[/C][/ROW]
[ROW][C]-56.3572815176161[/C][/ROW]
[ROW][C]-98.7050209925264[/C][/ROW]
[ROW][C]-26.0309020449434[/C][/ROW]
[ROW][C]5.65904295898135[/C][/ROW]
[ROW][C]-120.151827809159[/C][/ROW]
[ROW][C]40.3382344405209[/C][/ROW]
[ROW][C]-69.6865643808704[/C][/ROW]
[ROW][C]-107.891705681528[/C][/ROW]
[ROW][C]11.7782844775146[/C][/ROW]
[ROW][C]-76.678475650458[/C][/ROW]
[ROW][C]-35.9580668412012[/C][/ROW]
[ROW][C]-19.1530816152278[/C][/ROW]
[ROW][C]-26.4382801449695[/C][/ROW]
[ROW][C]-107.402404790671[/C][/ROW]
[ROW][C]154.064342229655[/C][/ROW]
[ROW][C]-115.807299331388[/C][/ROW]
[ROW][C]137.229274841165[/C][/ROW]
[ROW][C]-32.9594464024516[/C][/ROW]
[ROW][C]-90.4446357313901[/C][/ROW]
[ROW][C]105.1850539352[/C][/ROW]
[ROW][C]-57.6594654506506[/C][/ROW]
[ROW][C]76.1300290571009[/C][/ROW]
[ROW][C]57.3020086378029[/C][/ROW]
[ROW][C]62.5198768110565[/C][/ROW]
[ROW][C]53.8456440783955[/C][/ROW]
[ROW][C]-52.6938404732427[/C][/ROW]
[ROW][C]-145.49645363338[/C][/ROW]
[ROW][C]79.3254326991085[/C][/ROW]
[ROW][C]-38.6190994302883[/C][/ROW]
[ROW][C]141.651471900289[/C][/ROW]
[ROW][C]-50.7223217058593[/C][/ROW]
[ROW][C]-30.7685251071571[/C][/ROW]
[ROW][C]-57.6082808696995[/C][/ROW]
[ROW][C]96.1126728719515[/C][/ROW]
[ROW][C]175.609687529083[/C][/ROW]
[ROW][C]-78.4237843080784[/C][/ROW]
[ROW][C]76.5048735322254[/C][/ROW]
[ROW][C]35.7728227509333[/C][/ROW]
[ROW][C]-13.2219976080125[/C][/ROW]
[ROW][C]87.0829936465776[/C][/ROW]
[ROW][C]9.09138411303757[/C][/ROW]
[ROW][C]-40.3750488233343[/C][/ROW]
[ROW][C]-2.38391851733019[/C][/ROW]
[ROW][C]55.3298179387558[/C][/ROW]
[ROW][C]45.3358510747719[/C][/ROW]
[ROW][C]101.865435072803[/C][/ROW]
[ROW][C]-48.4411066832659[/C][/ROW]
[ROW][C]104.211583347447[/C][/ROW]
[ROW][C]-2.49618080190483[/C][/ROW]
[ROW][C]18.2605399130129[/C][/ROW]
[ROW][C]-31.4759187981541[/C][/ROW]
[ROW][C]113.068470307496[/C][/ROW]
[ROW][C]72.0385938070634[/C][/ROW]
[ROW][C]-91.8940483338776[/C][/ROW]
[ROW][C]6.50115736312916[/C][/ROW]
[ROW][C]-71.6266002847896[/C][/ROW]
[ROW][C]-2.10480359528969[/C][/ROW]
[ROW][C]7.04027528882425[/C][/ROW]
[ROW][C]-121.239009283614[/C][/ROW]
[ROW][C]-100.970578291926[/C][/ROW]
[ROW][C]14.1796211214054[/C][/ROW]
[ROW][C]34.0865682132194[/C][/ROW]
[ROW][C]-15.7565742478182[/C][/ROW]
[ROW][C]-279.07713581803[/C][/ROW]
[ROW][C]-4.91923674832444[/C][/ROW]
[ROW][C]-20.2311969952575[/C][/ROW]
[ROW][C]123.782593675661[/C][/ROW]
[ROW][C]-158.006529893768[/C][/ROW]
[ROW][C]63.7306894284804[/C][/ROW]
[ROW][C]-91.4160022105454[/C][/ROW]
[ROW][C]98.862083214583[/C][/ROW]
[ROW][C]53.1561260985072[/C][/ROW]
[ROW][C]-70.4324550390894[/C][/ROW]
[ROW][C]-7.7275712797203[/C][/ROW]
[ROW][C]-75.946088148047[/C][/ROW]
[ROW][C]-161.150691023676[/C][/ROW]
[ROW][C]-154.708352925996[/C][/ROW]
[ROW][C]-83.0375650791363[/C][/ROW]
[ROW][C]-92.6204362792888[/C][/ROW]
[ROW][C]-30.7166189254826[/C][/ROW]
[ROW][C]-3.0052461122816[/C][/ROW]
[ROW][C]168.583130057834[/C][/ROW]
[ROW][C]81.5698344023089[/C][/ROW]
[ROW][C]21.126997727951[/C][/ROW]
[ROW][C]-8.8945547838812[/C][/ROW]
[ROW][C]-19.0447902725831[/C][/ROW]
[ROW][C]-120.404409011006[/C][/ROW]
[ROW][C]-33.3405681274728[/C][/ROW]
[ROW][C]-80.5954912962382[/C][/ROW]
[ROW][C]13.2669928183645[/C][/ROW]
[ROW][C]66.1280666684864[/C][/ROW]
[ROW][C]-39.6266520230791[/C][/ROW]
[ROW][C]-38.4173187060889[/C][/ROW]
[ROW][C]57.0547505629716[/C][/ROW]
[ROW][C]123.054691628181[/C][/ROW]
[ROW][C]-43.1626305831317[/C][/ROW]
[/TABLE]
Source: https://freestatistics.org/blog/index.php?pk=299765&T=2

Globally Unique Identifier (entire table): ba.freestatistics.org/blog/index.php?pk=299765&T=2

As an alternative you can also use a QR Code:  

The GUIDs for individual cells are displayed in the table below:

Estimated ARIMA Residuals
Value
-10.6759561381352
124.922603700003
30.7554367725333
-120.864382359703
49.6892300195277
61.7621318745479
-62.3161776391999
-65.7324733699459
-56.3572815176161
-98.7050209925264
-26.0309020449434
5.65904295898135
-120.151827809159
40.3382344405209
-69.6865643808704
-107.891705681528
11.7782844775146
-76.678475650458
-35.9580668412012
-19.1530816152278
-26.4382801449695
-107.402404790671
154.064342229655
-115.807299331388
137.229274841165
-32.9594464024516
-90.4446357313901
105.1850539352
-57.6594654506506
76.1300290571009
57.3020086378029
62.5198768110565
53.8456440783955
-52.6938404732427
-145.49645363338
79.3254326991085
-38.6190994302883
141.651471900289
-50.7223217058593
-30.7685251071571
-57.6082808696995
96.1126728719515
175.609687529083
-78.4237843080784
76.5048735322254
35.7728227509333
-13.2219976080125
87.0829936465776
9.09138411303757
-40.3750488233343
-2.38391851733019
55.3298179387558
45.3358510747719
101.865435072803
-48.4411066832659
104.211583347447
-2.49618080190483
18.2605399130129
-31.4759187981541
113.068470307496
72.0385938070634
-91.8940483338776
6.50115736312916
-71.6266002847896
-2.10480359528969
7.04027528882425
-121.239009283614
-100.970578291926
14.1796211214054
34.0865682132194
-15.7565742478182
-279.07713581803
-4.91923674832444
-20.2311969952575
123.782593675661
-158.006529893768
63.7306894284804
-91.4160022105454
98.862083214583
53.1561260985072
-70.4324550390894
-7.7275712797203
-75.946088148047
-161.150691023676
-154.708352925996
-83.0375650791363
-92.6204362792888
-30.7166189254826
-3.0052461122816
168.583130057834
81.5698344023089
21.126997727951
-8.8945547838812
-19.0447902725831
-120.404409011006
-33.3405681274728
-80.5954912962382
13.2669928183645
66.1280666684864
-39.6266520230791
-38.4173187060889
57.0547505629716
123.054691628181
-43.1626305831317


Parameters (Session):
par1 = FALSE ; par2 = 1 ; par3 = 1 ; par4 = 1 ; par5 = 12 ; par6 = 3 ; par7 = 1 ; par8 = 2 ; par9 = 1 ;
Parameters (R input):
par1 = FALSE ; par2 = 1 ; par3 = 1 ; par4 = 1 ; par5 = 12 ; par6 = 3 ; par7 = 1 ; par8 = 2 ; par9 = 1 ;
R code (references can be found in the software module):
par9 <- '1'
par8 <- '0'
par7 <- '1'
par6 <- '0'
par5 <- '12'
par4 <- '1'
par3 <- '1'
par2 <- '1'
par1 <- 'FALSE'
library(lattice)
if (par1 == 'TRUE') par1 <- TRUE
if (par1 == 'FALSE') par1 <- FALSE
par2 <- as.numeric(par2) #Box-Cox lambda transformation parameter
par3 <- as.numeric(par3) #degree of non-seasonal differencing
par4 <- as.numeric(par4) #degree of seasonal differencing
par5 <- as.numeric(par5) #seasonal period
par6 <- as.numeric(par6) #degree (p) of the non-seasonal AR(p) polynomial
par7 <- as.numeric(par7) #degree (q) of the non-seasonal MA(q) polynomial
par8 <- as.numeric(par8) #degree (P) of the seasonal AR(P) polynomial
par9 <- as.numeric(par9) #degree (Q) of the seasonal MA(Q) polynomial
armaGR <- function(arima.out, names, n){
try1 <- arima.out$coef
try2 <- sqrt(diag(arima.out$var.coef))
try.data.frame <- data.frame(matrix(NA,ncol=4,nrow=length(names)))
dimnames(try.data.frame) <- list(names,c('coef','std','tstat','pv'))
try.data.frame[,1] <- try1
for(i in 1:length(try2)) try.data.frame[which(rownames(try.data.frame)==names(try2)[i]),2] <- try2[i]
try.data.frame[,3] <- try.data.frame[,1] / try.data.frame[,2]
try.data.frame[,4] <- round((1-pt(abs(try.data.frame[,3]),df=n-(length(try2)+1)))*2,5)
vector <- rep(NA,length(names))
vector[is.na(try.data.frame[,4])] <- 0
maxi <- which.max(try.data.frame[,4])
continue <- max(try.data.frame[,4],na.rm=TRUE) > .05
vector[maxi] <- 0
list(summary=try.data.frame,next.vector=vector,continue=continue)
}
arimaSelect <- function(series, order=c(13,0,0), seasonal=list(order=c(2,0,0),period=12), include.mean=F){
nrc <- order[1]+order[3]+seasonal$order[1]+seasonal$order[3]
coeff <- matrix(NA, nrow=nrc*2, ncol=nrc)
pval <- matrix(NA, nrow=nrc*2, ncol=nrc)
mylist <- rep(list(NULL), nrc)
names <- NULL
if(order[1] > 0) names <- paste('ar',1:order[1],sep='')
if(order[3] > 0) names <- c( names , paste('ma',1:order[3],sep='') )
if(seasonal$order[1] > 0) names <- c(names, paste('sar',1:seasonal$order[1],sep=''))
if(seasonal$order[3] > 0) names <- c(names, paste('sma',1:seasonal$order[3],sep=''))
arima.out <- arima(series, order=order, seasonal=seasonal, include.mean=include.mean, method='ML')
mylist[[1]] <- arima.out
last.arma <- armaGR(arima.out, names, length(series))
mystop <- FALSE
i <- 1
coeff[i,] <- last.arma[[1]][,1]
pval [i,] <- last.arma[[1]][,4]
i <- 2
aic <- arima.out$aic
while(!mystop){
mylist[[i]] <- arima.out
arima.out <- arima(series, order=order, seasonal=seasonal, include.mean=include.mean, method='ML', fixed=last.arma$next.vector)
aic <- c(aic, arima.out$aic)
last.arma <- armaGR(arima.out, names, length(series))
mystop <- !last.arma$continue
coeff[i,] <- last.arma[[1]][,1]
pval [i,] <- last.arma[[1]][,4]
i <- i+1
}
list(coeff, pval, mylist, aic=aic)
}
arimaSelectplot <- function(arimaSelect.out,noms,choix){
noms <- names(arimaSelect.out[[3]][[1]]$coef)
coeff <- arimaSelect.out[[1]]
k <- min(which(is.na(coeff[,1])))-1
coeff <- coeff[1:k,]
pval <- arimaSelect.out[[2]][1:k,]
aic <- arimaSelect.out$aic[1:k]
coeff[coeff==0] <- NA
n <- ncol(coeff)
if(missing(choix)) choix <- k
layout(matrix(c(1,1,1,2,
3,3,3,2,
3,3,3,4,
5,6,7,7),nr=4),
widths=c(10,35,45,15),
heights=c(30,30,15,15))
couleurs <- rainbow(75)[1:50]#(50)
ticks <- pretty(coeff)
par(mar=c(1,1,3,1))
plot(aic,k:1-.5,type='o',pch=21,bg='blue',cex=2,axes=F,lty=2,xpd=NA)
points(aic[choix],k-choix+.5,pch=21,cex=4,bg=2,xpd=NA)
title('aic',line=2)
par(mar=c(3,0,0,0))
plot(0,axes=F,xlab='',ylab='',xlim=range(ticks),ylim=c(.1,1))
rect(xleft = min(ticks) + (0:49)/50*(max(ticks)-min(ticks)),
xright = min(ticks) + (1:50)/50*(max(ticks)-min(ticks)),
ytop = rep(1,50),
ybottom= rep(0,50),col=couleurs,border=NA)
axis(1,ticks)
rect(xleft=min(ticks),xright=max(ticks),ytop=1,ybottom=0)
text(mean(coeff,na.rm=T),.5,'coefficients',cex=2,font=2)
par(mar=c(1,1,3,1))
image(1:n,1:k,t(coeff[k:1,]),axes=F,col=couleurs,zlim=range(ticks))
for(i in 1:n) for(j in 1:k) if(!is.na(coeff[j,i])) {
if(pval[j,i]<.01) symb = 'green'
else if( (pval[j,i]<.05) & (pval[j,i]>=.01)) symb = 'orange'
else if( (pval[j,i]<.1) & (pval[j,i]>=.05)) symb = 'red'
else symb = 'black'
polygon(c(i+.5 ,i+.2 ,i+.5 ,i+.5),
c(k-j+0.5,k-j+0.5,k-j+0.8,k-j+0.5),
col=symb)
if(j==choix) {
rect(xleft=i-.5,
xright=i+.5,
ybottom=k-j+1.5,
ytop=k-j+.5,
lwd=4)
text(i,
k-j+1,
round(coeff[j,i],2),
cex=1.2,
font=2)
}
else{
rect(xleft=i-.5,xright=i+.5,ybottom=k-j+1.5,ytop=k-j+.5)
text(i,k-j+1,round(coeff[j,i],2),cex=1.2,font=1)
}
}
axis(3,1:n,noms)
par(mar=c(0.5,0,0,0.5))
plot(0,axes=F,xlab='',ylab='',type='n',xlim=c(0,8),ylim=c(-.2,.8))
cols <- c('green','orange','red','black')
niv <- c('0','0.01','0.05','0.1')
for(i in 0:3){
polygon(c(1+2*i ,1+2*i ,1+2*i-.5 ,1+2*i),
c(.4 ,.7 , .4 , .4),
col=cols[i+1])
text(2*i,0.5,niv[i+1],cex=1.5)
}
text(8,.5,1,cex=1.5)
text(4,0,'p-value',cex=2)
box()
residus <- arimaSelect.out[[3]][[choix]]$res
par(mar=c(1,2,4,1))
acf(residus,main='')
title('acf',line=.5)
par(mar=c(1,2,4,1))
pacf(residus,main='')
title('pacf',line=.5)
par(mar=c(2,2,4,1))
qqnorm(residus,main='')
title('qq-norm',line=.5)
qqline(residus)
residus
}
if (par2 == 0) x <- log(x)
if (par2 != 0) x <- x^par2
(selection <- arimaSelect(x, order=c(par6,par3,par7), seasonal=list(order=c(par8,par4,par9), period=par5)))
bitmap(file='test1.png')
resid <- arimaSelectplot(selection)
dev.off()
resid
bitmap(file='test2.png')
acf(resid,length(resid)/2, main='Residual Autocorrelation Function')
dev.off()
bitmap(file='test3.png')
pacf(resid,length(resid)/2, main='Residual Partial Autocorrelation Function')
dev.off()
bitmap(file='test4.png')
cpgram(resid, main='Residual Cumulative Periodogram')
dev.off()
bitmap(file='test5.png')
hist(resid, main='Residual Histogram', xlab='values of Residuals')
dev.off()
bitmap(file='test6.png')
densityplot(~resid,col='black',main='Residual Density Plot', xlab='values of Residuals')
dev.off()
bitmap(file='test7.png')
qqnorm(resid, main='Residual Normal Q-Q Plot')
qqline(resid)
dev.off()
ncols <- length(selection[[1]][1,])
nrows <- length(selection[[2]][,1])-1
load(file='createtable')
a<-table.start()
a<-table.row.start(a)
a<-table.element(a,'ARIMA Parameter Estimation and Backward Selection', ncols+1,TRUE)
a<-table.row.end(a)
a<-table.row.start(a)
a<-table.element(a,'Iteration', header=TRUE)
for (i in 1:ncols) {
a<-table.element(a,names(selection[[3]][[1]]$coef)[i],header=TRUE)
}
a<-table.row.end(a)
for (j in 1:nrows) {
a<-table.row.start(a)
mydum <- 'Estimates ('
mydum <- paste(mydum,j)
mydum <- paste(mydum,')')
a<-table.element(a,mydum, header=TRUE)
for (i in 1:ncols) {
a<-table.element(a,round(selection[[1]][j,i],4))
}
a<-table.row.end(a)
a<-table.row.start(a)
a<-table.element(a,'(p-val)', header=TRUE)
for (i in 1:ncols) {
mydum <- '('
mydum <- paste(mydum,round(selection[[2]][j,i],4),sep='')
mydum <- paste(mydum,')')
a<-table.element(a,mydum)
}
a<-table.row.end(a)
}
a<-table.end(a)
table.save(a,file='mytable.tab')
a<-table.start()
a<-table.row.start(a)
a<-table.element(a,'Estimated ARIMA Residuals', 1,TRUE)
a<-table.row.end(a)
a<-table.row.start(a)
a<-table.element(a,'Value', 1,TRUE)
a<-table.row.end(a)
for (i in (par4*par5+par3):length(resid)) {
a<-table.row.start(a)
a<-table.element(a,resid[i])
a<-table.row.end(a)
}
a<-table.end(a)
table.save(a,file='mytable1.tab')