Free Statistics

of Irreproducible Research!

Author's title

Author*The author of this computation has been verified*
R Software Modulerwasp_structuraltimeseries.wasp
Title produced by softwareStructural Time Series Models
Date of computationWed, 14 Dec 2016 18:06:00 +0100
Cite this page as followsStatistical Computations at FreeStatistics.org, Office for Research Development and Education, URL https://freestatistics.org/blog/index.php?v=date/2016/Dec/14/t1481735197ic9lcm56p4nwvv6.htm/, Retrieved Sat, 18 May 2024 02:37:25 +0000
Statistical Computations at FreeStatistics.org, Office for Research Development and Education, URL https://freestatistics.org/blog/index.php?pk=299635, Retrieved Sat, 18 May 2024 02:37:25 +0000
QR Codes:

Original text written by user:
IsPrivate?No (this computation is public)
User-defined keywords
Estimated Impact60
Family? (F = Feedback message, R = changed R code, M = changed R Module, P = changed Parameters, D = changed Data)
-       [Structural Time Series Models] [] [2016-12-14 17:06:00] [130d73899007e5ff8a4f636b9bcfb397] [Current]
Feedback Forum

Post a new message
Dataseries X:
4360
3120
4120
4000
5360
5240
4240
5460
4660
5160
5500
3820
5380
4920
4420
5700
6000
7160
6700
4520
5980
6240
4780
4800
5900
4200
5100
5440
5820
6160
7060
6760
5980
7020
6420
6620
7500
6180
8060
6500
6360
7760
7080
7940
7340
7860
6720
7680
8920
7200
7800


Summary of computational transaction
Raw Input view raw input (R code)
Raw Outputview raw output of R engine
Computing time4 seconds
R ServerBig Analytics Cloud Computing Center

\begin{tabular}{lllllllll}
\hline
Summary of computational transaction \tabularnewline
Raw Input view raw input (R code)  \tabularnewline
Raw Outputview raw output of R engine  \tabularnewline
Computing time4 seconds \tabularnewline
R ServerBig Analytics Cloud Computing Center \tabularnewline
\hline
\end{tabular}
%Source: https://freestatistics.org/blog/index.php?pk=299635&T=0

[TABLE]
[ROW]
Summary of computational transaction[/C][/ROW] [ROW]Raw Input[/C] view raw input (R code) [/C][/ROW] [ROW]Raw Output[/C]view raw output of R engine [/C][/ROW] [ROW]Computing time[/C]4 seconds[/C][/ROW] [ROW]R Server[/C]Big Analytics Cloud Computing Center[/C][/ROW] [/TABLE] Source: https://freestatistics.org/blog/index.php?pk=299635&T=0

Globally Unique Identifier (entire table): ba.freestatistics.org/blog/index.php?pk=299635&T=0

As an alternative you can also use a QR Code:  

The GUIDs for individual cells are displayed in the table below:

Summary of computational transaction
Raw Input view raw input (R code)
Raw Outputview raw output of R engine
Computing time4 seconds
R ServerBig Analytics Cloud Computing Center


Structural Time Series Model -- Interpolation
tObservedLevelSlopeSeasonalStand. Residuals
143604360000
231204227.94367924215-44.0831271677097-140.033908509624-1.59891253343431
341204170.21949447161-47.50295258865466.6373020279464-0.0994219615656393
440004107.53790893136-50.5537446022629-54.2817905794369-0.0946382300406442
553604331.17945871802-4.48974399922808126.4916128886061.61083433639199
652404526.8258030632624.448561499679158.68298150919941.16641950752565
742404492.1899734199316.9313479123551-53.8883188196406-0.351640565021655
854604689.7435391262237.5102989568891137.3633862032231.11504131063272
946604715.4825548112336.2916159947441-12.0656816674313-0.0759690355957462
1051604818.9604272964342.69241132185579.39691703744570.454754644600958
1155004968.4165490053452.157303685768192.59970853691020.758224632102794
1238204817.0769468784835.1991099191047-115.189514455774-1.51454528760777
1353804901.7719036798340.416198354986-127.189437896350.986572293400801
1449204967.1360548587542.3136456713157-153.0461328780350.187588543220439
1544204901.4320698956134.586183820746-40.7171637676779-0.789073627083856
1657005053.8026307911642.7218411569492136.7692548885570.907707056682416
1760005220.7829304101851.0926455230893208.4256178915821.01145377140758
1871605535.5753607851268.5423381911454347.7861154998972.25167193550314
1967005782.278660026980.19254845433515.68541708969011.58483484861771
2045205677.6942150899668.191317314797-186.019367659921-1.70176429604665
2159805763.8048331293269.3522008184403118.9199248593350.16991978438124
2262405877.1918004147772.2073496890411117.3737455634980.427802967707991
2347805788.8246836014161.7543836363915-93.9507814322087-1.59176583892416
2448005728.1791516608453.6582162803147-213.870683504487-1.23978215079018
2559005812.6604033250956.1344838430572-115.0275863009880.355619918721608
2642005689.579824624644.0024998947437-455.775168278279-1.83442451135557
2751005652.8166692013838.73602995696-95.1994034548125-0.81455368869816
2854405646.0260020209435.766892826993354.0444476226444-0.462805085831564
2958205686.5945818118436.0826087173784105.7033876274570.0492605298318425
3061605744.3973635337337.5242187035241289.3423043755260.224377201526497
3170605918.9384651740246.7011814326362340.5609694645091.42190973318667
3267606094.0131050353655.3708952727399-86.17124381926761.33562598415619
3359806131.621491840354.1624093999497-47.4299076536761-0.184981415622763
3470206255.7248358618858.9522748631451354.112832214440.728138594658954
3564206335.6955534495360.4016239567554-38.74741157400520.218449775394477
3666206449.5670336276764.1427006398229-140.5402426589090.552431892819773
3775006626.3998622615872.5041396364409239.0003095161041.14906899033141
3861806695.3639154615172.2546019238241-495.052774293609-0.0365682284103526
3980606923.3803816748983.0471476492861239.5322327532851.6145008508647
4065006959.4452724198779.7982650195589-188.76519545047-0.487164023940789
4163606951.0628361443973.6890587543732-83.5953361831154-0.913380967574923
4277607081.0508916194777.5987957593209355.5476250945270.582131451740783
4370807126.7711562445475.3803514770751135.96031913707-0.328954842121331
4479407294.029836989781.7846317170833120.486737922020.946086222924853
4573407393.0977251126282.990808549843-151.7248268722550.177590469015313
4678607485.5034401121783.6484882388526320.8984399913450.0965232585016132
4767207483.4155323879977.6529067466716-277.028499134984-0.876138993539109
4876807592.998319969579.8909357025411-92.53131207888680.323817713759634
4989207794.8948764763388.488789315811454.2860769483631.22375482625798
5072007886.4344736365588.7023716889521-703.5497376225210.0310760922175373
5178007923.7616977027685.1150748799309166.018355966491-0.525769444453621

\begin{tabular}{lllllllll}
\hline
Structural Time Series Model -- Interpolation \tabularnewline
t & Observed & Level & Slope & Seasonal & Stand. Residuals \tabularnewline
1 & 4360 & 4360 & 0 & 0 & 0 \tabularnewline
2 & 3120 & 4227.94367924215 & -44.0831271677097 & -140.033908509624 & -1.59891253343431 \tabularnewline
3 & 4120 & 4170.21949447161 & -47.5029525886546 & 6.6373020279464 & -0.0994219615656393 \tabularnewline
4 & 4000 & 4107.53790893136 & -50.5537446022629 & -54.2817905794369 & -0.0946382300406442 \tabularnewline
5 & 5360 & 4331.17945871802 & -4.48974399922808 & 126.491612888606 & 1.61083433639199 \tabularnewline
6 & 5240 & 4526.82580306326 & 24.4485614996791 & 58.6829815091994 & 1.16641950752565 \tabularnewline
7 & 4240 & 4492.18997341993 & 16.9313479123551 & -53.8883188196406 & -0.351640565021655 \tabularnewline
8 & 5460 & 4689.74353912622 & 37.5102989568891 & 137.363386203223 & 1.11504131063272 \tabularnewline
9 & 4660 & 4715.48255481123 & 36.2916159947441 & -12.0656816674313 & -0.0759690355957462 \tabularnewline
10 & 5160 & 4818.96042729643 & 42.692411321855 & 79.3969170374457 & 0.454754644600958 \tabularnewline
11 & 5500 & 4968.41654900534 & 52.1573036857681 & 92.5997085369102 & 0.758224632102794 \tabularnewline
12 & 3820 & 4817.07694687848 & 35.1991099191047 & -115.189514455774 & -1.51454528760777 \tabularnewline
13 & 5380 & 4901.77190367983 & 40.416198354986 & -127.18943789635 & 0.986572293400801 \tabularnewline
14 & 4920 & 4967.13605485875 & 42.3136456713157 & -153.046132878035 & 0.187588543220439 \tabularnewline
15 & 4420 & 4901.43206989561 & 34.586183820746 & -40.7171637676779 & -0.789073627083856 \tabularnewline
16 & 5700 & 5053.80263079116 & 42.7218411569492 & 136.769254888557 & 0.907707056682416 \tabularnewline
17 & 6000 & 5220.78293041018 & 51.0926455230893 & 208.425617891582 & 1.01145377140758 \tabularnewline
18 & 7160 & 5535.57536078512 & 68.5423381911454 & 347.786115499897 & 2.25167193550314 \tabularnewline
19 & 6700 & 5782.2786600269 & 80.192548454335 & 15.6854170896901 & 1.58483484861771 \tabularnewline
20 & 4520 & 5677.69421508996 & 68.191317314797 & -186.019367659921 & -1.70176429604665 \tabularnewline
21 & 5980 & 5763.80483312932 & 69.3522008184403 & 118.919924859335 & 0.16991978438124 \tabularnewline
22 & 6240 & 5877.19180041477 & 72.2073496890411 & 117.373745563498 & 0.427802967707991 \tabularnewline
23 & 4780 & 5788.82468360141 & 61.7543836363915 & -93.9507814322087 & -1.59176583892416 \tabularnewline
24 & 4800 & 5728.17915166084 & 53.6582162803147 & -213.870683504487 & -1.23978215079018 \tabularnewline
25 & 5900 & 5812.66040332509 & 56.1344838430572 & -115.027586300988 & 0.355619918721608 \tabularnewline
26 & 4200 & 5689.5798246246 & 44.0024998947437 & -455.775168278279 & -1.83442451135557 \tabularnewline
27 & 5100 & 5652.81666920138 & 38.73602995696 & -95.1994034548125 & -0.81455368869816 \tabularnewline
28 & 5440 & 5646.02600202094 & 35.7668928269933 & 54.0444476226444 & -0.462805085831564 \tabularnewline
29 & 5820 & 5686.59458181184 & 36.0826087173784 & 105.703387627457 & 0.0492605298318425 \tabularnewline
30 & 6160 & 5744.39736353373 & 37.5242187035241 & 289.342304375526 & 0.224377201526497 \tabularnewline
31 & 7060 & 5918.93846517402 & 46.7011814326362 & 340.560969464509 & 1.42190973318667 \tabularnewline
32 & 6760 & 6094.01310503536 & 55.3708952727399 & -86.1712438192676 & 1.33562598415619 \tabularnewline
33 & 5980 & 6131.6214918403 & 54.1624093999497 & -47.4299076536761 & -0.184981415622763 \tabularnewline
34 & 7020 & 6255.72483586188 & 58.9522748631451 & 354.11283221444 & 0.728138594658954 \tabularnewline
35 & 6420 & 6335.69555344953 & 60.4016239567554 & -38.7474115740052 & 0.218449775394477 \tabularnewline
36 & 6620 & 6449.56703362767 & 64.1427006398229 & -140.540242658909 & 0.552431892819773 \tabularnewline
37 & 7500 & 6626.39986226158 & 72.5041396364409 & 239.000309516104 & 1.14906899033141 \tabularnewline
38 & 6180 & 6695.36391546151 & 72.2546019238241 & -495.052774293609 & -0.0365682284103526 \tabularnewline
39 & 8060 & 6923.38038167489 & 83.0471476492861 & 239.532232753285 & 1.6145008508647 \tabularnewline
40 & 6500 & 6959.44527241987 & 79.7982650195589 & -188.76519545047 & -0.487164023940789 \tabularnewline
41 & 6360 & 6951.06283614439 & 73.6890587543732 & -83.5953361831154 & -0.913380967574923 \tabularnewline
42 & 7760 & 7081.05089161947 & 77.5987957593209 & 355.547625094527 & 0.582131451740783 \tabularnewline
43 & 7080 & 7126.77115624454 & 75.3803514770751 & 135.96031913707 & -0.328954842121331 \tabularnewline
44 & 7940 & 7294.0298369897 & 81.7846317170833 & 120.48673792202 & 0.946086222924853 \tabularnewline
45 & 7340 & 7393.09772511262 & 82.990808549843 & -151.724826872255 & 0.177590469015313 \tabularnewline
46 & 7860 & 7485.50344011217 & 83.6484882388526 & 320.898439991345 & 0.0965232585016132 \tabularnewline
47 & 6720 & 7483.41553238799 & 77.6529067466716 & -277.028499134984 & -0.876138993539109 \tabularnewline
48 & 7680 & 7592.9983199695 & 79.8909357025411 & -92.5313120788868 & 0.323817713759634 \tabularnewline
49 & 8920 & 7794.89487647633 & 88.488789315811 & 454.286076948363 & 1.22375482625798 \tabularnewline
50 & 7200 & 7886.43447363655 & 88.7023716889521 & -703.549737622521 & 0.0310760922175373 \tabularnewline
51 & 7800 & 7923.76169770276 & 85.1150748799309 & 166.018355966491 & -0.525769444453621 \tabularnewline
\hline
\end{tabular}
%Source: https://freestatistics.org/blog/index.php?pk=299635&T=1

[TABLE]
[ROW][C]Structural Time Series Model -- Interpolation[/C][/ROW]
[ROW][C]t[/C][C]Observed[/C][C]Level[/C][C]Slope[/C][C]Seasonal[/C][C]Stand. Residuals[/C][/ROW]
[ROW][C]1[/C][C]4360[/C][C]4360[/C][C]0[/C][C]0[/C][C]0[/C][/ROW]
[ROW][C]2[/C][C]3120[/C][C]4227.94367924215[/C][C]-44.0831271677097[/C][C]-140.033908509624[/C][C]-1.59891253343431[/C][/ROW]
[ROW][C]3[/C][C]4120[/C][C]4170.21949447161[/C][C]-47.5029525886546[/C][C]6.6373020279464[/C][C]-0.0994219615656393[/C][/ROW]
[ROW][C]4[/C][C]4000[/C][C]4107.53790893136[/C][C]-50.5537446022629[/C][C]-54.2817905794369[/C][C]-0.0946382300406442[/C][/ROW]
[ROW][C]5[/C][C]5360[/C][C]4331.17945871802[/C][C]-4.48974399922808[/C][C]126.491612888606[/C][C]1.61083433639199[/C][/ROW]
[ROW][C]6[/C][C]5240[/C][C]4526.82580306326[/C][C]24.4485614996791[/C][C]58.6829815091994[/C][C]1.16641950752565[/C][/ROW]
[ROW][C]7[/C][C]4240[/C][C]4492.18997341993[/C][C]16.9313479123551[/C][C]-53.8883188196406[/C][C]-0.351640565021655[/C][/ROW]
[ROW][C]8[/C][C]5460[/C][C]4689.74353912622[/C][C]37.5102989568891[/C][C]137.363386203223[/C][C]1.11504131063272[/C][/ROW]
[ROW][C]9[/C][C]4660[/C][C]4715.48255481123[/C][C]36.2916159947441[/C][C]-12.0656816674313[/C][C]-0.0759690355957462[/C][/ROW]
[ROW][C]10[/C][C]5160[/C][C]4818.96042729643[/C][C]42.692411321855[/C][C]79.3969170374457[/C][C]0.454754644600958[/C][/ROW]
[ROW][C]11[/C][C]5500[/C][C]4968.41654900534[/C][C]52.1573036857681[/C][C]92.5997085369102[/C][C]0.758224632102794[/C][/ROW]
[ROW][C]12[/C][C]3820[/C][C]4817.07694687848[/C][C]35.1991099191047[/C][C]-115.189514455774[/C][C]-1.51454528760777[/C][/ROW]
[ROW][C]13[/C][C]5380[/C][C]4901.77190367983[/C][C]40.416198354986[/C][C]-127.18943789635[/C][C]0.986572293400801[/C][/ROW]
[ROW][C]14[/C][C]4920[/C][C]4967.13605485875[/C][C]42.3136456713157[/C][C]-153.046132878035[/C][C]0.187588543220439[/C][/ROW]
[ROW][C]15[/C][C]4420[/C][C]4901.43206989561[/C][C]34.586183820746[/C][C]-40.7171637676779[/C][C]-0.789073627083856[/C][/ROW]
[ROW][C]16[/C][C]5700[/C][C]5053.80263079116[/C][C]42.7218411569492[/C][C]136.769254888557[/C][C]0.907707056682416[/C][/ROW]
[ROW][C]17[/C][C]6000[/C][C]5220.78293041018[/C][C]51.0926455230893[/C][C]208.425617891582[/C][C]1.01145377140758[/C][/ROW]
[ROW][C]18[/C][C]7160[/C][C]5535.57536078512[/C][C]68.5423381911454[/C][C]347.786115499897[/C][C]2.25167193550314[/C][/ROW]
[ROW][C]19[/C][C]6700[/C][C]5782.2786600269[/C][C]80.192548454335[/C][C]15.6854170896901[/C][C]1.58483484861771[/C][/ROW]
[ROW][C]20[/C][C]4520[/C][C]5677.69421508996[/C][C]68.191317314797[/C][C]-186.019367659921[/C][C]-1.70176429604665[/C][/ROW]
[ROW][C]21[/C][C]5980[/C][C]5763.80483312932[/C][C]69.3522008184403[/C][C]118.919924859335[/C][C]0.16991978438124[/C][/ROW]
[ROW][C]22[/C][C]6240[/C][C]5877.19180041477[/C][C]72.2073496890411[/C][C]117.373745563498[/C][C]0.427802967707991[/C][/ROW]
[ROW][C]23[/C][C]4780[/C][C]5788.82468360141[/C][C]61.7543836363915[/C][C]-93.9507814322087[/C][C]-1.59176583892416[/C][/ROW]
[ROW][C]24[/C][C]4800[/C][C]5728.17915166084[/C][C]53.6582162803147[/C][C]-213.870683504487[/C][C]-1.23978215079018[/C][/ROW]
[ROW][C]25[/C][C]5900[/C][C]5812.66040332509[/C][C]56.1344838430572[/C][C]-115.027586300988[/C][C]0.355619918721608[/C][/ROW]
[ROW][C]26[/C][C]4200[/C][C]5689.5798246246[/C][C]44.0024998947437[/C][C]-455.775168278279[/C][C]-1.83442451135557[/C][/ROW]
[ROW][C]27[/C][C]5100[/C][C]5652.81666920138[/C][C]38.73602995696[/C][C]-95.1994034548125[/C][C]-0.81455368869816[/C][/ROW]
[ROW][C]28[/C][C]5440[/C][C]5646.02600202094[/C][C]35.7668928269933[/C][C]54.0444476226444[/C][C]-0.462805085831564[/C][/ROW]
[ROW][C]29[/C][C]5820[/C][C]5686.59458181184[/C][C]36.0826087173784[/C][C]105.703387627457[/C][C]0.0492605298318425[/C][/ROW]
[ROW][C]30[/C][C]6160[/C][C]5744.39736353373[/C][C]37.5242187035241[/C][C]289.342304375526[/C][C]0.224377201526497[/C][/ROW]
[ROW][C]31[/C][C]7060[/C][C]5918.93846517402[/C][C]46.7011814326362[/C][C]340.560969464509[/C][C]1.42190973318667[/C][/ROW]
[ROW][C]32[/C][C]6760[/C][C]6094.01310503536[/C][C]55.3708952727399[/C][C]-86.1712438192676[/C][C]1.33562598415619[/C][/ROW]
[ROW][C]33[/C][C]5980[/C][C]6131.6214918403[/C][C]54.1624093999497[/C][C]-47.4299076536761[/C][C]-0.184981415622763[/C][/ROW]
[ROW][C]34[/C][C]7020[/C][C]6255.72483586188[/C][C]58.9522748631451[/C][C]354.11283221444[/C][C]0.728138594658954[/C][/ROW]
[ROW][C]35[/C][C]6420[/C][C]6335.69555344953[/C][C]60.4016239567554[/C][C]-38.7474115740052[/C][C]0.218449775394477[/C][/ROW]
[ROW][C]36[/C][C]6620[/C][C]6449.56703362767[/C][C]64.1427006398229[/C][C]-140.540242658909[/C][C]0.552431892819773[/C][/ROW]
[ROW][C]37[/C][C]7500[/C][C]6626.39986226158[/C][C]72.5041396364409[/C][C]239.000309516104[/C][C]1.14906899033141[/C][/ROW]
[ROW][C]38[/C][C]6180[/C][C]6695.36391546151[/C][C]72.2546019238241[/C][C]-495.052774293609[/C][C]-0.0365682284103526[/C][/ROW]
[ROW][C]39[/C][C]8060[/C][C]6923.38038167489[/C][C]83.0471476492861[/C][C]239.532232753285[/C][C]1.6145008508647[/C][/ROW]
[ROW][C]40[/C][C]6500[/C][C]6959.44527241987[/C][C]79.7982650195589[/C][C]-188.76519545047[/C][C]-0.487164023940789[/C][/ROW]
[ROW][C]41[/C][C]6360[/C][C]6951.06283614439[/C][C]73.6890587543732[/C][C]-83.5953361831154[/C][C]-0.913380967574923[/C][/ROW]
[ROW][C]42[/C][C]7760[/C][C]7081.05089161947[/C][C]77.5987957593209[/C][C]355.547625094527[/C][C]0.582131451740783[/C][/ROW]
[ROW][C]43[/C][C]7080[/C][C]7126.77115624454[/C][C]75.3803514770751[/C][C]135.96031913707[/C][C]-0.328954842121331[/C][/ROW]
[ROW][C]44[/C][C]7940[/C][C]7294.0298369897[/C][C]81.7846317170833[/C][C]120.48673792202[/C][C]0.946086222924853[/C][/ROW]
[ROW][C]45[/C][C]7340[/C][C]7393.09772511262[/C][C]82.990808549843[/C][C]-151.724826872255[/C][C]0.177590469015313[/C][/ROW]
[ROW][C]46[/C][C]7860[/C][C]7485.50344011217[/C][C]83.6484882388526[/C][C]320.898439991345[/C][C]0.0965232585016132[/C][/ROW]
[ROW][C]47[/C][C]6720[/C][C]7483.41553238799[/C][C]77.6529067466716[/C][C]-277.028499134984[/C][C]-0.876138993539109[/C][/ROW]
[ROW][C]48[/C][C]7680[/C][C]7592.9983199695[/C][C]79.8909357025411[/C][C]-92.5313120788868[/C][C]0.323817713759634[/C][/ROW]
[ROW][C]49[/C][C]8920[/C][C]7794.89487647633[/C][C]88.488789315811[/C][C]454.286076948363[/C][C]1.22375482625798[/C][/ROW]
[ROW][C]50[/C][C]7200[/C][C]7886.43447363655[/C][C]88.7023716889521[/C][C]-703.549737622521[/C][C]0.0310760922175373[/C][/ROW]
[ROW][C]51[/C][C]7800[/C][C]7923.76169770276[/C][C]85.1150748799309[/C][C]166.018355966491[/C][C]-0.525769444453621[/C][/ROW]
[/TABLE]
Source: https://freestatistics.org/blog/index.php?pk=299635&T=1

Globally Unique Identifier (entire table): ba.freestatistics.org/blog/index.php?pk=299635&T=1

As an alternative you can also use a QR Code:  

The GUIDs for individual cells are displayed in the table below:

Structural Time Series Model -- Interpolation
tObservedLevelSlopeSeasonalStand. Residuals
143604360000
231204227.94367924215-44.0831271677097-140.033908509624-1.59891253343431
341204170.21949447161-47.50295258865466.6373020279464-0.0994219615656393
440004107.53790893136-50.5537446022629-54.2817905794369-0.0946382300406442
553604331.17945871802-4.48974399922808126.4916128886061.61083433639199
652404526.8258030632624.448561499679158.68298150919941.16641950752565
742404492.1899734199316.9313479123551-53.8883188196406-0.351640565021655
854604689.7435391262237.5102989568891137.3633862032231.11504131063272
946604715.4825548112336.2916159947441-12.0656816674313-0.0759690355957462
1051604818.9604272964342.69241132185579.39691703744570.454754644600958
1155004968.4165490053452.157303685768192.59970853691020.758224632102794
1238204817.0769468784835.1991099191047-115.189514455774-1.51454528760777
1353804901.7719036798340.416198354986-127.189437896350.986572293400801
1449204967.1360548587542.3136456713157-153.0461328780350.187588543220439
1544204901.4320698956134.586183820746-40.7171637676779-0.789073627083856
1657005053.8026307911642.7218411569492136.7692548885570.907707056682416
1760005220.7829304101851.0926455230893208.4256178915821.01145377140758
1871605535.5753607851268.5423381911454347.7861154998972.25167193550314
1967005782.278660026980.19254845433515.68541708969011.58483484861771
2045205677.6942150899668.191317314797-186.019367659921-1.70176429604665
2159805763.8048331293269.3522008184403118.9199248593350.16991978438124
2262405877.1918004147772.2073496890411117.3737455634980.427802967707991
2347805788.8246836014161.7543836363915-93.9507814322087-1.59176583892416
2448005728.1791516608453.6582162803147-213.870683504487-1.23978215079018
2559005812.6604033250956.1344838430572-115.0275863009880.355619918721608
2642005689.579824624644.0024998947437-455.775168278279-1.83442451135557
2751005652.8166692013838.73602995696-95.1994034548125-0.81455368869816
2854405646.0260020209435.766892826993354.0444476226444-0.462805085831564
2958205686.5945818118436.0826087173784105.7033876274570.0492605298318425
3061605744.3973635337337.5242187035241289.3423043755260.224377201526497
3170605918.9384651740246.7011814326362340.5609694645091.42190973318667
3267606094.0131050353655.3708952727399-86.17124381926761.33562598415619
3359806131.621491840354.1624093999497-47.4299076536761-0.184981415622763
3470206255.7248358618858.9522748631451354.112832214440.728138594658954
3564206335.6955534495360.4016239567554-38.74741157400520.218449775394477
3666206449.5670336276764.1427006398229-140.5402426589090.552431892819773
3775006626.3998622615872.5041396364409239.0003095161041.14906899033141
3861806695.3639154615172.2546019238241-495.052774293609-0.0365682284103526
3980606923.3803816748983.0471476492861239.5322327532851.6145008508647
4065006959.4452724198779.7982650195589-188.76519545047-0.487164023940789
4163606951.0628361443973.6890587543732-83.5953361831154-0.913380967574923
4277607081.0508916194777.5987957593209355.5476250945270.582131451740783
4370807126.7711562445475.3803514770751135.96031913707-0.328954842121331
4479407294.029836989781.7846317170833120.486737922020.946086222924853
4573407393.0977251126282.990808549843-151.7248268722550.177590469015313
4678607485.5034401121783.6484882388526320.8984399913450.0965232585016132
4767207483.4155323879977.6529067466716-277.028499134984-0.876138993539109
4876807592.998319969579.8909357025411-92.53131207888680.323817713759634
4989207794.8948764763388.488789315811454.2860769483631.22375482625798
5072007886.4344736365588.7023716889521-703.5497376225210.0310760922175373
5178007923.7616977027685.1150748799309166.018355966491-0.525769444453621


Structural Time Series Model -- Extrapolation
tObservedLevelSeasonal
17842.559302141988109.14040560931-266.581103467336
27872.442562182578189.23301364884-316.790451466267
39114.381301159018269.32562168836845.055679470648
48568.488911207818349.41822972789219.070681479924
59010.937253267898429.51083776741581.426415500484
68373.459432820358509.60344580693-136.144012986589
78992.588329531878589.69605384646402.892275685412
87863.164705990448669.78866188598-806.623955895536
98482.308145903048749.8812699255-267.573124022469
109557.580801527938829.97387796503727.606923562906
117991.42708581558910.06648600455-918.63940018905
128926.459166371958990.15909404408-63.6999276721276

\begin{tabular}{lllllllll}
\hline
Structural Time Series Model -- Extrapolation \tabularnewline
t & Observed & Level & Seasonal \tabularnewline
1 & 7842.55930214198 & 8109.14040560931 & -266.581103467336 \tabularnewline
2 & 7872.44256218257 & 8189.23301364884 & -316.790451466267 \tabularnewline
3 & 9114.38130115901 & 8269.32562168836 & 845.055679470648 \tabularnewline
4 & 8568.48891120781 & 8349.41822972789 & 219.070681479924 \tabularnewline
5 & 9010.93725326789 & 8429.51083776741 & 581.426415500484 \tabularnewline
6 & 8373.45943282035 & 8509.60344580693 & -136.144012986589 \tabularnewline
7 & 8992.58832953187 & 8589.69605384646 & 402.892275685412 \tabularnewline
8 & 7863.16470599044 & 8669.78866188598 & -806.623955895536 \tabularnewline
9 & 8482.30814590304 & 8749.8812699255 & -267.573124022469 \tabularnewline
10 & 9557.58080152793 & 8829.97387796503 & 727.606923562906 \tabularnewline
11 & 7991.4270858155 & 8910.06648600455 & -918.63940018905 \tabularnewline
12 & 8926.45916637195 & 8990.15909404408 & -63.6999276721276 \tabularnewline
\hline
\end{tabular}
%Source: https://freestatistics.org/blog/index.php?pk=299635&T=2

[TABLE]
[ROW][C]Structural Time Series Model -- Extrapolation[/C][/ROW]
[ROW][C]t[/C][C]Observed[/C][C]Level[/C][C]Seasonal[/C][/ROW]
[ROW][C]1[/C][C]7842.55930214198[/C][C]8109.14040560931[/C][C]-266.581103467336[/C][/ROW]
[ROW][C]2[/C][C]7872.44256218257[/C][C]8189.23301364884[/C][C]-316.790451466267[/C][/ROW]
[ROW][C]3[/C][C]9114.38130115901[/C][C]8269.32562168836[/C][C]845.055679470648[/C][/ROW]
[ROW][C]4[/C][C]8568.48891120781[/C][C]8349.41822972789[/C][C]219.070681479924[/C][/ROW]
[ROW][C]5[/C][C]9010.93725326789[/C][C]8429.51083776741[/C][C]581.426415500484[/C][/ROW]
[ROW][C]6[/C][C]8373.45943282035[/C][C]8509.60344580693[/C][C]-136.144012986589[/C][/ROW]
[ROW][C]7[/C][C]8992.58832953187[/C][C]8589.69605384646[/C][C]402.892275685412[/C][/ROW]
[ROW][C]8[/C][C]7863.16470599044[/C][C]8669.78866188598[/C][C]-806.623955895536[/C][/ROW]
[ROW][C]9[/C][C]8482.30814590304[/C][C]8749.8812699255[/C][C]-267.573124022469[/C][/ROW]
[ROW][C]10[/C][C]9557.58080152793[/C][C]8829.97387796503[/C][C]727.606923562906[/C][/ROW]
[ROW][C]11[/C][C]7991.4270858155[/C][C]8910.06648600455[/C][C]-918.63940018905[/C][/ROW]
[ROW][C]12[/C][C]8926.45916637195[/C][C]8990.15909404408[/C][C]-63.6999276721276[/C][/ROW]
[/TABLE]
Source: https://freestatistics.org/blog/index.php?pk=299635&T=2

Globally Unique Identifier (entire table): ba.freestatistics.org/blog/index.php?pk=299635&T=2

As an alternative you can also use a QR Code:  

The GUIDs for individual cells are displayed in the table below:

Structural Time Series Model -- Extrapolation
tObservedLevelSeasonal
17842.559302141988109.14040560931-266.581103467336
27872.442562182578189.23301364884-316.790451466267
39114.381301159018269.32562168836845.055679470648
48568.488911207818349.41822972789219.070681479924
59010.937253267898429.51083776741581.426415500484
68373.459432820358509.60344580693-136.144012986589
78992.588329531878589.69605384646402.892275685412
87863.164705990448669.78866188598-806.623955895536
98482.308145903048749.8812699255-267.573124022469
109557.580801527938829.97387796503727.606923562906
117991.42708581558910.06648600455-918.63940018905
128926.459166371958990.15909404408-63.6999276721276


Parameters (Session):
par1 = 12 ; par2 = 12 ; par3 = BFGS ;
Parameters (R input):
par1 = 12 ; par2 = 12 ; par3 = BFGS ;
R code (references can be found in the software module):
require('stsm')
require('stsm.class')
require('KFKSDS')
par1 <- as.numeric(par1)
par2 <- as.numeric(par2)
nx <- length(x)
x <- ts(x,frequency=par1)
m <- StructTS(x,type='BSM')
print(m$coef)
print(m$fitted)
print(m$resid)
mylevel <- as.numeric(m$fitted[,'level'])
myslope <- as.numeric(m$fitted[,'slope'])
myseas <- as.numeric(m$fitted[,'sea'])
myresid <- as.numeric(m$resid)
myfit <- mylevel+myseas
mm <- stsm.model(model = 'BSM', y = x, transPars = 'StructTS')
fit2 <- stsmFit(mm, stsm.method = 'maxlik.td.optim', method = par3, KF.args = list(P0cov = TRUE))
(fit2.comps <- tsSmooth(fit2, P0cov = FALSE)$states)
m2 <- set.pars(mm, pmax(fit2$par, .Machine$double.eps))
(ss <- char2numeric(m2))
(pred <- predict(ss, x, n.ahead = par2))
mylagmax <- nx/2
bitmap(file='test2.png')
op <- par(mfrow = c(2,2))
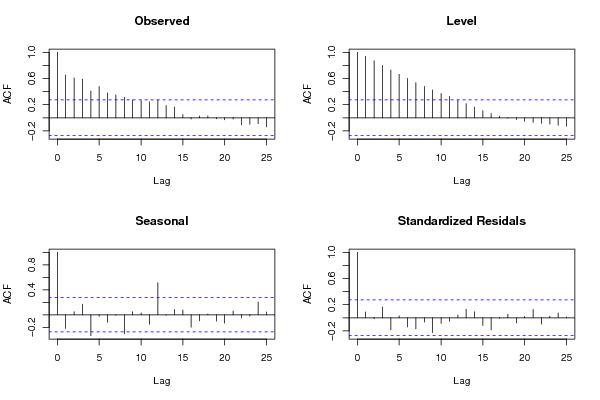
acf(as.numeric(x),lag.max = mylagmax,main='Observed')
acf(mylevel,na.action=na.pass,lag.max = mylagmax,main='Level')
acf(myseas,na.action=na.pass,lag.max = mylagmax,main='Seasonal')
acf(myresid,na.action=na.pass,lag.max = mylagmax,main='Standardized Residals')
par(op)
dev.off()
bitmap(file='test3.png')
op <- par(mfrow = c(2,2))
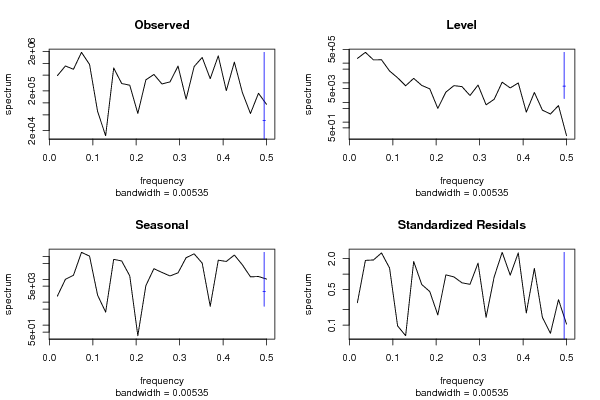
spectrum(as.numeric(x),main='Observed')
spectrum(mylevel,main='Level')
spectrum(myseas,main='Seasonal')
spectrum(myresid,main='Standardized Residals')
par(op)
dev.off()
bitmap(file='test4.png')
op <- par(mfrow = c(2,2))
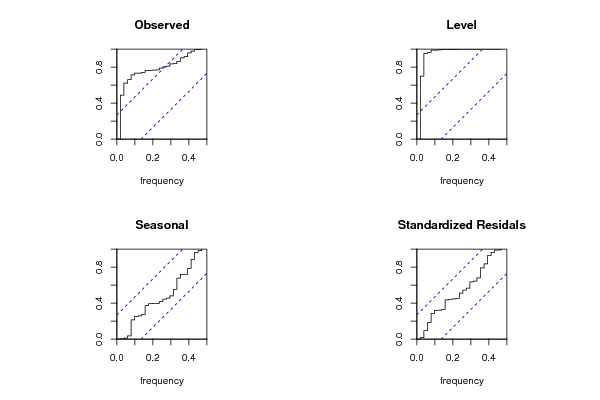
cpgram(as.numeric(x),main='Observed')
cpgram(mylevel,main='Level')
cpgram(myseas,main='Seasonal')
cpgram(myresid,main='Standardized Residals')
par(op)
dev.off()
bitmap(file='test1.png')
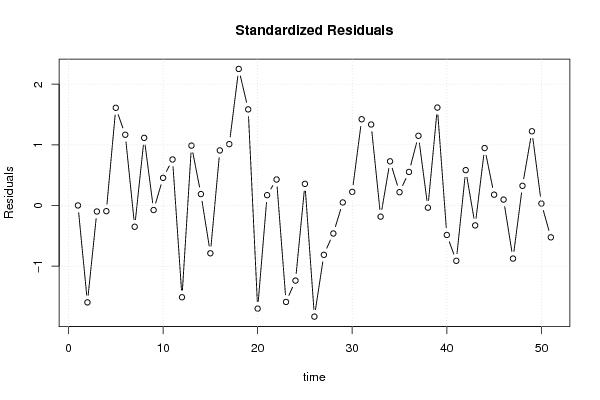
plot(as.numeric(m$resid),main='Standardized Residuals',ylab='Residuals',xlab='time',type='b')
grid()
dev.off()
bitmap(file='test5.png')
op <- par(mfrow = c(2,2))
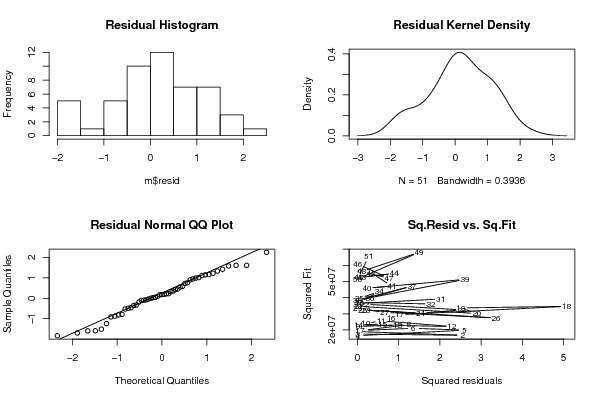
hist(m$resid,main='Residual Histogram')
plot(density(m$resid),main='Residual Kernel Density')
qqnorm(m$resid,main='Residual Normal QQ Plot')
qqline(m$resid)
plot(m$resid^2, myfit^2,main='Sq.Resid vs. Sq.Fit',xlab='Squared residuals',ylab='Squared Fit')
par(op)
dev.off()
bitmap(file='test6.png')
par(mfrow = c(3,1), mar = c(3,3,3,3))
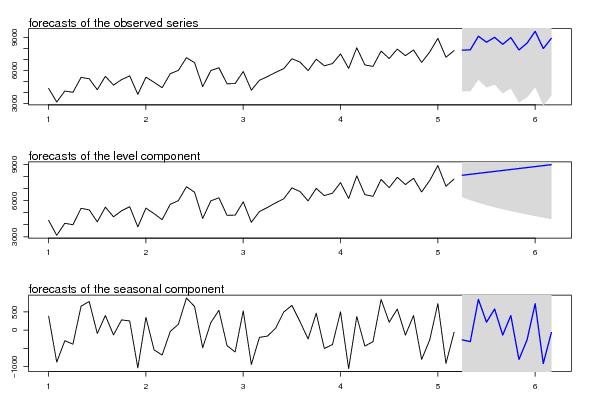
plot(cbind(x, pred$pred), type = 'n', plot.type = 'single', ylab = '')
lines(x)
polygon(c(time(pred$pred), rev(time(pred$pred))), c(pred$pred + 2 * pred$se, rev(pred$pred)), col = 'gray85', border = NA)
polygon(c(time(pred$pred), rev(time(pred$pred))), c(pred$pred - 2 * pred$se, rev(pred$pred)), col = ' gray85', border = NA)
lines(pred$pred, col = 'blue', lwd = 1.5)
mtext(text = 'forecasts of the observed series', side = 3, adj = 0)
plot(cbind(x, pred$a[,1]), type = 'n', plot.type = 'single', ylab = '')
lines(x)
polygon(c(time(pred$a[,1]), rev(time(pred$a[,1]))), c(pred$a[,1] + 2 * sqrt(pred$P[,1]), rev(pred$a[,1])), col = 'gray85', border = NA)
polygon(c(time(pred$a[,1]), rev(time(pred$a[,1]))), c(pred$a[,1] - 2 * sqrt(pred$P[,1]), rev(pred$a[,1])), col = ' gray85', border = NA)
lines(pred$a[,1], col = 'blue', lwd = 1.5)
mtext(text = 'forecasts of the level component', side = 3, adj = 0)
plot(cbind(fit2.comps[,3], pred$a[,3]), type = 'n', plot.type = 'single', ylab = '')
lines(fit2.comps[,3])
polygon(c(time(pred$a[,3]), rev(time(pred$a[,3]))), c(pred$a[,3] + 2 * sqrt(pred$P[,3]), rev(pred$a[,3])), col = 'gray85', border = NA)
polygon(c(time(pred$a[,3]), rev(time(pred$a[,3]))), c(pred$a[,3] - 2 * sqrt(pred$P[,3]), rev(pred$a[,3])), col = ' gray85', border = NA)
lines(pred$a[,3], col = 'blue', lwd = 1.5)
mtext(text = 'forecasts of the seasonal component', side = 3, adj = 0)
dev.off()
load(file='createtable')
a<-table.start()
a<-table.row.start(a)
a<-table.element(a,'Structural Time Series Model -- Interpolation',6,TRUE)
a<-table.row.end(a)
a<-table.row.start(a)
a<-table.element(a,'t',header=TRUE)
a<-table.element(a,'Observed',header=TRUE)
a<-table.element(a,'Level',header=TRUE)
a<-table.element(a,'Slope',header=TRUE)
a<-table.element(a,'Seasonal',header=TRUE)
a<-table.element(a,'Stand. Residuals',header=TRUE)
a<-table.row.end(a)
for (i in 1:nx) {
a<-table.row.start(a)
a<-table.element(a,i,header=TRUE)
a<-table.element(a,x[i])
a<-table.element(a,mylevel[i])
a<-table.element(a,myslope[i])
a<-table.element(a,myseas[i])
a<-table.element(a,myresid[i])
a<-table.row.end(a)
}
a<-table.end(a)
table.save(a,file='mytable.tab')
a<-table.start()
a<-table.row.start(a)
a<-table.element(a,'Structural Time Series Model -- Extrapolation',4,TRUE)
a<-table.row.end(a)
a<-table.row.start(a)
a<-table.element(a,'t',header=TRUE)
a<-table.element(a,'Observed',header=TRUE)
a<-table.element(a,'Level',header=TRUE)
a<-table.element(a,'Seasonal',header=TRUE)
a<-table.row.end(a)
for (i in 1:par2) {
a<-table.row.start(a)
a<-table.element(a,i,header=TRUE)
a<-table.element(a,pred$pred[i])
a<-table.element(a,pred$a[i,1])
a<-table.element(a,pred$a[i,3])
a<-table.row.end(a)
}
a<-table.end(a)
table.save(a,file='mytable1.tab')