Free Statistics

of Irreproducible Research!

Author's title

Author*The author of this computation has been verified*
R Software Modulerwasp_structuraltimeseries.wasp
Title produced by softwareStructural Time Series Models
Date of computationTue, 13 Dec 2016 22:19:06 +0100
Cite this page as followsStatistical Computations at FreeStatistics.org, Office for Research Development and Education, URL https://freestatistics.org/blog/index.php?v=date/2016/Dec/13/t14816640386ya5axm17n32p2r.htm/, Retrieved Sat, 18 May 2024 07:30:38 +0000
Statistical Computations at FreeStatistics.org, Office for Research Development and Education, URL https://freestatistics.org/blog/index.php?pk=299234, Retrieved Sat, 18 May 2024 07:30:38 +0000
QR Codes:

Original text written by user:
IsPrivate?No (this computation is public)
User-defined keywords
Estimated Impact64
Family? (F = Feedback message, R = changed R code, M = changed R Module, P = changed Parameters, D = changed Data)
-       [Structural Time Series Models] [] [2016-12-13 21:19:06] [130d73899007e5ff8a4f636b9bcfb397] [Current]
Feedback Forum

Post a new message
Dataseries X:
1737.4
1934.4
1716
1894.6
2078.4
2116.4
2132.8
1874.2
2021.4
2109
2101.2
1913
1965
1903.4
1837.4
1888
1912
1971.4
2041.6
2132.2
2075.4
2172
2284.6
2396.4
2539.4
2688
2964.2
3375.6
3271.4
3714.8
3989.4
4367.2
5070.4
5651.6
6180.8
5428.6
5346.4
5891.8
5527
5191.4
5324.6


Summary of computational transaction
Raw Input view raw input (R code)
Raw Outputview raw output of R engine
Computing time3 seconds
R ServerBig Analytics Cloud Computing Center

\begin{tabular}{lllllllll}
\hline
Summary of computational transaction \tabularnewline
Raw Input view raw input (R code)  \tabularnewline
Raw Outputview raw output of R engine  \tabularnewline
Computing time3 seconds \tabularnewline
R ServerBig Analytics Cloud Computing Center \tabularnewline
\hline
\end{tabular}
%Source: https://freestatistics.org/blog/index.php?pk=299234&T=0

[TABLE]
[ROW]
Summary of computational transaction[/C][/ROW] [ROW]Raw Input[/C] view raw input (R code) [/C][/ROW] [ROW]Raw Output[/C]view raw output of R engine [/C][/ROW] [ROW]Computing time[/C]3 seconds[/C][/ROW] [ROW]R Server[/C]Big Analytics Cloud Computing Center[/C][/ROW] [/TABLE] Source: https://freestatistics.org/blog/index.php?pk=299234&T=0

Globally Unique Identifier (entire table): ba.freestatistics.org/blog/index.php?pk=299234&T=0

As an alternative you can also use a QR Code:  

The GUIDs for individual cells are displayed in the table below:

Summary of computational transaction
Raw Input view raw input (R code)
Raw Outputview raw output of R engine
Computing time3 seconds
R ServerBig Analytics Cloud Computing Center


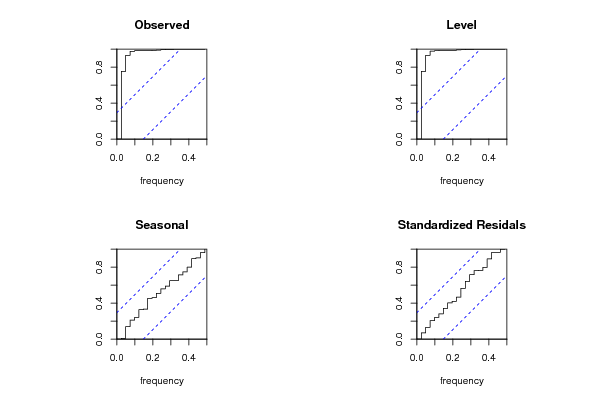
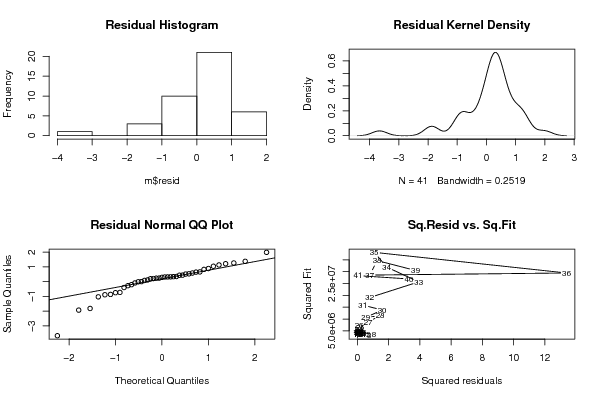
Structural Time Series Model -- Interpolation
tObservedLevelSlopeSeasonalStand. Residuals
11737.41737.4000
21934.41923.9865203470510.832854226459210.41347965294970.431542118489002
317161708.361151308985.600769114856167.63884869101652-0.866461178759479
41894.61883.1647011329710.9541308708911.43529886702680.644198729316468
52078.42067.2459268975617.906011146613711.15407310243630.656167734517152
62116.42106.1713211069618.911970835123910.22867889304520.0793308981316005
72132.82122.4055579955918.765262814918210.3944420044071-0.0100674541759297
81874.21866.241558560722.011929333098857.95844143927543-1.03007441487843
92021.42009.8588661368211.404040856891811.54113386318430.528918752740728
1021092098.5559579787116.89171956586610.44404202129230.287920221625364
112101.22091.3155430302815.08153239449119.88445696971599-0.0896811836903459
1219131904.43220671279-0.7586963050151488.56779328720535-0.749021701663276
1319652020.079389211366.0056178407648-55.07938921136440.512000917888651
141903.41899.82783319899-5.621855062418353.57216680100849-0.398194745924603
151837.41838.2382128249-10.4062204843957-0.838212824897762-0.206488037895428
1618881884.49559091011-5.478927049835273.50440908989320.208729201229507
1719121909.15918128477-2.811950719242382.840818715229640.110947886380548
181971.41969.439845010692.847972477284661.960154989312030.232062184143593
192041.62036.894326917228.709264559400084.705673082781060.237486178319913
202132.22131.7284580451716.59492696106860.4715419548283880.316425263934897
212075.42073.581996215249.699934224284621.8180037847624-0.274486668599367
2221722168.5816510357117.61744204488743.418348964291930.313152963369803
232284.62280.4342812842726.40923788112694.165718715734640.34587105837356
242396.42395.4191447510934.70193717896490.9808552489055330.324939925553255
252539.42539.286382622644.52788452581620.1136173774026580.43636673341009
2626882683.1721983368354.01119735089254.827801663169240.333557266215608
272964.22962.4786297103175.29283444701641.721370289690950.826355745288575
283375.63368.07668512332106.5236212147567.523314876682861.21039912323946
293271.43274.8472415140687.6054094518468-3.44724151405894-0.732035450394367
303714.83706.65324789776120.2455149942928.146752102237131.26133002794377
313989.43985.61346842142135.3117238873983.78653157857650.581581134574359
324367.24362.63392408856158.2755855423144.566075911435510.885657953791068
335070.45061.59735895722209.6797630750718.80264104277711.98109065356781
345651.65645.92833908525245.3187797212295.671660914748381.37269446290312
356180.86174.91156887998272.3168495628975.888431120022931.03937489490454
365428.65448.11369825217177.234092711026-19.5136982521716-3.65914943200496
375346.45395.96213005583155.647867722882-49.5621300558299-0.889147856655131
385891.85878.21451229388186.71489363988613.58548770611521.12687622452154
3955275538.98034991765136.623716250577-11.9803499176545-1.92743955505774
405191.45179.5721654508289.370353143532111.8278345491791-1.81615512117948
415324.65322.2186532809694.44625329762952.381346719045130.19509252501093

\begin{tabular}{lllllllll}
\hline
Structural Time Series Model -- Interpolation \tabularnewline
t & Observed & Level & Slope & Seasonal & Stand. Residuals \tabularnewline
1 & 1737.4 & 1737.4 & 0 & 0 & 0 \tabularnewline
2 & 1934.4 & 1923.98652034705 & 10.8328542264592 & 10.4134796529497 & 0.431542118489002 \tabularnewline
3 & 1716 & 1708.36115130898 & 5.60076911485616 & 7.63884869101652 & -0.866461178759479 \tabularnewline
4 & 1894.6 & 1883.16470113297 & 10.95413087089 & 11.4352988670268 & 0.644198729316468 \tabularnewline
5 & 2078.4 & 2067.24592689756 & 17.9060111466137 & 11.1540731024363 & 0.656167734517152 \tabularnewline
6 & 2116.4 & 2106.17132110696 & 18.9119708351239 & 10.2286788930452 & 0.0793308981316005 \tabularnewline
7 & 2132.8 & 2122.40555799559 & 18.7652628149182 & 10.3944420044071 & -0.0100674541759297 \tabularnewline
8 & 1874.2 & 1866.24155856072 & 2.01192933309885 & 7.95844143927543 & -1.03007441487843 \tabularnewline
9 & 2021.4 & 2009.85886613682 & 11.4040408568918 & 11.5411338631843 & 0.528918752740728 \tabularnewline
10 & 2109 & 2098.55595797871 & 16.891719565866 & 10.4440420212923 & 0.287920221625364 \tabularnewline
11 & 2101.2 & 2091.31554303028 & 15.0815323944911 & 9.88445696971599 & -0.0896811836903459 \tabularnewline
12 & 1913 & 1904.43220671279 & -0.758696305015148 & 8.56779328720535 & -0.749021701663276 \tabularnewline
13 & 1965 & 2020.07938921136 & 6.0056178407648 & -55.0793892113644 & 0.512000917888651 \tabularnewline
14 & 1903.4 & 1899.82783319899 & -5.62185506241835 & 3.57216680100849 & -0.398194745924603 \tabularnewline
15 & 1837.4 & 1838.2382128249 & -10.4062204843957 & -0.838212824897762 & -0.206488037895428 \tabularnewline
16 & 1888 & 1884.49559091011 & -5.47892704983527 & 3.5044090898932 & 0.208729201229507 \tabularnewline
17 & 1912 & 1909.15918128477 & -2.81195071924238 & 2.84081871522964 & 0.110947886380548 \tabularnewline
18 & 1971.4 & 1969.43984501069 & 2.84797247728466 & 1.96015498931203 & 0.232062184143593 \tabularnewline
19 & 2041.6 & 2036.89432691722 & 8.70926455940008 & 4.70567308278106 & 0.237486178319913 \tabularnewline
20 & 2132.2 & 2131.72845804517 & 16.5949269610686 & 0.471541954828388 & 0.316425263934897 \tabularnewline
21 & 2075.4 & 2073.58199621524 & 9.69993422428462 & 1.8180037847624 & -0.274486668599367 \tabularnewline
22 & 2172 & 2168.58165103571 & 17.6174420448874 & 3.41834896429193 & 0.313152963369803 \tabularnewline
23 & 2284.6 & 2280.43428128427 & 26.4092378811269 & 4.16571871573464 & 0.34587105837356 \tabularnewline
24 & 2396.4 & 2395.41914475109 & 34.7019371789649 & 0.980855248905533 & 0.324939925553255 \tabularnewline
25 & 2539.4 & 2539.2863826226 & 44.5278845258162 & 0.113617377402658 & 0.43636673341009 \tabularnewline
26 & 2688 & 2683.17219833683 & 54.0111973508925 & 4.82780166316924 & 0.333557266215608 \tabularnewline
27 & 2964.2 & 2962.47862971031 & 75.2928344470164 & 1.72137028969095 & 0.826355745288575 \tabularnewline
28 & 3375.6 & 3368.07668512332 & 106.523621214756 & 7.52331487668286 & 1.21039912323946 \tabularnewline
29 & 3271.4 & 3274.84724151406 & 87.6054094518468 & -3.44724151405894 & -0.732035450394367 \tabularnewline
30 & 3714.8 & 3706.65324789776 & 120.245514994292 & 8.14675210223713 & 1.26133002794377 \tabularnewline
31 & 3989.4 & 3985.61346842142 & 135.311723887398 & 3.7865315785765 & 0.581581134574359 \tabularnewline
32 & 4367.2 & 4362.63392408856 & 158.275585542314 & 4.56607591143551 & 0.885657953791068 \tabularnewline
33 & 5070.4 & 5061.59735895722 & 209.679763075071 & 8.8026410427771 & 1.98109065356781 \tabularnewline
34 & 5651.6 & 5645.92833908525 & 245.318779721229 & 5.67166091474838 & 1.37269446290312 \tabularnewline
35 & 6180.8 & 6174.91156887998 & 272.316849562897 & 5.88843112002293 & 1.03937489490454 \tabularnewline
36 & 5428.6 & 5448.11369825217 & 177.234092711026 & -19.5136982521716 & -3.65914943200496 \tabularnewline
37 & 5346.4 & 5395.96213005583 & 155.647867722882 & -49.5621300558299 & -0.889147856655131 \tabularnewline
38 & 5891.8 & 5878.21451229388 & 186.714893639886 & 13.5854877061152 & 1.12687622452154 \tabularnewline
39 & 5527 & 5538.98034991765 & 136.623716250577 & -11.9803499176545 & -1.92743955505774 \tabularnewline
40 & 5191.4 & 5179.57216545082 & 89.3703531435321 & 11.8278345491791 & -1.81615512117948 \tabularnewline
41 & 5324.6 & 5322.21865328096 & 94.4462532976295 & 2.38134671904513 & 0.19509252501093 \tabularnewline
\hline
\end{tabular}
%Source: https://freestatistics.org/blog/index.php?pk=299234&T=1

[TABLE]
[ROW][C]Structural Time Series Model -- Interpolation[/C][/ROW]
[ROW][C]t[/C][C]Observed[/C][C]Level[/C][C]Slope[/C][C]Seasonal[/C][C]Stand. Residuals[/C][/ROW]
[ROW][C]1[/C][C]1737.4[/C][C]1737.4[/C][C]0[/C][C]0[/C][C]0[/C][/ROW]
[ROW][C]2[/C][C]1934.4[/C][C]1923.98652034705[/C][C]10.8328542264592[/C][C]10.4134796529497[/C][C]0.431542118489002[/C][/ROW]
[ROW][C]3[/C][C]1716[/C][C]1708.36115130898[/C][C]5.60076911485616[/C][C]7.63884869101652[/C][C]-0.866461178759479[/C][/ROW]
[ROW][C]4[/C][C]1894.6[/C][C]1883.16470113297[/C][C]10.95413087089[/C][C]11.4352988670268[/C][C]0.644198729316468[/C][/ROW]
[ROW][C]5[/C][C]2078.4[/C][C]2067.24592689756[/C][C]17.9060111466137[/C][C]11.1540731024363[/C][C]0.656167734517152[/C][/ROW]
[ROW][C]6[/C][C]2116.4[/C][C]2106.17132110696[/C][C]18.9119708351239[/C][C]10.2286788930452[/C][C]0.0793308981316005[/C][/ROW]
[ROW][C]7[/C][C]2132.8[/C][C]2122.40555799559[/C][C]18.7652628149182[/C][C]10.3944420044071[/C][C]-0.0100674541759297[/C][/ROW]
[ROW][C]8[/C][C]1874.2[/C][C]1866.24155856072[/C][C]2.01192933309885[/C][C]7.95844143927543[/C][C]-1.03007441487843[/C][/ROW]
[ROW][C]9[/C][C]2021.4[/C][C]2009.85886613682[/C][C]11.4040408568918[/C][C]11.5411338631843[/C][C]0.528918752740728[/C][/ROW]
[ROW][C]10[/C][C]2109[/C][C]2098.55595797871[/C][C]16.891719565866[/C][C]10.4440420212923[/C][C]0.287920221625364[/C][/ROW]
[ROW][C]11[/C][C]2101.2[/C][C]2091.31554303028[/C][C]15.0815323944911[/C][C]9.88445696971599[/C][C]-0.0896811836903459[/C][/ROW]
[ROW][C]12[/C][C]1913[/C][C]1904.43220671279[/C][C]-0.758696305015148[/C][C]8.56779328720535[/C][C]-0.749021701663276[/C][/ROW]
[ROW][C]13[/C][C]1965[/C][C]2020.07938921136[/C][C]6.0056178407648[/C][C]-55.0793892113644[/C][C]0.512000917888651[/C][/ROW]
[ROW][C]14[/C][C]1903.4[/C][C]1899.82783319899[/C][C]-5.62185506241835[/C][C]3.57216680100849[/C][C]-0.398194745924603[/C][/ROW]
[ROW][C]15[/C][C]1837.4[/C][C]1838.2382128249[/C][C]-10.4062204843957[/C][C]-0.838212824897762[/C][C]-0.206488037895428[/C][/ROW]
[ROW][C]16[/C][C]1888[/C][C]1884.49559091011[/C][C]-5.47892704983527[/C][C]3.5044090898932[/C][C]0.208729201229507[/C][/ROW]
[ROW][C]17[/C][C]1912[/C][C]1909.15918128477[/C][C]-2.81195071924238[/C][C]2.84081871522964[/C][C]0.110947886380548[/C][/ROW]
[ROW][C]18[/C][C]1971.4[/C][C]1969.43984501069[/C][C]2.84797247728466[/C][C]1.96015498931203[/C][C]0.232062184143593[/C][/ROW]
[ROW][C]19[/C][C]2041.6[/C][C]2036.89432691722[/C][C]8.70926455940008[/C][C]4.70567308278106[/C][C]0.237486178319913[/C][/ROW]
[ROW][C]20[/C][C]2132.2[/C][C]2131.72845804517[/C][C]16.5949269610686[/C][C]0.471541954828388[/C][C]0.316425263934897[/C][/ROW]
[ROW][C]21[/C][C]2075.4[/C][C]2073.58199621524[/C][C]9.69993422428462[/C][C]1.8180037847624[/C][C]-0.274486668599367[/C][/ROW]
[ROW][C]22[/C][C]2172[/C][C]2168.58165103571[/C][C]17.6174420448874[/C][C]3.41834896429193[/C][C]0.313152963369803[/C][/ROW]
[ROW][C]23[/C][C]2284.6[/C][C]2280.43428128427[/C][C]26.4092378811269[/C][C]4.16571871573464[/C][C]0.34587105837356[/C][/ROW]
[ROW][C]24[/C][C]2396.4[/C][C]2395.41914475109[/C][C]34.7019371789649[/C][C]0.980855248905533[/C][C]0.324939925553255[/C][/ROW]
[ROW][C]25[/C][C]2539.4[/C][C]2539.2863826226[/C][C]44.5278845258162[/C][C]0.113617377402658[/C][C]0.43636673341009[/C][/ROW]
[ROW][C]26[/C][C]2688[/C][C]2683.17219833683[/C][C]54.0111973508925[/C][C]4.82780166316924[/C][C]0.333557266215608[/C][/ROW]
[ROW][C]27[/C][C]2964.2[/C][C]2962.47862971031[/C][C]75.2928344470164[/C][C]1.72137028969095[/C][C]0.826355745288575[/C][/ROW]
[ROW][C]28[/C][C]3375.6[/C][C]3368.07668512332[/C][C]106.523621214756[/C][C]7.52331487668286[/C][C]1.21039912323946[/C][/ROW]
[ROW][C]29[/C][C]3271.4[/C][C]3274.84724151406[/C][C]87.6054094518468[/C][C]-3.44724151405894[/C][C]-0.732035450394367[/C][/ROW]
[ROW][C]30[/C][C]3714.8[/C][C]3706.65324789776[/C][C]120.245514994292[/C][C]8.14675210223713[/C][C]1.26133002794377[/C][/ROW]
[ROW][C]31[/C][C]3989.4[/C][C]3985.61346842142[/C][C]135.311723887398[/C][C]3.7865315785765[/C][C]0.581581134574359[/C][/ROW]
[ROW][C]32[/C][C]4367.2[/C][C]4362.63392408856[/C][C]158.275585542314[/C][C]4.56607591143551[/C][C]0.885657953791068[/C][/ROW]
[ROW][C]33[/C][C]5070.4[/C][C]5061.59735895722[/C][C]209.679763075071[/C][C]8.8026410427771[/C][C]1.98109065356781[/C][/ROW]
[ROW][C]34[/C][C]5651.6[/C][C]5645.92833908525[/C][C]245.318779721229[/C][C]5.67166091474838[/C][C]1.37269446290312[/C][/ROW]
[ROW][C]35[/C][C]6180.8[/C][C]6174.91156887998[/C][C]272.316849562897[/C][C]5.88843112002293[/C][C]1.03937489490454[/C][/ROW]
[ROW][C]36[/C][C]5428.6[/C][C]5448.11369825217[/C][C]177.234092711026[/C][C]-19.5136982521716[/C][C]-3.65914943200496[/C][/ROW]
[ROW][C]37[/C][C]5346.4[/C][C]5395.96213005583[/C][C]155.647867722882[/C][C]-49.5621300558299[/C][C]-0.889147856655131[/C][/ROW]
[ROW][C]38[/C][C]5891.8[/C][C]5878.21451229388[/C][C]186.714893639886[/C][C]13.5854877061152[/C][C]1.12687622452154[/C][/ROW]
[ROW][C]39[/C][C]5527[/C][C]5538.98034991765[/C][C]136.623716250577[/C][C]-11.9803499176545[/C][C]-1.92743955505774[/C][/ROW]
[ROW][C]40[/C][C]5191.4[/C][C]5179.57216545082[/C][C]89.3703531435321[/C][C]11.8278345491791[/C][C]-1.81615512117948[/C][/ROW]
[ROW][C]41[/C][C]5324.6[/C][C]5322.21865328096[/C][C]94.4462532976295[/C][C]2.38134671904513[/C][C]0.19509252501093[/C][/ROW]
[/TABLE]
Source: https://freestatistics.org/blog/index.php?pk=299234&T=1

Globally Unique Identifier (entire table): ba.freestatistics.org/blog/index.php?pk=299234&T=1

As an alternative you can also use a QR Code:  

The GUIDs for individual cells are displayed in the table below:

Structural Time Series Model -- Interpolation
tObservedLevelSlopeSeasonalStand. Residuals
11737.41737.4000
21934.41923.9865203470510.832854226459210.41347965294970.431542118489002
317161708.361151308985.600769114856167.63884869101652-0.866461178759479
41894.61883.1647011329710.9541308708911.43529886702680.644198729316468
52078.42067.2459268975617.906011146613711.15407310243630.656167734517152
62116.42106.1713211069618.911970835123910.22867889304520.0793308981316005
72132.82122.4055579955918.765262814918210.3944420044071-0.0100674541759297
81874.21866.241558560722.011929333098857.95844143927543-1.03007441487843
92021.42009.8588661368211.404040856891811.54113386318430.528918752740728
1021092098.5559579787116.89171956586610.44404202129230.287920221625364
112101.22091.3155430302815.08153239449119.88445696971599-0.0896811836903459
1219131904.43220671279-0.7586963050151488.56779328720535-0.749021701663276
1319652020.079389211366.0056178407648-55.07938921136440.512000917888651
141903.41899.82783319899-5.621855062418353.57216680100849-0.398194745924603
151837.41838.2382128249-10.4062204843957-0.838212824897762-0.206488037895428
1618881884.49559091011-5.478927049835273.50440908989320.208729201229507
1719121909.15918128477-2.811950719242382.840818715229640.110947886380548
181971.41969.439845010692.847972477284661.960154989312030.232062184143593
192041.62036.894326917228.709264559400084.705673082781060.237486178319913
202132.22131.7284580451716.59492696106860.4715419548283880.316425263934897
212075.42073.581996215249.699934224284621.8180037847624-0.274486668599367
2221722168.5816510357117.61744204488743.418348964291930.313152963369803
232284.62280.4342812842726.40923788112694.165718715734640.34587105837356
242396.42395.4191447510934.70193717896490.9808552489055330.324939925553255
252539.42539.286382622644.52788452581620.1136173774026580.43636673341009
2626882683.1721983368354.01119735089254.827801663169240.333557266215608
272964.22962.4786297103175.29283444701641.721370289690950.826355745288575
283375.63368.07668512332106.5236212147567.523314876682861.21039912323946
293271.43274.8472415140687.6054094518468-3.44724151405894-0.732035450394367
303714.83706.65324789776120.2455149942928.146752102237131.26133002794377
313989.43985.61346842142135.3117238873983.78653157857650.581581134574359
324367.24362.63392408856158.2755855423144.566075911435510.885657953791068
335070.45061.59735895722209.6797630750718.80264104277711.98109065356781
345651.65645.92833908525245.3187797212295.671660914748381.37269446290312
356180.86174.91156887998272.3168495628975.888431120022931.03937489490454
365428.65448.11369825217177.234092711026-19.5136982521716-3.65914943200496
375346.45395.96213005583155.647867722882-49.5621300558299-0.889147856655131
385891.85878.21451229388186.71489363988613.58548770611521.12687622452154
3955275538.98034991765136.623716250577-11.9803499176545-1.92743955505774
405191.45179.5721654508289.370353143532111.8278345491791-1.81615512117948
415324.65322.2186532809694.44625329762952.381346719045130.19509252501093


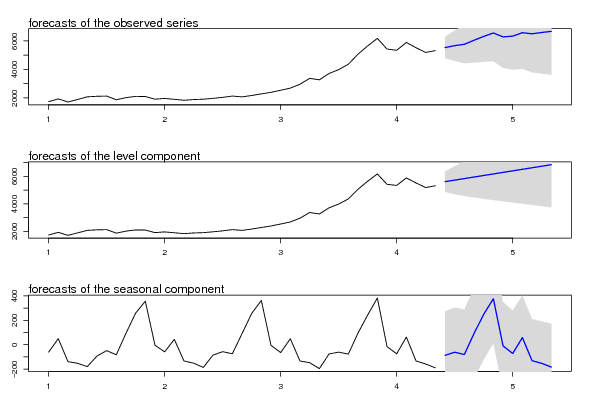
Structural Time Series Model -- Extrapolation
tObservedLevelSeasonal
15533.164110828225619.92202550413-86.7579146759029
25670.953892848865732.40176574314-61.4478728942722
35764.676439434065844.88150598214-80.2050665480813
46049.312132247765957.3612462211591.9508860266087
56318.42305944466069.84098646016248.582072984437
66558.298275215666182.32072669917375.977548516487
76285.331907451466294.80046693818-9.46855948671403
86335.65887186826407.28020717719-71.6213353089847
96578.275601957546519.759947416258.5156545413469
106501.759752183336632.2396876552-130.479935471876
116592.516235476286744.71942789421-152.20319241793
126674.35688286816857.19916813322-182.842285265118

\begin{tabular}{lllllllll}
\hline
Structural Time Series Model -- Extrapolation \tabularnewline
t & Observed & Level & Seasonal \tabularnewline
1 & 5533.16411082822 & 5619.92202550413 & -86.7579146759029 \tabularnewline
2 & 5670.95389284886 & 5732.40176574314 & -61.4478728942722 \tabularnewline
3 & 5764.67643943406 & 5844.88150598214 & -80.2050665480813 \tabularnewline
4 & 6049.31213224776 & 5957.36124622115 & 91.9508860266087 \tabularnewline
5 & 6318.4230594446 & 6069.84098646016 & 248.582072984437 \tabularnewline
6 & 6558.29827521566 & 6182.32072669917 & 375.977548516487 \tabularnewline
7 & 6285.33190745146 & 6294.80046693818 & -9.46855948671403 \tabularnewline
8 & 6335.6588718682 & 6407.28020717719 & -71.6213353089847 \tabularnewline
9 & 6578.27560195754 & 6519.7599474162 & 58.5156545413469 \tabularnewline
10 & 6501.75975218333 & 6632.2396876552 & -130.479935471876 \tabularnewline
11 & 6592.51623547628 & 6744.71942789421 & -152.20319241793 \tabularnewline
12 & 6674.3568828681 & 6857.19916813322 & -182.842285265118 \tabularnewline
\hline
\end{tabular}
%Source: https://freestatistics.org/blog/index.php?pk=299234&T=2

[TABLE]
[ROW][C]Structural Time Series Model -- Extrapolation[/C][/ROW]
[ROW][C]t[/C][C]Observed[/C][C]Level[/C][C]Seasonal[/C][/ROW]
[ROW][C]1[/C][C]5533.16411082822[/C][C]5619.92202550413[/C][C]-86.7579146759029[/C][/ROW]
[ROW][C]2[/C][C]5670.95389284886[/C][C]5732.40176574314[/C][C]-61.4478728942722[/C][/ROW]
[ROW][C]3[/C][C]5764.67643943406[/C][C]5844.88150598214[/C][C]-80.2050665480813[/C][/ROW]
[ROW][C]4[/C][C]6049.31213224776[/C][C]5957.36124622115[/C][C]91.9508860266087[/C][/ROW]
[ROW][C]5[/C][C]6318.4230594446[/C][C]6069.84098646016[/C][C]248.582072984437[/C][/ROW]
[ROW][C]6[/C][C]6558.29827521566[/C][C]6182.32072669917[/C][C]375.977548516487[/C][/ROW]
[ROW][C]7[/C][C]6285.33190745146[/C][C]6294.80046693818[/C][C]-9.46855948671403[/C][/ROW]
[ROW][C]8[/C][C]6335.6588718682[/C][C]6407.28020717719[/C][C]-71.6213353089847[/C][/ROW]
[ROW][C]9[/C][C]6578.27560195754[/C][C]6519.7599474162[/C][C]58.5156545413469[/C][/ROW]
[ROW][C]10[/C][C]6501.75975218333[/C][C]6632.2396876552[/C][C]-130.479935471876[/C][/ROW]
[ROW][C]11[/C][C]6592.51623547628[/C][C]6744.71942789421[/C][C]-152.20319241793[/C][/ROW]
[ROW][C]12[/C][C]6674.3568828681[/C][C]6857.19916813322[/C][C]-182.842285265118[/C][/ROW]
[/TABLE]
Source: https://freestatistics.org/blog/index.php?pk=299234&T=2

Globally Unique Identifier (entire table): ba.freestatistics.org/blog/index.php?pk=299234&T=2

As an alternative you can also use a QR Code:  

The GUIDs for individual cells are displayed in the table below:

Structural Time Series Model -- Extrapolation
tObservedLevelSeasonal
15533.164110828225619.92202550413-86.7579146759029
25670.953892848865732.40176574314-61.4478728942722
35764.676439434065844.88150598214-80.2050665480813
46049.312132247765957.3612462211591.9508860266087
56318.42305944466069.84098646016248.582072984437
66558.298275215666182.32072669917375.977548516487
76285.331907451466294.80046693818-9.46855948671403
86335.65887186826407.28020717719-71.6213353089847
96578.275601957546519.759947416258.5156545413469
106501.759752183336632.2396876552-130.479935471876
116592.516235476286744.71942789421-152.20319241793
126674.35688286816857.19916813322-182.842285265118


Parameters (Session):
par1 = 12 ; par2 = 12 ; par3 = BFGS ;
Parameters (R input):
par1 = 12 ; par2 = 12 ; par3 = BFGS ;
R code (references can be found in the software module):
require('stsm')
require('stsm.class')
require('KFKSDS')
par1 <- as.numeric(par1)
par2 <- as.numeric(par2)
nx <- length(x)
x <- ts(x,frequency=par1)
m <- StructTS(x,type='BSM')
print(m$coef)
print(m$fitted)
print(m$resid)
mylevel <- as.numeric(m$fitted[,'level'])
myslope <- as.numeric(m$fitted[,'slope'])
myseas <- as.numeric(m$fitted[,'sea'])
myresid <- as.numeric(m$resid)
myfit <- mylevel+myseas
mm <- stsm.model(model = 'BSM', y = x, transPars = 'StructTS')
fit2 <- stsmFit(mm, stsm.method = 'maxlik.td.optim', method = par3, KF.args = list(P0cov = TRUE))
(fit2.comps <- tsSmooth(fit2, P0cov = FALSE)$states)
m2 <- set.pars(mm, pmax(fit2$par, .Machine$double.eps))
(ss <- char2numeric(m2))
(pred <- predict(ss, x, n.ahead = par2))
mylagmax <- nx/2
bitmap(file='test2.png')
op <- par(mfrow = c(2,2))
acf(as.numeric(x),lag.max = mylagmax,main='Observed')
acf(mylevel,na.action=na.pass,lag.max = mylagmax,main='Level')
acf(myseas,na.action=na.pass,lag.max = mylagmax,main='Seasonal')
acf(myresid,na.action=na.pass,lag.max = mylagmax,main='Standardized Residals')
par(op)
dev.off()
bitmap(file='test3.png')
op <- par(mfrow = c(2,2))
spectrum(as.numeric(x),main='Observed')
spectrum(mylevel,main='Level')
spectrum(myseas,main='Seasonal')
spectrum(myresid,main='Standardized Residals')
par(op)
dev.off()
bitmap(file='test4.png')
op <- par(mfrow = c(2,2))
cpgram(as.numeric(x),main='Observed')
cpgram(mylevel,main='Level')
cpgram(myseas,main='Seasonal')
cpgram(myresid,main='Standardized Residals')
par(op)
dev.off()
bitmap(file='test1.png')
plot(as.numeric(m$resid),main='Standardized Residuals',ylab='Residuals',xlab='time',type='b')
grid()
dev.off()
bitmap(file='test5.png')
op <- par(mfrow = c(2,2))
hist(m$resid,main='Residual Histogram')
plot(density(m$resid),main='Residual Kernel Density')
qqnorm(m$resid,main='Residual Normal QQ Plot')
qqline(m$resid)
plot(m$resid^2, myfit^2,main='Sq.Resid vs. Sq.Fit',xlab='Squared residuals',ylab='Squared Fit')
par(op)
dev.off()
bitmap(file='test6.png')
par(mfrow = c(3,1), mar = c(3,3,3,3))
plot(cbind(x, pred$pred), type = 'n', plot.type = 'single', ylab = '')
lines(x)
polygon(c(time(pred$pred), rev(time(pred$pred))), c(pred$pred + 2 * pred$se, rev(pred$pred)), col = 'gray85', border = NA)
polygon(c(time(pred$pred), rev(time(pred$pred))), c(pred$pred - 2 * pred$se, rev(pred$pred)), col = ' gray85', border = NA)
lines(pred$pred, col = 'blue', lwd = 1.5)
mtext(text = 'forecasts of the observed series', side = 3, adj = 0)
plot(cbind(x, pred$a[,1]), type = 'n', plot.type = 'single', ylab = '')
lines(x)
polygon(c(time(pred$a[,1]), rev(time(pred$a[,1]))), c(pred$a[,1] + 2 * sqrt(pred$P[,1]), rev(pred$a[,1])), col = 'gray85', border = NA)
polygon(c(time(pred$a[,1]), rev(time(pred$a[,1]))), c(pred$a[,1] - 2 * sqrt(pred$P[,1]), rev(pred$a[,1])), col = ' gray85', border = NA)
lines(pred$a[,1], col = 'blue', lwd = 1.5)
mtext(text = 'forecasts of the level component', side = 3, adj = 0)
plot(cbind(fit2.comps[,3], pred$a[,3]), type = 'n', plot.type = 'single', ylab = '')
lines(fit2.comps[,3])
polygon(c(time(pred$a[,3]), rev(time(pred$a[,3]))), c(pred$a[,3] + 2 * sqrt(pred$P[,3]), rev(pred$a[,3])), col = 'gray85', border = NA)
polygon(c(time(pred$a[,3]), rev(time(pred$a[,3]))), c(pred$a[,3] - 2 * sqrt(pred$P[,3]), rev(pred$a[,3])), col = ' gray85', border = NA)
lines(pred$a[,3], col = 'blue', lwd = 1.5)
mtext(text = 'forecasts of the seasonal component', side = 3, adj = 0)
dev.off()
load(file='createtable')
a<-table.start()
a<-table.row.start(a)
a<-table.element(a,'Structural Time Series Model -- Interpolation',6,TRUE)
a<-table.row.end(a)
a<-table.row.start(a)
a<-table.element(a,'t',header=TRUE)
a<-table.element(a,'Observed',header=TRUE)
a<-table.element(a,'Level',header=TRUE)
a<-table.element(a,'Slope',header=TRUE)
a<-table.element(a,'Seasonal',header=TRUE)
a<-table.element(a,'Stand. Residuals',header=TRUE)
a<-table.row.end(a)
for (i in 1:nx) {
a<-table.row.start(a)
a<-table.element(a,i,header=TRUE)
a<-table.element(a,x[i])
a<-table.element(a,mylevel[i])
a<-table.element(a,myslope[i])
a<-table.element(a,myseas[i])
a<-table.element(a,myresid[i])
a<-table.row.end(a)
}
a<-table.end(a)
table.save(a,file='mytable.tab')
a<-table.start()
a<-table.row.start(a)
a<-table.element(a,'Structural Time Series Model -- Extrapolation',4,TRUE)
a<-table.row.end(a)
a<-table.row.start(a)
a<-table.element(a,'t',header=TRUE)
a<-table.element(a,'Observed',header=TRUE)
a<-table.element(a,'Level',header=TRUE)
a<-table.element(a,'Seasonal',header=TRUE)
a<-table.row.end(a)
for (i in 1:par2) {
a<-table.row.start(a)
a<-table.element(a,i,header=TRUE)
a<-table.element(a,pred$pred[i])
a<-table.element(a,pred$a[i,1])
a<-table.element(a,pred$a[i,3])
a<-table.row.end(a)
}
a<-table.end(a)
table.save(a,file='mytable1.tab')