Free Statistics

of Irreproducible Research!

Author's title

Author*The author of this computation has been verified*
R Software Modulerwasp_autocorrelation.wasp
Title produced by software(Partial) Autocorrelation Function
Date of computationFri, 09 Dec 2016 16:30:16 +0100
Cite this page as followsStatistical Computations at FreeStatistics.org, Office for Research Development and Education, URL https://freestatistics.org/blog/index.php?v=date/2016/Dec/09/t1481297459fwmta72tjftaqqa.htm/, Retrieved Sat, 18 May 2024 04:33:01 +0000
Statistical Computations at FreeStatistics.org, Office for Research Development and Education, URL https://freestatistics.org/blog/index.php?pk=298575, Retrieved Sat, 18 May 2024 04:33:01 +0000
QR Codes:

Original text written by user:
IsPrivate?No (this computation is public)
User-defined keywords
Estimated Impact75
Family? (F = Feedback message, R = changed R code, M = changed R Module, P = changed Parameters, D = changed Data)
-     [(Partial) Autocorrelation Function] [Autocorr eerste] [2016-12-07 13:39:31] [5f979cb1c6fa86b57093c7542788c28c]
- R  D    [(Partial) Autocorrelation Function] [skknfds] [2016-12-09 15:30:16] [4c05fa0998bf98e29c2e453b139976f4] [Current]
Feedback Forum

Post a new message
Dataseries X:
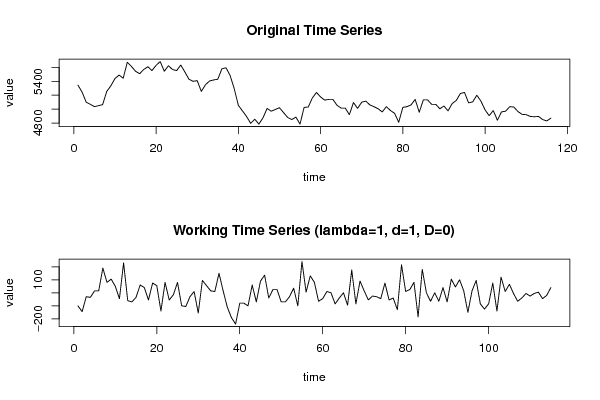
5345
5245
5100
5070
5035
5050
5065
5255
5335
5440
5490
5445
5675
5615
5545
5510
5570
5610
5555
5630
5685
5545
5625
5570
5555
5635
5535
5430
5400
5410
5255
5350
5405
5420
5430
5580
5595
5485
5295
5055
4975
4895
4795
4855
4785
4875
5010
4970
4995
5020
4950
4880
4850
4885
4785
5025
5030
5160
5240
5175
5130
5140
5140
5055
5015
5015
4920
5095
5010
5100
5115
5060
5035
5005
4960
5035
4980
4940
4810
5025
5035
5060
5140
4955
5135
5135
5070
5070
5005
5045
4975
5080
5125
5225
5240
5090
5105
5200
5115
4990
4905
4980
4840
4960
4970
5035
5030
4965
4925
4920
4895
4890
4895
4850
4830
4870


Summary of computational transaction
Raw Input view raw input (R code)
Raw Outputview raw output of R engine
Computing time1 seconds
R ServerBig Analytics Cloud Computing Center

\begin{tabular}{lllllllll}
\hline
Summary of computational transaction \tabularnewline
Raw Input view raw input (R code)  \tabularnewline
Raw Outputview raw output of R engine  \tabularnewline
Computing time1 seconds \tabularnewline
R ServerBig Analytics Cloud Computing Center \tabularnewline
\hline
\end{tabular}
%Source: https://freestatistics.org/blog/index.php?pk=298575&T=0

[TABLE]
[ROW]
Summary of computational transaction[/C][/ROW] [ROW]Raw Input[/C] view raw input (R code) [/C][/ROW] [ROW]Raw Output[/C]view raw output of R engine [/C][/ROW] [ROW]Computing time[/C]1 seconds[/C][/ROW] [ROW]R Server[/C]Big Analytics Cloud Computing Center[/C][/ROW] [/TABLE] Source: https://freestatistics.org/blog/index.php?pk=298575&T=0

Globally Unique Identifier (entire table): ba.freestatistics.org/blog/index.php?pk=298575&T=0

As an alternative you can also use a QR Code:  

The GUIDs for individual cells are displayed in the table below:

Summary of computational transaction
Raw Input view raw input (R code)
Raw Outputview raw output of R engine
Computing time1 seconds
R ServerBig Analytics Cloud Computing Center


Autocorrelation Function
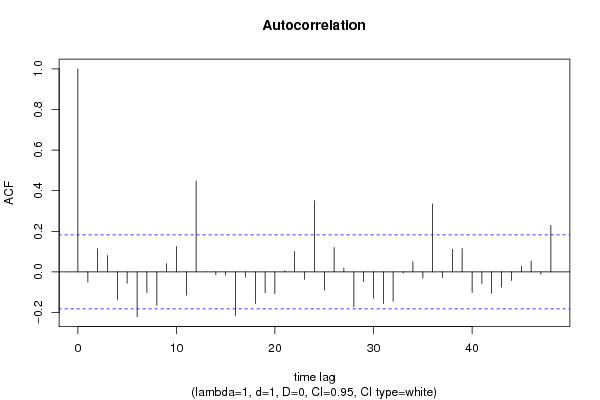
Time lag kACF(k)T-STATP-value
1-0.049832-0.53440.297052
20.114091.22350.111824
30.0808030.86650.194005
4-0.137071-1.46990.072156
5-0.056332-0.60410.273487
6-0.220534-2.3650.009853
7-0.101934-1.09310.138312
8-0.164297-1.76190.040372
90.0399490.42840.334578
100.1254071.34480.090662
11-0.114697-1.230.110606
120.4476964.8012e-06
130.0014750.01580.493704
14-0.013598-0.14580.442157
15-0.015962-0.17120.432194
16-0.214983-2.30540.011467
17-0.024883-0.26680.395036
18-0.155097-1.66320.049495
19-0.102266-1.09670.137535
20-0.106932-1.14670.12694
210.0060050.06440.474385
220.1003171.07580.142138
23-0.035962-0.38570.350232
240.3507893.76180.000134
25-0.090898-0.97480.165858
260.1204621.29180.099507
270.0195270.20940.41725
28-0.171875-1.84320.033941
29-0.04795-0.51420.304047
30-0.130127-1.39550.082784
31-0.155143-1.66370.049445
32-0.144421-1.54870.062096
33-0.005536-0.05940.47638
340.0495220.53110.2982
35-0.030734-0.32960.371157
360.3343263.58520.000248
37-0.02749-0.29480.384339
380.1116561.19740.116811
390.1148041.23110.110392
40-0.100919-1.08220.140706
41-0.05682-0.60930.271757
42-0.105513-1.13150.130099
43-0.075249-0.8070.210678
44-0.042826-0.45930.323456
450.0280030.30030.382244
460.0530240.56860.285361
47-0.011445-0.12270.451267
480.2293612.45960.007698

\begin{tabular}{lllllllll}
\hline
Autocorrelation Function \tabularnewline
Time lag k & ACF(k) & T-STAT & P-value \tabularnewline
1 & -0.049832 & -0.5344 & 0.297052 \tabularnewline
2 & 0.11409 & 1.2235 & 0.111824 \tabularnewline
3 & 0.080803 & 0.8665 & 0.194005 \tabularnewline
4 & -0.137071 & -1.4699 & 0.072156 \tabularnewline
5 & -0.056332 & -0.6041 & 0.273487 \tabularnewline
6 & -0.220534 & -2.365 & 0.009853 \tabularnewline
7 & -0.101934 & -1.0931 & 0.138312 \tabularnewline
8 & -0.164297 & -1.7619 & 0.040372 \tabularnewline
9 & 0.039949 & 0.4284 & 0.334578 \tabularnewline
10 & 0.125407 & 1.3448 & 0.090662 \tabularnewline
11 & -0.114697 & -1.23 & 0.110606 \tabularnewline
12 & 0.447696 & 4.801 & 2e-06 \tabularnewline
13 & 0.001475 & 0.0158 & 0.493704 \tabularnewline
14 & -0.013598 & -0.1458 & 0.442157 \tabularnewline
15 & -0.015962 & -0.1712 & 0.432194 \tabularnewline
16 & -0.214983 & -2.3054 & 0.011467 \tabularnewline
17 & -0.024883 & -0.2668 & 0.395036 \tabularnewline
18 & -0.155097 & -1.6632 & 0.049495 \tabularnewline
19 & -0.102266 & -1.0967 & 0.137535 \tabularnewline
20 & -0.106932 & -1.1467 & 0.12694 \tabularnewline
21 & 0.006005 & 0.0644 & 0.474385 \tabularnewline
22 & 0.100317 & 1.0758 & 0.142138 \tabularnewline
23 & -0.035962 & -0.3857 & 0.350232 \tabularnewline
24 & 0.350789 & 3.7618 & 0.000134 \tabularnewline
25 & -0.090898 & -0.9748 & 0.165858 \tabularnewline
26 & 0.120462 & 1.2918 & 0.099507 \tabularnewline
27 & 0.019527 & 0.2094 & 0.41725 \tabularnewline
28 & -0.171875 & -1.8432 & 0.033941 \tabularnewline
29 & -0.04795 & -0.5142 & 0.304047 \tabularnewline
30 & -0.130127 & -1.3955 & 0.082784 \tabularnewline
31 & -0.155143 & -1.6637 & 0.049445 \tabularnewline
32 & -0.144421 & -1.5487 & 0.062096 \tabularnewline
33 & -0.005536 & -0.0594 & 0.47638 \tabularnewline
34 & 0.049522 & 0.5311 & 0.2982 \tabularnewline
35 & -0.030734 & -0.3296 & 0.371157 \tabularnewline
36 & 0.334326 & 3.5852 & 0.000248 \tabularnewline
37 & -0.02749 & -0.2948 & 0.384339 \tabularnewline
38 & 0.111656 & 1.1974 & 0.116811 \tabularnewline
39 & 0.114804 & 1.2311 & 0.110392 \tabularnewline
40 & -0.100919 & -1.0822 & 0.140706 \tabularnewline
41 & -0.05682 & -0.6093 & 0.271757 \tabularnewline
42 & -0.105513 & -1.1315 & 0.130099 \tabularnewline
43 & -0.075249 & -0.807 & 0.210678 \tabularnewline
44 & -0.042826 & -0.4593 & 0.323456 \tabularnewline
45 & 0.028003 & 0.3003 & 0.382244 \tabularnewline
46 & 0.053024 & 0.5686 & 0.285361 \tabularnewline
47 & -0.011445 & -0.1227 & 0.451267 \tabularnewline
48 & 0.229361 & 2.4596 & 0.007698 \tabularnewline
\hline
\end{tabular}
%Source: https://freestatistics.org/blog/index.php?pk=298575&T=1

[TABLE]
[ROW][C]Autocorrelation Function[/C][/ROW]
[ROW][C]Time lag k[/C][C]ACF(k)[/C][C]T-STAT[/C][C]P-value[/C][/ROW]
[ROW][C]1[/C][C]-0.049832[/C][C]-0.5344[/C][C]0.297052[/C][/ROW]
[ROW][C]2[/C][C]0.11409[/C][C]1.2235[/C][C]0.111824[/C][/ROW]
[ROW][C]3[/C][C]0.080803[/C][C]0.8665[/C][C]0.194005[/C][/ROW]
[ROW][C]4[/C][C]-0.137071[/C][C]-1.4699[/C][C]0.072156[/C][/ROW]
[ROW][C]5[/C][C]-0.056332[/C][C]-0.6041[/C][C]0.273487[/C][/ROW]
[ROW][C]6[/C][C]-0.220534[/C][C]-2.365[/C][C]0.009853[/C][/ROW]
[ROW][C]7[/C][C]-0.101934[/C][C]-1.0931[/C][C]0.138312[/C][/ROW]
[ROW][C]8[/C][C]-0.164297[/C][C]-1.7619[/C][C]0.040372[/C][/ROW]
[ROW][C]9[/C][C]0.039949[/C][C]0.4284[/C][C]0.334578[/C][/ROW]
[ROW][C]10[/C][C]0.125407[/C][C]1.3448[/C][C]0.090662[/C][/ROW]
[ROW][C]11[/C][C]-0.114697[/C][C]-1.23[/C][C]0.110606[/C][/ROW]
[ROW][C]12[/C][C]0.447696[/C][C]4.801[/C][C]2e-06[/C][/ROW]
[ROW][C]13[/C][C]0.001475[/C][C]0.0158[/C][C]0.493704[/C][/ROW]
[ROW][C]14[/C][C]-0.013598[/C][C]-0.1458[/C][C]0.442157[/C][/ROW]
[ROW][C]15[/C][C]-0.015962[/C][C]-0.1712[/C][C]0.432194[/C][/ROW]
[ROW][C]16[/C][C]-0.214983[/C][C]-2.3054[/C][C]0.011467[/C][/ROW]
[ROW][C]17[/C][C]-0.024883[/C][C]-0.2668[/C][C]0.395036[/C][/ROW]
[ROW][C]18[/C][C]-0.155097[/C][C]-1.6632[/C][C]0.049495[/C][/ROW]
[ROW][C]19[/C][C]-0.102266[/C][C]-1.0967[/C][C]0.137535[/C][/ROW]
[ROW][C]20[/C][C]-0.106932[/C][C]-1.1467[/C][C]0.12694[/C][/ROW]
[ROW][C]21[/C][C]0.006005[/C][C]0.0644[/C][C]0.474385[/C][/ROW]
[ROW][C]22[/C][C]0.100317[/C][C]1.0758[/C][C]0.142138[/C][/ROW]
[ROW][C]23[/C][C]-0.035962[/C][C]-0.3857[/C][C]0.350232[/C][/ROW]
[ROW][C]24[/C][C]0.350789[/C][C]3.7618[/C][C]0.000134[/C][/ROW]
[ROW][C]25[/C][C]-0.090898[/C][C]-0.9748[/C][C]0.165858[/C][/ROW]
[ROW][C]26[/C][C]0.120462[/C][C]1.2918[/C][C]0.099507[/C][/ROW]
[ROW][C]27[/C][C]0.019527[/C][C]0.2094[/C][C]0.41725[/C][/ROW]
[ROW][C]28[/C][C]-0.171875[/C][C]-1.8432[/C][C]0.033941[/C][/ROW]
[ROW][C]29[/C][C]-0.04795[/C][C]-0.5142[/C][C]0.304047[/C][/ROW]
[ROW][C]30[/C][C]-0.130127[/C][C]-1.3955[/C][C]0.082784[/C][/ROW]
[ROW][C]31[/C][C]-0.155143[/C][C]-1.6637[/C][C]0.049445[/C][/ROW]
[ROW][C]32[/C][C]-0.144421[/C][C]-1.5487[/C][C]0.062096[/C][/ROW]
[ROW][C]33[/C][C]-0.005536[/C][C]-0.0594[/C][C]0.47638[/C][/ROW]
[ROW][C]34[/C][C]0.049522[/C][C]0.5311[/C][C]0.2982[/C][/ROW]
[ROW][C]35[/C][C]-0.030734[/C][C]-0.3296[/C][C]0.371157[/C][/ROW]
[ROW][C]36[/C][C]0.334326[/C][C]3.5852[/C][C]0.000248[/C][/ROW]
[ROW][C]37[/C][C]-0.02749[/C][C]-0.2948[/C][C]0.384339[/C][/ROW]
[ROW][C]38[/C][C]0.111656[/C][C]1.1974[/C][C]0.116811[/C][/ROW]
[ROW][C]39[/C][C]0.114804[/C][C]1.2311[/C][C]0.110392[/C][/ROW]
[ROW][C]40[/C][C]-0.100919[/C][C]-1.0822[/C][C]0.140706[/C][/ROW]
[ROW][C]41[/C][C]-0.05682[/C][C]-0.6093[/C][C]0.271757[/C][/ROW]
[ROW][C]42[/C][C]-0.105513[/C][C]-1.1315[/C][C]0.130099[/C][/ROW]
[ROW][C]43[/C][C]-0.075249[/C][C]-0.807[/C][C]0.210678[/C][/ROW]
[ROW][C]44[/C][C]-0.042826[/C][C]-0.4593[/C][C]0.323456[/C][/ROW]
[ROW][C]45[/C][C]0.028003[/C][C]0.3003[/C][C]0.382244[/C][/ROW]
[ROW][C]46[/C][C]0.053024[/C][C]0.5686[/C][C]0.285361[/C][/ROW]
[ROW][C]47[/C][C]-0.011445[/C][C]-0.1227[/C][C]0.451267[/C][/ROW]
[ROW][C]48[/C][C]0.229361[/C][C]2.4596[/C][C]0.007698[/C][/ROW]
[/TABLE]
Source: https://freestatistics.org/blog/index.php?pk=298575&T=1

Globally Unique Identifier (entire table): ba.freestatistics.org/blog/index.php?pk=298575&T=1

As an alternative you can also use a QR Code:  

The GUIDs for individual cells are displayed in the table below:

Autocorrelation Function
Time lag kACF(k)T-STATP-value
1-0.049832-0.53440.297052
20.114091.22350.111824
30.0808030.86650.194005
4-0.137071-1.46990.072156
5-0.056332-0.60410.273487
6-0.220534-2.3650.009853
7-0.101934-1.09310.138312
8-0.164297-1.76190.040372
90.0399490.42840.334578
100.1254071.34480.090662
11-0.114697-1.230.110606
120.4476964.8012e-06
130.0014750.01580.493704
14-0.013598-0.14580.442157
15-0.015962-0.17120.432194
16-0.214983-2.30540.011467
17-0.024883-0.26680.395036
18-0.155097-1.66320.049495
19-0.102266-1.09670.137535
20-0.106932-1.14670.12694
210.0060050.06440.474385
220.1003171.07580.142138
23-0.035962-0.38570.350232
240.3507893.76180.000134
25-0.090898-0.97480.165858
260.1204621.29180.099507
270.0195270.20940.41725
28-0.171875-1.84320.033941
29-0.04795-0.51420.304047
30-0.130127-1.39550.082784
31-0.155143-1.66370.049445
32-0.144421-1.54870.062096
33-0.005536-0.05940.47638
340.0495220.53110.2982
35-0.030734-0.32960.371157
360.3343263.58520.000248
37-0.02749-0.29480.384339
380.1116561.19740.116811
390.1148041.23110.110392
40-0.100919-1.08220.140706
41-0.05682-0.60930.271757
42-0.105513-1.13150.130099
43-0.075249-0.8070.210678
44-0.042826-0.45930.323456
450.0280030.30030.382244
460.0530240.56860.285361
47-0.011445-0.12270.451267
480.2293612.45960.007698


Partial Autocorrelation Function
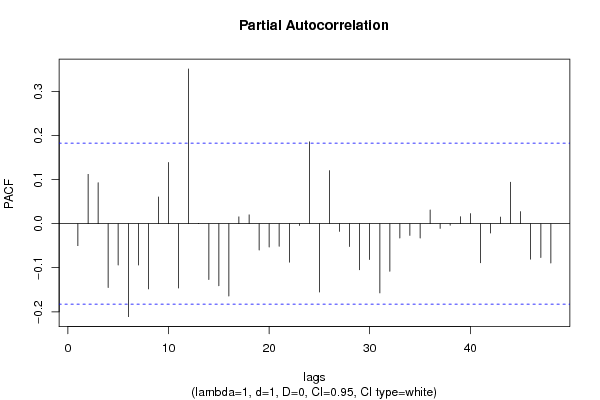
Time lag kPACF(k)T-STATP-value
1-0.049832-0.53440.297052
20.1118851.19980.116335
30.0928170.99540.160827
4-0.144658-1.55130.061791
5-0.093719-1.0050.158497
6-0.210952-2.26220.012782
7-0.093812-1.0060.158259
8-0.148018-1.58730.057593
90.0603470.64710.259414
100.1388831.48940.069565
11-0.146137-1.56710.059914
120.3509533.76360.000133
130.0004310.00460.49816
14-0.126743-1.35920.088377
15-0.140764-1.50950.066953
16-0.16421-1.7610.040452
170.0153680.16480.434693
180.020010.21460.415238
19-0.059843-0.64170.261158
20-0.052892-0.56720.28584
21-0.051259-0.54970.291797
22-0.087264-0.93580.175668
23-0.004346-0.04660.481453
240.1854991.98930.024524
25-0.154993-1.66210.049606
260.1203341.29040.099744
27-0.017488-0.18750.425785
28-0.05167-0.55410.290292
29-0.104415-1.11970.132582
30-0.081416-0.87310.192217
31-0.157095-1.68470.047383
32-0.108109-1.15930.12436
33-0.032701-0.35070.363235
34-0.026672-0.2860.387685
35-0.032402-0.34750.364434
360.0310220.33270.369993
37-0.010776-0.11560.454103
38-0.003774-0.04050.483895
390.0155850.16710.433781
400.0227050.24350.404034
41-0.088508-0.94910.17227
42-0.02132-0.22860.409779
430.0148680.15940.436802
440.0939041.0070.158022
450.0272610.29230.385278
46-0.080457-0.86280.195021
47-0.076858-0.82420.205765
48-0.089275-0.95740.170195

\begin{tabular}{lllllllll}
\hline
Partial Autocorrelation Function \tabularnewline
Time lag k & PACF(k) & T-STAT & P-value \tabularnewline
1 & -0.049832 & -0.5344 & 0.297052 \tabularnewline
2 & 0.111885 & 1.1998 & 0.116335 \tabularnewline
3 & 0.092817 & 0.9954 & 0.160827 \tabularnewline
4 & -0.144658 & -1.5513 & 0.061791 \tabularnewline
5 & -0.093719 & -1.005 & 0.158497 \tabularnewline
6 & -0.210952 & -2.2622 & 0.012782 \tabularnewline
7 & -0.093812 & -1.006 & 0.158259 \tabularnewline
8 & -0.148018 & -1.5873 & 0.057593 \tabularnewline
9 & 0.060347 & 0.6471 & 0.259414 \tabularnewline
10 & 0.138883 & 1.4894 & 0.069565 \tabularnewline
11 & -0.146137 & -1.5671 & 0.059914 \tabularnewline
12 & 0.350953 & 3.7636 & 0.000133 \tabularnewline
13 & 0.000431 & 0.0046 & 0.49816 \tabularnewline
14 & -0.126743 & -1.3592 & 0.088377 \tabularnewline
15 & -0.140764 & -1.5095 & 0.066953 \tabularnewline
16 & -0.16421 & -1.761 & 0.040452 \tabularnewline
17 & 0.015368 & 0.1648 & 0.434693 \tabularnewline
18 & 0.02001 & 0.2146 & 0.415238 \tabularnewline
19 & -0.059843 & -0.6417 & 0.261158 \tabularnewline
20 & -0.052892 & -0.5672 & 0.28584 \tabularnewline
21 & -0.051259 & -0.5497 & 0.291797 \tabularnewline
22 & -0.087264 & -0.9358 & 0.175668 \tabularnewline
23 & -0.004346 & -0.0466 & 0.481453 \tabularnewline
24 & 0.185499 & 1.9893 & 0.024524 \tabularnewline
25 & -0.154993 & -1.6621 & 0.049606 \tabularnewline
26 & 0.120334 & 1.2904 & 0.099744 \tabularnewline
27 & -0.017488 & -0.1875 & 0.425785 \tabularnewline
28 & -0.05167 & -0.5541 & 0.290292 \tabularnewline
29 & -0.104415 & -1.1197 & 0.132582 \tabularnewline
30 & -0.081416 & -0.8731 & 0.192217 \tabularnewline
31 & -0.157095 & -1.6847 & 0.047383 \tabularnewline
32 & -0.108109 & -1.1593 & 0.12436 \tabularnewline
33 & -0.032701 & -0.3507 & 0.363235 \tabularnewline
34 & -0.026672 & -0.286 & 0.387685 \tabularnewline
35 & -0.032402 & -0.3475 & 0.364434 \tabularnewline
36 & 0.031022 & 0.3327 & 0.369993 \tabularnewline
37 & -0.010776 & -0.1156 & 0.454103 \tabularnewline
38 & -0.003774 & -0.0405 & 0.483895 \tabularnewline
39 & 0.015585 & 0.1671 & 0.433781 \tabularnewline
40 & 0.022705 & 0.2435 & 0.404034 \tabularnewline
41 & -0.088508 & -0.9491 & 0.17227 \tabularnewline
42 & -0.02132 & -0.2286 & 0.409779 \tabularnewline
43 & 0.014868 & 0.1594 & 0.436802 \tabularnewline
44 & 0.093904 & 1.007 & 0.158022 \tabularnewline
45 & 0.027261 & 0.2923 & 0.385278 \tabularnewline
46 & -0.080457 & -0.8628 & 0.195021 \tabularnewline
47 & -0.076858 & -0.8242 & 0.205765 \tabularnewline
48 & -0.089275 & -0.9574 & 0.170195 \tabularnewline
\hline
\end{tabular}
%Source: https://freestatistics.org/blog/index.php?pk=298575&T=2

[TABLE]
[ROW][C]Partial Autocorrelation Function[/C][/ROW]
[ROW][C]Time lag k[/C][C]PACF(k)[/C][C]T-STAT[/C][C]P-value[/C][/ROW]
[ROW][C]1[/C][C]-0.049832[/C][C]-0.5344[/C][C]0.297052[/C][/ROW]
[ROW][C]2[/C][C]0.111885[/C][C]1.1998[/C][C]0.116335[/C][/ROW]
[ROW][C]3[/C][C]0.092817[/C][C]0.9954[/C][C]0.160827[/C][/ROW]
[ROW][C]4[/C][C]-0.144658[/C][C]-1.5513[/C][C]0.061791[/C][/ROW]
[ROW][C]5[/C][C]-0.093719[/C][C]-1.005[/C][C]0.158497[/C][/ROW]
[ROW][C]6[/C][C]-0.210952[/C][C]-2.2622[/C][C]0.012782[/C][/ROW]
[ROW][C]7[/C][C]-0.093812[/C][C]-1.006[/C][C]0.158259[/C][/ROW]
[ROW][C]8[/C][C]-0.148018[/C][C]-1.5873[/C][C]0.057593[/C][/ROW]
[ROW][C]9[/C][C]0.060347[/C][C]0.6471[/C][C]0.259414[/C][/ROW]
[ROW][C]10[/C][C]0.138883[/C][C]1.4894[/C][C]0.069565[/C][/ROW]
[ROW][C]11[/C][C]-0.146137[/C][C]-1.5671[/C][C]0.059914[/C][/ROW]
[ROW][C]12[/C][C]0.350953[/C][C]3.7636[/C][C]0.000133[/C][/ROW]
[ROW][C]13[/C][C]0.000431[/C][C]0.0046[/C][C]0.49816[/C][/ROW]
[ROW][C]14[/C][C]-0.126743[/C][C]-1.3592[/C][C]0.088377[/C][/ROW]
[ROW][C]15[/C][C]-0.140764[/C][C]-1.5095[/C][C]0.066953[/C][/ROW]
[ROW][C]16[/C][C]-0.16421[/C][C]-1.761[/C][C]0.040452[/C][/ROW]
[ROW][C]17[/C][C]0.015368[/C][C]0.1648[/C][C]0.434693[/C][/ROW]
[ROW][C]18[/C][C]0.02001[/C][C]0.2146[/C][C]0.415238[/C][/ROW]
[ROW][C]19[/C][C]-0.059843[/C][C]-0.6417[/C][C]0.261158[/C][/ROW]
[ROW][C]20[/C][C]-0.052892[/C][C]-0.5672[/C][C]0.28584[/C][/ROW]
[ROW][C]21[/C][C]-0.051259[/C][C]-0.5497[/C][C]0.291797[/C][/ROW]
[ROW][C]22[/C][C]-0.087264[/C][C]-0.9358[/C][C]0.175668[/C][/ROW]
[ROW][C]23[/C][C]-0.004346[/C][C]-0.0466[/C][C]0.481453[/C][/ROW]
[ROW][C]24[/C][C]0.185499[/C][C]1.9893[/C][C]0.024524[/C][/ROW]
[ROW][C]25[/C][C]-0.154993[/C][C]-1.6621[/C][C]0.049606[/C][/ROW]
[ROW][C]26[/C][C]0.120334[/C][C]1.2904[/C][C]0.099744[/C][/ROW]
[ROW][C]27[/C][C]-0.017488[/C][C]-0.1875[/C][C]0.425785[/C][/ROW]
[ROW][C]28[/C][C]-0.05167[/C][C]-0.5541[/C][C]0.290292[/C][/ROW]
[ROW][C]29[/C][C]-0.104415[/C][C]-1.1197[/C][C]0.132582[/C][/ROW]
[ROW][C]30[/C][C]-0.081416[/C][C]-0.8731[/C][C]0.192217[/C][/ROW]
[ROW][C]31[/C][C]-0.157095[/C][C]-1.6847[/C][C]0.047383[/C][/ROW]
[ROW][C]32[/C][C]-0.108109[/C][C]-1.1593[/C][C]0.12436[/C][/ROW]
[ROW][C]33[/C][C]-0.032701[/C][C]-0.3507[/C][C]0.363235[/C][/ROW]
[ROW][C]34[/C][C]-0.026672[/C][C]-0.286[/C][C]0.387685[/C][/ROW]
[ROW][C]35[/C][C]-0.032402[/C][C]-0.3475[/C][C]0.364434[/C][/ROW]
[ROW][C]36[/C][C]0.031022[/C][C]0.3327[/C][C]0.369993[/C][/ROW]
[ROW][C]37[/C][C]-0.010776[/C][C]-0.1156[/C][C]0.454103[/C][/ROW]
[ROW][C]38[/C][C]-0.003774[/C][C]-0.0405[/C][C]0.483895[/C][/ROW]
[ROW][C]39[/C][C]0.015585[/C][C]0.1671[/C][C]0.433781[/C][/ROW]
[ROW][C]40[/C][C]0.022705[/C][C]0.2435[/C][C]0.404034[/C][/ROW]
[ROW][C]41[/C][C]-0.088508[/C][C]-0.9491[/C][C]0.17227[/C][/ROW]
[ROW][C]42[/C][C]-0.02132[/C][C]-0.2286[/C][C]0.409779[/C][/ROW]
[ROW][C]43[/C][C]0.014868[/C][C]0.1594[/C][C]0.436802[/C][/ROW]
[ROW][C]44[/C][C]0.093904[/C][C]1.007[/C][C]0.158022[/C][/ROW]
[ROW][C]45[/C][C]0.027261[/C][C]0.2923[/C][C]0.385278[/C][/ROW]
[ROW][C]46[/C][C]-0.080457[/C][C]-0.8628[/C][C]0.195021[/C][/ROW]
[ROW][C]47[/C][C]-0.076858[/C][C]-0.8242[/C][C]0.205765[/C][/ROW]
[ROW][C]48[/C][C]-0.089275[/C][C]-0.9574[/C][C]0.170195[/C][/ROW]
[/TABLE]
Source: https://freestatistics.org/blog/index.php?pk=298575&T=2

Globally Unique Identifier (entire table): ba.freestatistics.org/blog/index.php?pk=298575&T=2

As an alternative you can also use a QR Code:  

The GUIDs for individual cells are displayed in the table below:

Partial Autocorrelation Function
Time lag kPACF(k)T-STATP-value
1-0.049832-0.53440.297052
20.1118851.19980.116335
30.0928170.99540.160827
4-0.144658-1.55130.061791
5-0.093719-1.0050.158497
6-0.210952-2.26220.012782
7-0.093812-1.0060.158259
8-0.148018-1.58730.057593
90.0603470.64710.259414
100.1388831.48940.069565
11-0.146137-1.56710.059914
120.3509533.76360.000133
130.0004310.00460.49816
14-0.126743-1.35920.088377
15-0.140764-1.50950.066953
16-0.16421-1.7610.040452
170.0153680.16480.434693
180.020010.21460.415238
19-0.059843-0.64170.261158
20-0.052892-0.56720.28584
21-0.051259-0.54970.291797
22-0.087264-0.93580.175668
23-0.004346-0.04660.481453
240.1854991.98930.024524
25-0.154993-1.66210.049606
260.1203341.29040.099744
27-0.017488-0.18750.425785
28-0.05167-0.55410.290292
29-0.104415-1.11970.132582
30-0.081416-0.87310.192217
31-0.157095-1.68470.047383
32-0.108109-1.15930.12436
33-0.032701-0.35070.363235
34-0.026672-0.2860.387685
35-0.032402-0.34750.364434
360.0310220.33270.369993
37-0.010776-0.11560.454103
38-0.003774-0.04050.483895
390.0155850.16710.433781
400.0227050.24350.404034
41-0.088508-0.94910.17227
42-0.02132-0.22860.409779
430.0148680.15940.436802
440.0939041.0070.158022
450.0272610.29230.385278
46-0.080457-0.86280.195021
47-0.076858-0.82420.205765
48-0.089275-0.95740.170195


Parameters (Session):
par1 = Default ; par2 = 1 ; par3 = 1 ; par4 = 1 ; par5 = 4 ; par6 = White Noise ; par7 = 0.95 ;
Parameters (R input):
par1 = 48 ; par2 = 1 ; par3 = 1 ; par4 = 0 ; par5 = 12 ; par6 = White Noise ; par7 = 0.95 ; par8 = ;
R code (references can be found in the software module):
par8 <- ''
par7 <- '0.95'
par6 <- 'White Noise'
par5 <- '12'
par4 <- '0'
par3 <- '0'
par2 <- '1'
par1 <- '48'
if (par1 == 'Default') {
par1 = 10*log10(length(x))
} else {
par1 <- as.numeric(par1)
}
par2 <- as.numeric(par2)
par3 <- as.numeric(par3)
par4 <- as.numeric(par4)
par5 <- as.numeric(par5)
if (par6 == 'White Noise') par6 <- 'white' else par6 <- 'ma'
par7 <- as.numeric(par7)
if (par8 != '') par8 <- as.numeric(par8)
x <- na.omit(x)
ox <- x
if (par8 == '') {
if (par2 == 0) {
x <- log(x)
} else {
x <- (x ^ par2 - 1) / par2
}
} else {
x <- log(x,base=par8)
}
if (par3 > 0) x <- diff(x,lag=1,difference=par3)
if (par4 > 0) x <- diff(x,lag=par5,difference=par4)
bitmap(file='picts.png')
op <- par(mfrow=c(2,1))
plot(ox,type='l',main='Original Time Series',xlab='time',ylab='value')
if (par8=='') {
mytitle <- paste('Working Time Series (lambda=',par2,', d=',par3,', D=',par4,')',sep='')
mysub <- paste('(lambda=',par2,', d=',par3,', D=',par4,', CI=', par7, ', CI type=',par6,')',sep='')
} else {
mytitle <- paste('Working Time Series (base=',par8,', d=',par3,', D=',par4,')',sep='')
mysub <- paste('(base=',par8,', d=',par3,', D=',par4,', CI=', par7, ', CI type=',par6,')',sep='')
}
plot(x,type='l', main=mytitle,xlab='time',ylab='value')
par(op)
dev.off()
bitmap(file='pic1.png')
racf <- acf(x, par1, main='Autocorrelation', xlab='time lag', ylab='ACF', ci.type=par6, ci=par7, sub=mysub)
dev.off()
bitmap(file='pic2.png')
rpacf <- pacf(x,par1,main='Partial Autocorrelation',xlab='lags',ylab='PACF',sub=mysub)
dev.off()
(myacf <- c(racf$acf))
(mypacf <- c(rpacf$acf))
lengthx <- length(x)
sqrtn <- sqrt(lengthx)
load(file='createtable')
a<-table.start()
a<-table.row.start(a)
a<-table.element(a,'Autocorrelation Function',4,TRUE)
a<-table.row.end(a)
a<-table.row.start(a)
a<-table.element(a,'Time lag k',header=TRUE)
a<-table.element(a,'ACF(k)',header=TRUE)
a<-table.element(a,'T-STAT',header=TRUE)
a<-table.element(a,'P-value',header=TRUE)
a<-table.row.end(a)
for (i in 2:(par1+1)) {
a<-table.row.start(a)
a<-table.element(a,i-1,header=TRUE)
a<-table.element(a,round(myacf[i],6))
mytstat <- myacf[i]*sqrtn
a<-table.element(a,round(mytstat,4))
a<-table.element(a,round(1-pt(abs(mytstat),lengthx),6))
a<-table.row.end(a)
}
a<-table.end(a)
table.save(a,file='mytable.tab')
a<-table.start()
a<-table.row.start(a)
a<-table.element(a,'Partial Autocorrelation Function',4,TRUE)
a<-table.row.end(a)
a<-table.row.start(a)
a<-table.element(a,'Time lag k',header=TRUE)
a<-table.element(a,'PACF(k)',header=TRUE)
a<-table.element(a,'T-STAT',header=TRUE)
a<-table.element(a,'P-value',header=TRUE)
a<-table.row.end(a)
for (i in 1:par1) {
a<-table.row.start(a)
a<-table.element(a,i,header=TRUE)
a<-table.element(a,round(mypacf[i],6))
mytstat <- mypacf[i]*sqrtn
a<-table.element(a,round(mytstat,4))
a<-table.element(a,round(1-pt(abs(mytstat),lengthx),6))
a<-table.row.end(a)
}
a<-table.end(a)
table.save(a,file='mytable1.tab')