Free Statistics

of Irreproducible Research!

Author's title

Author*The author of this computation has been verified*
R Software Modulerwasp_autocorrelation.wasp
Title produced by software(Partial) Autocorrelation Function
Date of computationFri, 09 Dec 2016 16:04:55 +0100
Cite this page as followsStatistical Computations at FreeStatistics.org, Office for Research Development and Education, URL https://freestatistics.org/blog/index.php?v=date/2016/Dec/09/t1481295934a1pda3i6xp6yqoo.htm/, Retrieved Sat, 18 May 2024 07:47:03 +0000
Statistical Computations at FreeStatistics.org, Office for Research Development and Education, URL https://freestatistics.org/blog/index.php?pk=298571, Retrieved Sat, 18 May 2024 07:47:03 +0000
QR Codes:

Original text written by user:
IsPrivate?No (this computation is public)
User-defined keywords
Estimated Impact75
Family? (F = Feedback message, R = changed R code, M = changed R Module, P = changed Parameters, D = changed Data)
-     [(Partial) Autocorrelation Function] [Autocorr eerste] [2016-12-07 13:39:31] [5f979cb1c6fa86b57093c7542788c28c]
- R  D    [(Partial) Autocorrelation Function] [kkeef] [2016-12-09 15:04:55] [4c05fa0998bf98e29c2e453b139976f4] [Current]
Feedback Forum

Post a new message
Dataseries X:
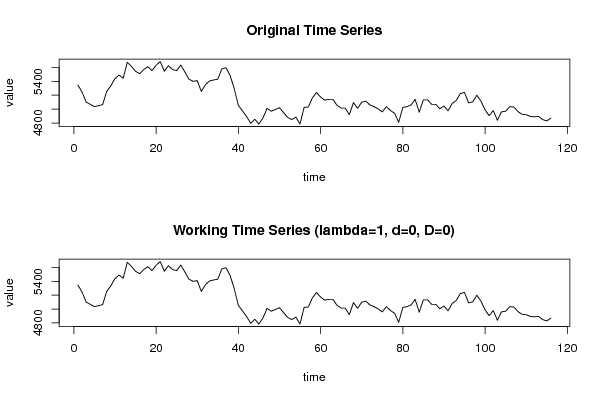
5345
5245
5100
5070
5035
5050
5065
5255
5335
5440
5490
5445
5675
5615
5545
5510
5570
5610
5555
5630
5685
5545
5625
5570
5555
5635
5535
5430
5400
5410
5255
5350
5405
5420
5430
5580
5595
5485
5295
5055
4975
4895
4795
4855
4785
4875
5010
4970
4995
5020
4950
4880
4850
4885
4785
5025
5030
5160
5240
5175
5130
5140
5140
5055
5015
5015
4920
5095
5010
5100
5115
5060
5035
5005
4960
5035
4980
4940
4810
5025
5035
5060
5140
4955
5135
5135
5070
5070
5005
5045
4975
5080
5125
5225
5240
5090
5105
5200
5115
4990
4905
4980
4840
4960
4970
5035
5030
4965
4925
4920
4895
4890
4895
4850
4830
4870


Summary of computational transaction
Raw Input view raw input (R code)
Raw Outputview raw output of R engine
Computing time1 seconds
R ServerBig Analytics Cloud Computing Center

\begin{tabular}{lllllllll}
\hline
Summary of computational transaction \tabularnewline
Raw Input view raw input (R code)  \tabularnewline
Raw Outputview raw output of R engine  \tabularnewline
Computing time1 seconds \tabularnewline
R ServerBig Analytics Cloud Computing Center \tabularnewline
\hline
\end{tabular}
%Source: https://freestatistics.org/blog/index.php?pk=298571&T=0

[TABLE]
[ROW]
Summary of computational transaction[/C][/ROW] [ROW]Raw Input[/C] view raw input (R code) [/C][/ROW] [ROW]Raw Output[/C]view raw output of R engine [/C][/ROW] [ROW]Computing time[/C]1 seconds[/C][/ROW] [ROW]R Server[/C]Big Analytics Cloud Computing Center[/C][/ROW] [/TABLE] Source: https://freestatistics.org/blog/index.php?pk=298571&T=0

Globally Unique Identifier (entire table): ba.freestatistics.org/blog/index.php?pk=298571&T=0

As an alternative you can also use a QR Code:  

The GUIDs for individual cells are displayed in the table below:

Summary of computational transaction
Raw Input view raw input (R code)
Raw Outputview raw output of R engine
Computing time1 seconds
R ServerBig Analytics Cloud Computing Center


Autocorrelation Function
Time lag kACF(k)T-STATP-value
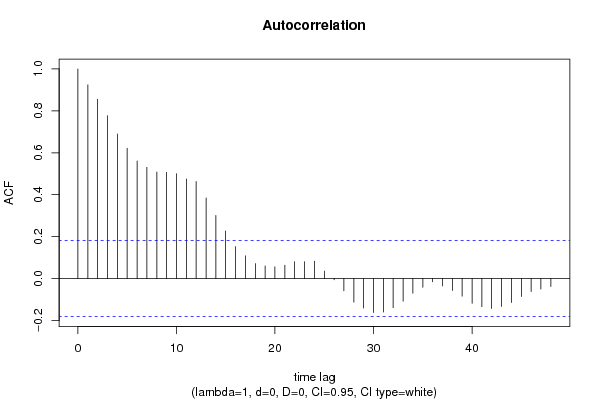
10.9240529.95230
20.8558189.21740
30.7769768.36830
40.6897877.42920
50.6217826.69680
60.5610416.04260
70.5305155.71380
80.5083095.47470
90.5073445.46430
100.5003425.38880
110.4749095.11491e-06
120.4633064.991e-06
130.3839224.1353.4e-05
140.300743.23910.000782
150.2266312.44090.008081
160.1522641.63990.051864
170.1082041.16540.123126
180.0710370.76510.222887
190.0595050.64090.261431
200.0554570.59730.27574
210.0632560.68130.248523
220.0800170.86180.195285
230.0800760.86250.19511
240.0822190.88550.188853
250.0353360.38060.352105
26-0.006235-0.06710.473289
27-0.05875-0.63280.264069
28-0.112832-1.21520.113371
29-0.140541-1.51370.066415
30-0.162342-1.74850.041514
31-0.159718-1.72020.04403
32-0.139083-1.4980.068428
33-0.108108-1.16440.123335
34-0.06964-0.750.227373
35-0.041649-0.44860.327288
36-0.0152-0.16370.435121
37-0.035094-0.3780.353072
38-0.057265-0.61680.269302
39-0.084171-0.90650.183262
40-0.118259-1.27370.10266
41-0.134315-1.44660.07535
42-0.143502-1.54560.062467
43-0.133784-1.44090.076154
44-0.114422-1.23240.110152
45-0.086233-0.92880.177471
46-0.062146-0.66930.252308
47-0.049715-0.53550.296681
48-0.038305-0.41260.340348

\begin{tabular}{lllllllll}
\hline
Autocorrelation Function \tabularnewline
Time lag k & ACF(k) & T-STAT & P-value \tabularnewline
1 & 0.924052 & 9.9523 & 0 \tabularnewline
2 & 0.855818 & 9.2174 & 0 \tabularnewline
3 & 0.776976 & 8.3683 & 0 \tabularnewline
4 & 0.689787 & 7.4292 & 0 \tabularnewline
5 & 0.621782 & 6.6968 & 0 \tabularnewline
6 & 0.561041 & 6.0426 & 0 \tabularnewline
7 & 0.530515 & 5.7138 & 0 \tabularnewline
8 & 0.508309 & 5.4747 & 0 \tabularnewline
9 & 0.507344 & 5.4643 & 0 \tabularnewline
10 & 0.500342 & 5.3888 & 0 \tabularnewline
11 & 0.474909 & 5.1149 & 1e-06 \tabularnewline
12 & 0.463306 & 4.99 & 1e-06 \tabularnewline
13 & 0.383922 & 4.135 & 3.4e-05 \tabularnewline
14 & 0.30074 & 3.2391 & 0.000782 \tabularnewline
15 & 0.226631 & 2.4409 & 0.008081 \tabularnewline
16 & 0.152264 & 1.6399 & 0.051864 \tabularnewline
17 & 0.108204 & 1.1654 & 0.123126 \tabularnewline
18 & 0.071037 & 0.7651 & 0.222887 \tabularnewline
19 & 0.059505 & 0.6409 & 0.261431 \tabularnewline
20 & 0.055457 & 0.5973 & 0.27574 \tabularnewline
21 & 0.063256 & 0.6813 & 0.248523 \tabularnewline
22 & 0.080017 & 0.8618 & 0.195285 \tabularnewline
23 & 0.080076 & 0.8625 & 0.19511 \tabularnewline
24 & 0.082219 & 0.8855 & 0.188853 \tabularnewline
25 & 0.035336 & 0.3806 & 0.352105 \tabularnewline
26 & -0.006235 & -0.0671 & 0.473289 \tabularnewline
27 & -0.05875 & -0.6328 & 0.264069 \tabularnewline
28 & -0.112832 & -1.2152 & 0.113371 \tabularnewline
29 & -0.140541 & -1.5137 & 0.066415 \tabularnewline
30 & -0.162342 & -1.7485 & 0.041514 \tabularnewline
31 & -0.159718 & -1.7202 & 0.04403 \tabularnewline
32 & -0.139083 & -1.498 & 0.068428 \tabularnewline
33 & -0.108108 & -1.1644 & 0.123335 \tabularnewline
34 & -0.06964 & -0.75 & 0.227373 \tabularnewline
35 & -0.041649 & -0.4486 & 0.327288 \tabularnewline
36 & -0.0152 & -0.1637 & 0.435121 \tabularnewline
37 & -0.035094 & -0.378 & 0.353072 \tabularnewline
38 & -0.057265 & -0.6168 & 0.269302 \tabularnewline
39 & -0.084171 & -0.9065 & 0.183262 \tabularnewline
40 & -0.118259 & -1.2737 & 0.10266 \tabularnewline
41 & -0.134315 & -1.4466 & 0.07535 \tabularnewline
42 & -0.143502 & -1.5456 & 0.062467 \tabularnewline
43 & -0.133784 & -1.4409 & 0.076154 \tabularnewline
44 & -0.114422 & -1.2324 & 0.110152 \tabularnewline
45 & -0.086233 & -0.9288 & 0.177471 \tabularnewline
46 & -0.062146 & -0.6693 & 0.252308 \tabularnewline
47 & -0.049715 & -0.5355 & 0.296681 \tabularnewline
48 & -0.038305 & -0.4126 & 0.340348 \tabularnewline
\hline
\end{tabular}
%Source: https://freestatistics.org/blog/index.php?pk=298571&T=1

[TABLE]
[ROW][C]Autocorrelation Function[/C][/ROW]
[ROW][C]Time lag k[/C][C]ACF(k)[/C][C]T-STAT[/C][C]P-value[/C][/ROW]
[ROW][C]1[/C][C]0.924052[/C][C]9.9523[/C][C]0[/C][/ROW]
[ROW][C]2[/C][C]0.855818[/C][C]9.2174[/C][C]0[/C][/ROW]
[ROW][C]3[/C][C]0.776976[/C][C]8.3683[/C][C]0[/C][/ROW]
[ROW][C]4[/C][C]0.689787[/C][C]7.4292[/C][C]0[/C][/ROW]
[ROW][C]5[/C][C]0.621782[/C][C]6.6968[/C][C]0[/C][/ROW]
[ROW][C]6[/C][C]0.561041[/C][C]6.0426[/C][C]0[/C][/ROW]
[ROW][C]7[/C][C]0.530515[/C][C]5.7138[/C][C]0[/C][/ROW]
[ROW][C]8[/C][C]0.508309[/C][C]5.4747[/C][C]0[/C][/ROW]
[ROW][C]9[/C][C]0.507344[/C][C]5.4643[/C][C]0[/C][/ROW]
[ROW][C]10[/C][C]0.500342[/C][C]5.3888[/C][C]0[/C][/ROW]
[ROW][C]11[/C][C]0.474909[/C][C]5.1149[/C][C]1e-06[/C][/ROW]
[ROW][C]12[/C][C]0.463306[/C][C]4.99[/C][C]1e-06[/C][/ROW]
[ROW][C]13[/C][C]0.383922[/C][C]4.135[/C][C]3.4e-05[/C][/ROW]
[ROW][C]14[/C][C]0.30074[/C][C]3.2391[/C][C]0.000782[/C][/ROW]
[ROW][C]15[/C][C]0.226631[/C][C]2.4409[/C][C]0.008081[/C][/ROW]
[ROW][C]16[/C][C]0.152264[/C][C]1.6399[/C][C]0.051864[/C][/ROW]
[ROW][C]17[/C][C]0.108204[/C][C]1.1654[/C][C]0.123126[/C][/ROW]
[ROW][C]18[/C][C]0.071037[/C][C]0.7651[/C][C]0.222887[/C][/ROW]
[ROW][C]19[/C][C]0.059505[/C][C]0.6409[/C][C]0.261431[/C][/ROW]
[ROW][C]20[/C][C]0.055457[/C][C]0.5973[/C][C]0.27574[/C][/ROW]
[ROW][C]21[/C][C]0.063256[/C][C]0.6813[/C][C]0.248523[/C][/ROW]
[ROW][C]22[/C][C]0.080017[/C][C]0.8618[/C][C]0.195285[/C][/ROW]
[ROW][C]23[/C][C]0.080076[/C][C]0.8625[/C][C]0.19511[/C][/ROW]
[ROW][C]24[/C][C]0.082219[/C][C]0.8855[/C][C]0.188853[/C][/ROW]
[ROW][C]25[/C][C]0.035336[/C][C]0.3806[/C][C]0.352105[/C][/ROW]
[ROW][C]26[/C][C]-0.006235[/C][C]-0.0671[/C][C]0.473289[/C][/ROW]
[ROW][C]27[/C][C]-0.05875[/C][C]-0.6328[/C][C]0.264069[/C][/ROW]
[ROW][C]28[/C][C]-0.112832[/C][C]-1.2152[/C][C]0.113371[/C][/ROW]
[ROW][C]29[/C][C]-0.140541[/C][C]-1.5137[/C][C]0.066415[/C][/ROW]
[ROW][C]30[/C][C]-0.162342[/C][C]-1.7485[/C][C]0.041514[/C][/ROW]
[ROW][C]31[/C][C]-0.159718[/C][C]-1.7202[/C][C]0.04403[/C][/ROW]
[ROW][C]32[/C][C]-0.139083[/C][C]-1.498[/C][C]0.068428[/C][/ROW]
[ROW][C]33[/C][C]-0.108108[/C][C]-1.1644[/C][C]0.123335[/C][/ROW]
[ROW][C]34[/C][C]-0.06964[/C][C]-0.75[/C][C]0.227373[/C][/ROW]
[ROW][C]35[/C][C]-0.041649[/C][C]-0.4486[/C][C]0.327288[/C][/ROW]
[ROW][C]36[/C][C]-0.0152[/C][C]-0.1637[/C][C]0.435121[/C][/ROW]
[ROW][C]37[/C][C]-0.035094[/C][C]-0.378[/C][C]0.353072[/C][/ROW]
[ROW][C]38[/C][C]-0.057265[/C][C]-0.6168[/C][C]0.269302[/C][/ROW]
[ROW][C]39[/C][C]-0.084171[/C][C]-0.9065[/C][C]0.183262[/C][/ROW]
[ROW][C]40[/C][C]-0.118259[/C][C]-1.2737[/C][C]0.10266[/C][/ROW]
[ROW][C]41[/C][C]-0.134315[/C][C]-1.4466[/C][C]0.07535[/C][/ROW]
[ROW][C]42[/C][C]-0.143502[/C][C]-1.5456[/C][C]0.062467[/C][/ROW]
[ROW][C]43[/C][C]-0.133784[/C][C]-1.4409[/C][C]0.076154[/C][/ROW]
[ROW][C]44[/C][C]-0.114422[/C][C]-1.2324[/C][C]0.110152[/C][/ROW]
[ROW][C]45[/C][C]-0.086233[/C][C]-0.9288[/C][C]0.177471[/C][/ROW]
[ROW][C]46[/C][C]-0.062146[/C][C]-0.6693[/C][C]0.252308[/C][/ROW]
[ROW][C]47[/C][C]-0.049715[/C][C]-0.5355[/C][C]0.296681[/C][/ROW]
[ROW][C]48[/C][C]-0.038305[/C][C]-0.4126[/C][C]0.340348[/C][/ROW]
[/TABLE]
Source: https://freestatistics.org/blog/index.php?pk=298571&T=1

Globally Unique Identifier (entire table): ba.freestatistics.org/blog/index.php?pk=298571&T=1

As an alternative you can also use a QR Code:  

The GUIDs for individual cells are displayed in the table below:

Autocorrelation Function
Time lag kACF(k)T-STATP-value
10.9240529.95230
20.8558189.21740
30.7769768.36830
40.6897877.42920
50.6217826.69680
60.5610416.04260
70.5305155.71380
80.5083095.47470
90.5073445.46430
100.5003425.38880
110.4749095.11491e-06
120.4633064.991e-06
130.3839224.1353.4e-05
140.300743.23910.000782
150.2266312.44090.008081
160.1522641.63990.051864
170.1082041.16540.123126
180.0710370.76510.222887
190.0595050.64090.261431
200.0554570.59730.27574
210.0632560.68130.248523
220.0800170.86180.195285
230.0800760.86250.19511
240.0822190.88550.188853
250.0353360.38060.352105
26-0.006235-0.06710.473289
27-0.05875-0.63280.264069
28-0.112832-1.21520.113371
29-0.140541-1.51370.066415
30-0.162342-1.74850.041514
31-0.159718-1.72020.04403
32-0.139083-1.4980.068428
33-0.108108-1.16440.123335
34-0.06964-0.750.227373
35-0.041649-0.44860.327288
36-0.0152-0.16370.435121
37-0.035094-0.3780.353072
38-0.057265-0.61680.269302
39-0.084171-0.90650.183262
40-0.118259-1.27370.10266
41-0.134315-1.44660.07535
42-0.143502-1.54560.062467
43-0.133784-1.44090.076154
44-0.114422-1.23240.110152
45-0.086233-0.92880.177471
46-0.062146-0.66930.252308
47-0.049715-0.53550.296681
48-0.038305-0.41260.340348


Partial Autocorrelation Function
Time lag kPACF(k)T-STATP-value
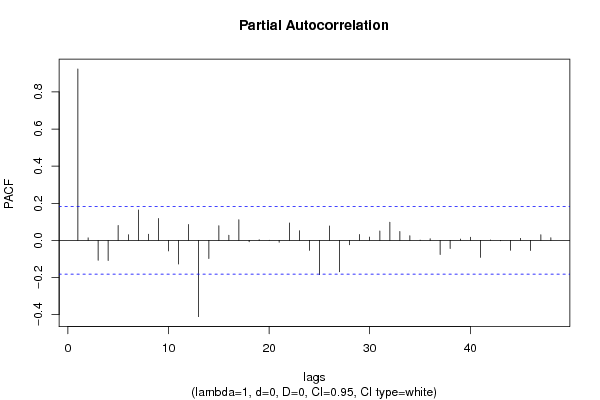
10.9240529.95230
20.0133160.14340.443105
3-0.106893-1.15130.125993
4-0.109075-1.17480.121246
50.0805960.8680.193582
60.0302820.32610.37245
70.1639771.76610.040006
80.0329210.35460.361779
90.1179971.27090.10316
10-0.056809-0.61180.270917
11-0.127672-1.37510.085881
120.0857590.92370.178791
13-0.411283-4.42971.1e-05
14-0.097555-1.05070.14779
150.0787440.84810.199064
160.0280690.30230.381477
170.1110861.19640.116985
18-0.007476-0.08050.467983
190.003390.03650.485469
20-0.000677-0.00730.497096
21-0.010438-0.11240.455344
220.0938751.01110.157044
230.0519590.55960.28841
24-0.054102-0.58270.280614
25-0.184622-1.98840.024559
260.0771760.83120.203781
27-0.169717-1.82790.035067
28-0.024057-0.25910.39801
290.0318320.34280.366168
300.0175430.18890.425232
310.0508560.54770.292464
320.098011.05560.146673
330.0475180.51180.304886
340.0251020.27040.393682
35-0.000739-0.0080.496829
360.0086640.09330.462907
37-0.075857-0.8170.2078
38-0.043744-0.47110.319212
390.0067780.0730.470965
400.0170440.18360.427337
41-0.091915-0.990.162128
420.0013590.01460.494171
43-0.001997-0.02150.491439
44-0.053608-0.57740.282403
450.0108410.11680.453624
46-0.05435-0.58540.279721
470.0305780.32930.371249
480.0142970.1540.438946

\begin{tabular}{lllllllll}
\hline
Partial Autocorrelation Function \tabularnewline
Time lag k & PACF(k) & T-STAT & P-value \tabularnewline
1 & 0.924052 & 9.9523 & 0 \tabularnewline
2 & 0.013316 & 0.1434 & 0.443105 \tabularnewline
3 & -0.106893 & -1.1513 & 0.125993 \tabularnewline
4 & -0.109075 & -1.1748 & 0.121246 \tabularnewline
5 & 0.080596 & 0.868 & 0.193582 \tabularnewline
6 & 0.030282 & 0.3261 & 0.37245 \tabularnewline
7 & 0.163977 & 1.7661 & 0.040006 \tabularnewline
8 & 0.032921 & 0.3546 & 0.361779 \tabularnewline
9 & 0.117997 & 1.2709 & 0.10316 \tabularnewline
10 & -0.056809 & -0.6118 & 0.270917 \tabularnewline
11 & -0.127672 & -1.3751 & 0.085881 \tabularnewline
12 & 0.085759 & 0.9237 & 0.178791 \tabularnewline
13 & -0.411283 & -4.4297 & 1.1e-05 \tabularnewline
14 & -0.097555 & -1.0507 & 0.14779 \tabularnewline
15 & 0.078744 & 0.8481 & 0.199064 \tabularnewline
16 & 0.028069 & 0.3023 & 0.381477 \tabularnewline
17 & 0.111086 & 1.1964 & 0.116985 \tabularnewline
18 & -0.007476 & -0.0805 & 0.467983 \tabularnewline
19 & 0.00339 & 0.0365 & 0.485469 \tabularnewline
20 & -0.000677 & -0.0073 & 0.497096 \tabularnewline
21 & -0.010438 & -0.1124 & 0.455344 \tabularnewline
22 & 0.093875 & 1.0111 & 0.157044 \tabularnewline
23 & 0.051959 & 0.5596 & 0.28841 \tabularnewline
24 & -0.054102 & -0.5827 & 0.280614 \tabularnewline
25 & -0.184622 & -1.9884 & 0.024559 \tabularnewline
26 & 0.077176 & 0.8312 & 0.203781 \tabularnewline
27 & -0.169717 & -1.8279 & 0.035067 \tabularnewline
28 & -0.024057 & -0.2591 & 0.39801 \tabularnewline
29 & 0.031832 & 0.3428 & 0.366168 \tabularnewline
30 & 0.017543 & 0.1889 & 0.425232 \tabularnewline
31 & 0.050856 & 0.5477 & 0.292464 \tabularnewline
32 & 0.09801 & 1.0556 & 0.146673 \tabularnewline
33 & 0.047518 & 0.5118 & 0.304886 \tabularnewline
34 & 0.025102 & 0.2704 & 0.393682 \tabularnewline
35 & -0.000739 & -0.008 & 0.496829 \tabularnewline
36 & 0.008664 & 0.0933 & 0.462907 \tabularnewline
37 & -0.075857 & -0.817 & 0.2078 \tabularnewline
38 & -0.043744 & -0.4711 & 0.319212 \tabularnewline
39 & 0.006778 & 0.073 & 0.470965 \tabularnewline
40 & 0.017044 & 0.1836 & 0.427337 \tabularnewline
41 & -0.091915 & -0.99 & 0.162128 \tabularnewline
42 & 0.001359 & 0.0146 & 0.494171 \tabularnewline
43 & -0.001997 & -0.0215 & 0.491439 \tabularnewline
44 & -0.053608 & -0.5774 & 0.282403 \tabularnewline
45 & 0.010841 & 0.1168 & 0.453624 \tabularnewline
46 & -0.05435 & -0.5854 & 0.279721 \tabularnewline
47 & 0.030578 & 0.3293 & 0.371249 \tabularnewline
48 & 0.014297 & 0.154 & 0.438946 \tabularnewline
\hline
\end{tabular}
%Source: https://freestatistics.org/blog/index.php?pk=298571&T=2

[TABLE]
[ROW][C]Partial Autocorrelation Function[/C][/ROW]
[ROW][C]Time lag k[/C][C]PACF(k)[/C][C]T-STAT[/C][C]P-value[/C][/ROW]
[ROW][C]1[/C][C]0.924052[/C][C]9.9523[/C][C]0[/C][/ROW]
[ROW][C]2[/C][C]0.013316[/C][C]0.1434[/C][C]0.443105[/C][/ROW]
[ROW][C]3[/C][C]-0.106893[/C][C]-1.1513[/C][C]0.125993[/C][/ROW]
[ROW][C]4[/C][C]-0.109075[/C][C]-1.1748[/C][C]0.121246[/C][/ROW]
[ROW][C]5[/C][C]0.080596[/C][C]0.868[/C][C]0.193582[/C][/ROW]
[ROW][C]6[/C][C]0.030282[/C][C]0.3261[/C][C]0.37245[/C][/ROW]
[ROW][C]7[/C][C]0.163977[/C][C]1.7661[/C][C]0.040006[/C][/ROW]
[ROW][C]8[/C][C]0.032921[/C][C]0.3546[/C][C]0.361779[/C][/ROW]
[ROW][C]9[/C][C]0.117997[/C][C]1.2709[/C][C]0.10316[/C][/ROW]
[ROW][C]10[/C][C]-0.056809[/C][C]-0.6118[/C][C]0.270917[/C][/ROW]
[ROW][C]11[/C][C]-0.127672[/C][C]-1.3751[/C][C]0.085881[/C][/ROW]
[ROW][C]12[/C][C]0.085759[/C][C]0.9237[/C][C]0.178791[/C][/ROW]
[ROW][C]13[/C][C]-0.411283[/C][C]-4.4297[/C][C]1.1e-05[/C][/ROW]
[ROW][C]14[/C][C]-0.097555[/C][C]-1.0507[/C][C]0.14779[/C][/ROW]
[ROW][C]15[/C][C]0.078744[/C][C]0.8481[/C][C]0.199064[/C][/ROW]
[ROW][C]16[/C][C]0.028069[/C][C]0.3023[/C][C]0.381477[/C][/ROW]
[ROW][C]17[/C][C]0.111086[/C][C]1.1964[/C][C]0.116985[/C][/ROW]
[ROW][C]18[/C][C]-0.007476[/C][C]-0.0805[/C][C]0.467983[/C][/ROW]
[ROW][C]19[/C][C]0.00339[/C][C]0.0365[/C][C]0.485469[/C][/ROW]
[ROW][C]20[/C][C]-0.000677[/C][C]-0.0073[/C][C]0.497096[/C][/ROW]
[ROW][C]21[/C][C]-0.010438[/C][C]-0.1124[/C][C]0.455344[/C][/ROW]
[ROW][C]22[/C][C]0.093875[/C][C]1.0111[/C][C]0.157044[/C][/ROW]
[ROW][C]23[/C][C]0.051959[/C][C]0.5596[/C][C]0.28841[/C][/ROW]
[ROW][C]24[/C][C]-0.054102[/C][C]-0.5827[/C][C]0.280614[/C][/ROW]
[ROW][C]25[/C][C]-0.184622[/C][C]-1.9884[/C][C]0.024559[/C][/ROW]
[ROW][C]26[/C][C]0.077176[/C][C]0.8312[/C][C]0.203781[/C][/ROW]
[ROW][C]27[/C][C]-0.169717[/C][C]-1.8279[/C][C]0.035067[/C][/ROW]
[ROW][C]28[/C][C]-0.024057[/C][C]-0.2591[/C][C]0.39801[/C][/ROW]
[ROW][C]29[/C][C]0.031832[/C][C]0.3428[/C][C]0.366168[/C][/ROW]
[ROW][C]30[/C][C]0.017543[/C][C]0.1889[/C][C]0.425232[/C][/ROW]
[ROW][C]31[/C][C]0.050856[/C][C]0.5477[/C][C]0.292464[/C][/ROW]
[ROW][C]32[/C][C]0.09801[/C][C]1.0556[/C][C]0.146673[/C][/ROW]
[ROW][C]33[/C][C]0.047518[/C][C]0.5118[/C][C]0.304886[/C][/ROW]
[ROW][C]34[/C][C]0.025102[/C][C]0.2704[/C][C]0.393682[/C][/ROW]
[ROW][C]35[/C][C]-0.000739[/C][C]-0.008[/C][C]0.496829[/C][/ROW]
[ROW][C]36[/C][C]0.008664[/C][C]0.0933[/C][C]0.462907[/C][/ROW]
[ROW][C]37[/C][C]-0.075857[/C][C]-0.817[/C][C]0.2078[/C][/ROW]
[ROW][C]38[/C][C]-0.043744[/C][C]-0.4711[/C][C]0.319212[/C][/ROW]
[ROW][C]39[/C][C]0.006778[/C][C]0.073[/C][C]0.470965[/C][/ROW]
[ROW][C]40[/C][C]0.017044[/C][C]0.1836[/C][C]0.427337[/C][/ROW]
[ROW][C]41[/C][C]-0.091915[/C][C]-0.99[/C][C]0.162128[/C][/ROW]
[ROW][C]42[/C][C]0.001359[/C][C]0.0146[/C][C]0.494171[/C][/ROW]
[ROW][C]43[/C][C]-0.001997[/C][C]-0.0215[/C][C]0.491439[/C][/ROW]
[ROW][C]44[/C][C]-0.053608[/C][C]-0.5774[/C][C]0.282403[/C][/ROW]
[ROW][C]45[/C][C]0.010841[/C][C]0.1168[/C][C]0.453624[/C][/ROW]
[ROW][C]46[/C][C]-0.05435[/C][C]-0.5854[/C][C]0.279721[/C][/ROW]
[ROW][C]47[/C][C]0.030578[/C][C]0.3293[/C][C]0.371249[/C][/ROW]
[ROW][C]48[/C][C]0.014297[/C][C]0.154[/C][C]0.438946[/C][/ROW]
[/TABLE]
Source: https://freestatistics.org/blog/index.php?pk=298571&T=2

Globally Unique Identifier (entire table): ba.freestatistics.org/blog/index.php?pk=298571&T=2

As an alternative you can also use a QR Code:  

The GUIDs for individual cells are displayed in the table below:

Partial Autocorrelation Function
Time lag kPACF(k)T-STATP-value
10.9240529.95230
20.0133160.14340.443105
3-0.106893-1.15130.125993
4-0.109075-1.17480.121246
50.0805960.8680.193582
60.0302820.32610.37245
70.1639771.76610.040006
80.0329210.35460.361779
90.1179971.27090.10316
10-0.056809-0.61180.270917
11-0.127672-1.37510.085881
120.0857590.92370.178791
13-0.411283-4.42971.1e-05
14-0.097555-1.05070.14779
150.0787440.84810.199064
160.0280690.30230.381477
170.1110861.19640.116985
18-0.007476-0.08050.467983
190.003390.03650.485469
20-0.000677-0.00730.497096
21-0.010438-0.11240.455344
220.0938751.01110.157044
230.0519590.55960.28841
24-0.054102-0.58270.280614
25-0.184622-1.98840.024559
260.0771760.83120.203781
27-0.169717-1.82790.035067
28-0.024057-0.25910.39801
290.0318320.34280.366168
300.0175430.18890.425232
310.0508560.54770.292464
320.098011.05560.146673
330.0475180.51180.304886
340.0251020.27040.393682
35-0.000739-0.0080.496829
360.0086640.09330.462907
37-0.075857-0.8170.2078
38-0.043744-0.47110.319212
390.0067780.0730.470965
400.0170440.18360.427337
41-0.091915-0.990.162128
420.0013590.01460.494171
43-0.001997-0.02150.491439
44-0.053608-0.57740.282403
450.0108410.11680.453624
46-0.05435-0.58540.279721
470.0305780.32930.371249
480.0142970.1540.438946


Parameters (Session):
par1 = Default ; par2 = 1 ; par3 = 1 ; par4 = 1 ; par5 = 4 ; par6 = White Noise ; par7 = 0.95 ;
Parameters (R input):
par1 = 48 ; par2 = 1 ; par3 = 0 ; par4 = 0 ; par5 = 12 ; par6 = White Noise ; par7 = 0.95 ; par8 = ;
R code (references can be found in the software module):
par8 <- ''
par7 <- '0.95'
par6 <- 'White Noise'
par5 <- '12'
par4 <- '1'
par3 <- '1'
par2 <- '1'
par1 <- '48'
if (par1 == 'Default') {
par1 = 10*log10(length(x))
} else {
par1 <- as.numeric(par1)
}
par2 <- as.numeric(par2)
par3 <- as.numeric(par3)
par4 <- as.numeric(par4)
par5 <- as.numeric(par5)
if (par6 == 'White Noise') par6 <- 'white' else par6 <- 'ma'
par7 <- as.numeric(par7)
if (par8 != '') par8 <- as.numeric(par8)
x <- na.omit(x)
ox <- x
if (par8 == '') {
if (par2 == 0) {
x <- log(x)
} else {
x <- (x ^ par2 - 1) / par2
}
} else {
x <- log(x,base=par8)
}
if (par3 > 0) x <- diff(x,lag=1,difference=par3)
if (par4 > 0) x <- diff(x,lag=par5,difference=par4)
bitmap(file='picts.png')
op <- par(mfrow=c(2,1))
plot(ox,type='l',main='Original Time Series',xlab='time',ylab='value')
if (par8=='') {
mytitle <- paste('Working Time Series (lambda=',par2,', d=',par3,', D=',par4,')',sep='')
mysub <- paste('(lambda=',par2,', d=',par3,', D=',par4,', CI=', par7, ', CI type=',par6,')',sep='')
} else {
mytitle <- paste('Working Time Series (base=',par8,', d=',par3,', D=',par4,')',sep='')
mysub <- paste('(base=',par8,', d=',par3,', D=',par4,', CI=', par7, ', CI type=',par6,')',sep='')
}
plot(x,type='l', main=mytitle,xlab='time',ylab='value')
par(op)
dev.off()
bitmap(file='pic1.png')
racf <- acf(x, par1, main='Autocorrelation', xlab='time lag', ylab='ACF', ci.type=par6, ci=par7, sub=mysub)
dev.off()
bitmap(file='pic2.png')
rpacf <- pacf(x,par1,main='Partial Autocorrelation',xlab='lags',ylab='PACF',sub=mysub)
dev.off()
(myacf <- c(racf$acf))
(mypacf <- c(rpacf$acf))
lengthx <- length(x)
sqrtn <- sqrt(lengthx)
load(file='createtable')
a<-table.start()
a<-table.row.start(a)
a<-table.element(a,'Autocorrelation Function',4,TRUE)
a<-table.row.end(a)
a<-table.row.start(a)
a<-table.element(a,'Time lag k',header=TRUE)
a<-table.element(a,'ACF(k)',header=TRUE)
a<-table.element(a,'T-STAT',header=TRUE)
a<-table.element(a,'P-value',header=TRUE)
a<-table.row.end(a)
for (i in 2:(par1+1)) {
a<-table.row.start(a)
a<-table.element(a,i-1,header=TRUE)
a<-table.element(a,round(myacf[i],6))
mytstat <- myacf[i]*sqrtn
a<-table.element(a,round(mytstat,4))
a<-table.element(a,round(1-pt(abs(mytstat),lengthx),6))
a<-table.row.end(a)
}
a<-table.end(a)
table.save(a,file='mytable.tab')
a<-table.start()
a<-table.row.start(a)
a<-table.element(a,'Partial Autocorrelation Function',4,TRUE)
a<-table.row.end(a)
a<-table.row.start(a)
a<-table.element(a,'Time lag k',header=TRUE)
a<-table.element(a,'PACF(k)',header=TRUE)
a<-table.element(a,'T-STAT',header=TRUE)
a<-table.element(a,'P-value',header=TRUE)
a<-table.row.end(a)
for (i in 1:par1) {
a<-table.row.start(a)
a<-table.element(a,i,header=TRUE)
a<-table.element(a,round(mypacf[i],6))
mytstat <- mypacf[i]*sqrtn
a<-table.element(a,round(mytstat,4))
a<-table.element(a,round(1-pt(abs(mytstat),lengthx),6))
a<-table.row.end(a)
}
a<-table.end(a)
table.save(a,file='mytable1.tab')