Free Statistics

of Irreproducible Research!

Author's title

Author*The author of this computation has been verified*
R Software Modulerwasp_autocorrelation.wasp
Title produced by software(Partial) Autocorrelation Function
Date of computationFri, 09 Dec 2016 14:55:05 +0100
Cite this page as followsStatistical Computations at FreeStatistics.org, Office for Research Development and Education, URL https://freestatistics.org/blog/index.php?v=date/2016/Dec/09/t1481291738an2ka43l5bxt412.htm/, Retrieved Sat, 18 May 2024 07:04:05 +0000
Statistical Computations at FreeStatistics.org, Office for Research Development and Education, URL https://freestatistics.org/blog/index.php?pk=298547, Retrieved Sat, 18 May 2024 07:04:05 +0000
QR Codes:

Original text written by user:
IsPrivate?No (this computation is public)
User-defined keywords
Estimated Impact70
Family? (F = Feedback message, R = changed R code, M = changed R Module, P = changed Parameters, D = changed Data)
-       [(Partial) Autocorrelation Function] [ACF d=0 D=0] [2016-12-09 13:55:05] [9fb47d69755d1f4b66b6f2591280f9e0] [Current]
Feedback Forum

Post a new message
Dataseries X:
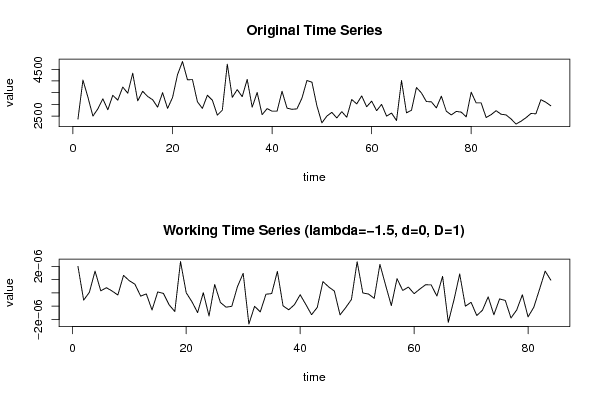
2370
4040
3310
2500
2810
3240
2770
3390
3180
3740
3480
4330
3150
3560
3340
3200
2880
3500
2830
3290
4270
4830
4050
4060
3110
2830
3390
3180
2540
2750
4720
3300
3630
3330
4070
2880
3510
2560
2820
2710
2710
3560
2840
2790
2810
3270
4020
3950
2940
2210
2500
2660
2420
2690
2450
3210
3020
3360
2900
3140
2730
3000
2500
2630
2310
4020
2640
2750
3720
3490
3120
3110
2850
3350
2710
2550
2700
2670
2470
3520
3060
3060
2440
2560
2730
2580
2550
2380
2160
2280
2430
2610
2600
3200
3090
2940


Summary of computational transaction
Raw Input view raw input (R code)
Raw Outputview raw output of R engine
Computing time2 seconds
R ServerBig Analytics Cloud Computing Center

\begin{tabular}{lllllllll}
\hline
Summary of computational transaction \tabularnewline
Raw Input view raw input (R code)  \tabularnewline
Raw Outputview raw output of R engine  \tabularnewline
Computing time2 seconds \tabularnewline
R ServerBig Analytics Cloud Computing Center \tabularnewline
\hline
\end{tabular}
%Source: https://freestatistics.org/blog/index.php?pk=298547&T=0

[TABLE]
[ROW]
Summary of computational transaction[/C][/ROW] [ROW]Raw Input[/C] view raw input (R code) [/C][/ROW] [ROW]Raw Output[/C]view raw output of R engine [/C][/ROW] [ROW]Computing time[/C]2 seconds[/C][/ROW] [ROW]R Server[/C]Big Analytics Cloud Computing Center[/C][/ROW] [/TABLE] Source: https://freestatistics.org/blog/index.php?pk=298547&T=0

Globally Unique Identifier (entire table): ba.freestatistics.org/blog/index.php?pk=298547&T=0

As an alternative you can also use a QR Code:  

The GUIDs for individual cells are displayed in the table below:

Summary of computational transaction
Raw Input view raw input (R code)
Raw Outputview raw output of R engine
Computing time2 seconds
R ServerBig Analytics Cloud Computing Center


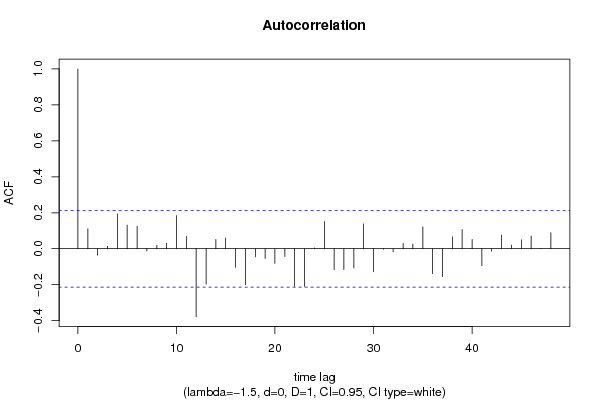
Autocorrelation Function
Time lag kACF(k)T-STATP-value
10.1112071.01920.155511
2-0.03555-0.32580.372685
30.0131780.12080.452077
40.1936081.77440.039806
50.1314771.2050.115792
60.1255481.15070.126567
7-0.012492-0.11450.454562
80.018920.17340.431375
90.030690.28130.389595
100.1850941.69640.046755
110.0681990.62510.266816
12-0.37771-3.46180.000423
13-0.196815-1.80380.03742
140.0515890.47280.318783
150.0600020.54990.291916
16-0.10384-0.95170.171988
17-0.199499-1.82840.035517
18-0.045072-0.41310.340298
19-0.054238-0.49710.310207
20-0.080292-0.73590.231925
21-0.04324-0.39630.346443
22-0.20863-1.91210.029635
23-0.209302-1.91830.029236
240.0046270.04240.483136
250.1519831.39290.083656
26-0.117251-1.07460.14281
27-0.115746-1.06080.145904
28-0.107357-0.98390.163984
290.1373711.2590.105754
30-0.128365-1.17650.121362
31-0.002992-0.02740.489095
32-0.01665-0.15260.439541
330.0288390.26430.396092
340.0266870.24460.403685
350.1213531.11220.134609
36-0.139154-1.27540.102847
37-0.155032-1.42090.079525
380.0664650.60920.27203
390.1068840.97960.165047
400.0517090.47390.318394
41-0.093854-0.86020.196067
42-0.013088-0.120.452402
430.0768760.70460.24151
440.0203930.18690.426093
450.0493290.45210.32618
460.0709320.65010.258701
47-0.00049-0.00450.498214
480.0886840.81280.209315

\begin{tabular}{lllllllll}
\hline
Autocorrelation Function \tabularnewline
Time lag k & ACF(k) & T-STAT & P-value \tabularnewline
1 & 0.111207 & 1.0192 & 0.155511 \tabularnewline
2 & -0.03555 & -0.3258 & 0.372685 \tabularnewline
3 & 0.013178 & 0.1208 & 0.452077 \tabularnewline
4 & 0.193608 & 1.7744 & 0.039806 \tabularnewline
5 & 0.131477 & 1.205 & 0.115792 \tabularnewline
6 & 0.125548 & 1.1507 & 0.126567 \tabularnewline
7 & -0.012492 & -0.1145 & 0.454562 \tabularnewline
8 & 0.01892 & 0.1734 & 0.431375 \tabularnewline
9 & 0.03069 & 0.2813 & 0.389595 \tabularnewline
10 & 0.185094 & 1.6964 & 0.046755 \tabularnewline
11 & 0.068199 & 0.6251 & 0.266816 \tabularnewline
12 & -0.37771 & -3.4618 & 0.000423 \tabularnewline
13 & -0.196815 & -1.8038 & 0.03742 \tabularnewline
14 & 0.051589 & 0.4728 & 0.318783 \tabularnewline
15 & 0.060002 & 0.5499 & 0.291916 \tabularnewline
16 & -0.10384 & -0.9517 & 0.171988 \tabularnewline
17 & -0.199499 & -1.8284 & 0.035517 \tabularnewline
18 & -0.045072 & -0.4131 & 0.340298 \tabularnewline
19 & -0.054238 & -0.4971 & 0.310207 \tabularnewline
20 & -0.080292 & -0.7359 & 0.231925 \tabularnewline
21 & -0.04324 & -0.3963 & 0.346443 \tabularnewline
22 & -0.20863 & -1.9121 & 0.029635 \tabularnewline
23 & -0.209302 & -1.9183 & 0.029236 \tabularnewline
24 & 0.004627 & 0.0424 & 0.483136 \tabularnewline
25 & 0.151983 & 1.3929 & 0.083656 \tabularnewline
26 & -0.117251 & -1.0746 & 0.14281 \tabularnewline
27 & -0.115746 & -1.0608 & 0.145904 \tabularnewline
28 & -0.107357 & -0.9839 & 0.163984 \tabularnewline
29 & 0.137371 & 1.259 & 0.105754 \tabularnewline
30 & -0.128365 & -1.1765 & 0.121362 \tabularnewline
31 & -0.002992 & -0.0274 & 0.489095 \tabularnewline
32 & -0.01665 & -0.1526 & 0.439541 \tabularnewline
33 & 0.028839 & 0.2643 & 0.396092 \tabularnewline
34 & 0.026687 & 0.2446 & 0.403685 \tabularnewline
35 & 0.121353 & 1.1122 & 0.134609 \tabularnewline
36 & -0.139154 & -1.2754 & 0.102847 \tabularnewline
37 & -0.155032 & -1.4209 & 0.079525 \tabularnewline
38 & 0.066465 & 0.6092 & 0.27203 \tabularnewline
39 & 0.106884 & 0.9796 & 0.165047 \tabularnewline
40 & 0.051709 & 0.4739 & 0.318394 \tabularnewline
41 & -0.093854 & -0.8602 & 0.196067 \tabularnewline
42 & -0.013088 & -0.12 & 0.452402 \tabularnewline
43 & 0.076876 & 0.7046 & 0.24151 \tabularnewline
44 & 0.020393 & 0.1869 & 0.426093 \tabularnewline
45 & 0.049329 & 0.4521 & 0.32618 \tabularnewline
46 & 0.070932 & 0.6501 & 0.258701 \tabularnewline
47 & -0.00049 & -0.0045 & 0.498214 \tabularnewline
48 & 0.088684 & 0.8128 & 0.209315 \tabularnewline
\hline
\end{tabular}
%Source: https://freestatistics.org/blog/index.php?pk=298547&T=1

[TABLE]
[ROW][C]Autocorrelation Function[/C][/ROW]
[ROW][C]Time lag k[/C][C]ACF(k)[/C][C]T-STAT[/C][C]P-value[/C][/ROW]
[ROW][C]1[/C][C]0.111207[/C][C]1.0192[/C][C]0.155511[/C][/ROW]
[ROW][C]2[/C][C]-0.03555[/C][C]-0.3258[/C][C]0.372685[/C][/ROW]
[ROW][C]3[/C][C]0.013178[/C][C]0.1208[/C][C]0.452077[/C][/ROW]
[ROW][C]4[/C][C]0.193608[/C][C]1.7744[/C][C]0.039806[/C][/ROW]
[ROW][C]5[/C][C]0.131477[/C][C]1.205[/C][C]0.115792[/C][/ROW]
[ROW][C]6[/C][C]0.125548[/C][C]1.1507[/C][C]0.126567[/C][/ROW]
[ROW][C]7[/C][C]-0.012492[/C][C]-0.1145[/C][C]0.454562[/C][/ROW]
[ROW][C]8[/C][C]0.01892[/C][C]0.1734[/C][C]0.431375[/C][/ROW]
[ROW][C]9[/C][C]0.03069[/C][C]0.2813[/C][C]0.389595[/C][/ROW]
[ROW][C]10[/C][C]0.185094[/C][C]1.6964[/C][C]0.046755[/C][/ROW]
[ROW][C]11[/C][C]0.068199[/C][C]0.6251[/C][C]0.266816[/C][/ROW]
[ROW][C]12[/C][C]-0.37771[/C][C]-3.4618[/C][C]0.000423[/C][/ROW]
[ROW][C]13[/C][C]-0.196815[/C][C]-1.8038[/C][C]0.03742[/C][/ROW]
[ROW][C]14[/C][C]0.051589[/C][C]0.4728[/C][C]0.318783[/C][/ROW]
[ROW][C]15[/C][C]0.060002[/C][C]0.5499[/C][C]0.291916[/C][/ROW]
[ROW][C]16[/C][C]-0.10384[/C][C]-0.9517[/C][C]0.171988[/C][/ROW]
[ROW][C]17[/C][C]-0.199499[/C][C]-1.8284[/C][C]0.035517[/C][/ROW]
[ROW][C]18[/C][C]-0.045072[/C][C]-0.4131[/C][C]0.340298[/C][/ROW]
[ROW][C]19[/C][C]-0.054238[/C][C]-0.4971[/C][C]0.310207[/C][/ROW]
[ROW][C]20[/C][C]-0.080292[/C][C]-0.7359[/C][C]0.231925[/C][/ROW]
[ROW][C]21[/C][C]-0.04324[/C][C]-0.3963[/C][C]0.346443[/C][/ROW]
[ROW][C]22[/C][C]-0.20863[/C][C]-1.9121[/C][C]0.029635[/C][/ROW]
[ROW][C]23[/C][C]-0.209302[/C][C]-1.9183[/C][C]0.029236[/C][/ROW]
[ROW][C]24[/C][C]0.004627[/C][C]0.0424[/C][C]0.483136[/C][/ROW]
[ROW][C]25[/C][C]0.151983[/C][C]1.3929[/C][C]0.083656[/C][/ROW]
[ROW][C]26[/C][C]-0.117251[/C][C]-1.0746[/C][C]0.14281[/C][/ROW]
[ROW][C]27[/C][C]-0.115746[/C][C]-1.0608[/C][C]0.145904[/C][/ROW]
[ROW][C]28[/C][C]-0.107357[/C][C]-0.9839[/C][C]0.163984[/C][/ROW]
[ROW][C]29[/C][C]0.137371[/C][C]1.259[/C][C]0.105754[/C][/ROW]
[ROW][C]30[/C][C]-0.128365[/C][C]-1.1765[/C][C]0.121362[/C][/ROW]
[ROW][C]31[/C][C]-0.002992[/C][C]-0.0274[/C][C]0.489095[/C][/ROW]
[ROW][C]32[/C][C]-0.01665[/C][C]-0.1526[/C][C]0.439541[/C][/ROW]
[ROW][C]33[/C][C]0.028839[/C][C]0.2643[/C][C]0.396092[/C][/ROW]
[ROW][C]34[/C][C]0.026687[/C][C]0.2446[/C][C]0.403685[/C][/ROW]
[ROW][C]35[/C][C]0.121353[/C][C]1.1122[/C][C]0.134609[/C][/ROW]
[ROW][C]36[/C][C]-0.139154[/C][C]-1.2754[/C][C]0.102847[/C][/ROW]
[ROW][C]37[/C][C]-0.155032[/C][C]-1.4209[/C][C]0.079525[/C][/ROW]
[ROW][C]38[/C][C]0.066465[/C][C]0.6092[/C][C]0.27203[/C][/ROW]
[ROW][C]39[/C][C]0.106884[/C][C]0.9796[/C][C]0.165047[/C][/ROW]
[ROW][C]40[/C][C]0.051709[/C][C]0.4739[/C][C]0.318394[/C][/ROW]
[ROW][C]41[/C][C]-0.093854[/C][C]-0.8602[/C][C]0.196067[/C][/ROW]
[ROW][C]42[/C][C]-0.013088[/C][C]-0.12[/C][C]0.452402[/C][/ROW]
[ROW][C]43[/C][C]0.076876[/C][C]0.7046[/C][C]0.24151[/C][/ROW]
[ROW][C]44[/C][C]0.020393[/C][C]0.1869[/C][C]0.426093[/C][/ROW]
[ROW][C]45[/C][C]0.049329[/C][C]0.4521[/C][C]0.32618[/C][/ROW]
[ROW][C]46[/C][C]0.070932[/C][C]0.6501[/C][C]0.258701[/C][/ROW]
[ROW][C]47[/C][C]-0.00049[/C][C]-0.0045[/C][C]0.498214[/C][/ROW]
[ROW][C]48[/C][C]0.088684[/C][C]0.8128[/C][C]0.209315[/C][/ROW]
[/TABLE]
Source: https://freestatistics.org/blog/index.php?pk=298547&T=1

Globally Unique Identifier (entire table): ba.freestatistics.org/blog/index.php?pk=298547&T=1

As an alternative you can also use a QR Code:  

The GUIDs for individual cells are displayed in the table below:

Autocorrelation Function
Time lag kACF(k)T-STATP-value
10.1112071.01920.155511
2-0.03555-0.32580.372685
30.0131780.12080.452077
40.1936081.77440.039806
50.1314771.2050.115792
60.1255481.15070.126567
7-0.012492-0.11450.454562
80.018920.17340.431375
90.030690.28130.389595
100.1850941.69640.046755
110.0681990.62510.266816
12-0.37771-3.46180.000423
13-0.196815-1.80380.03742
140.0515890.47280.318783
150.0600020.54990.291916
16-0.10384-0.95170.171988
17-0.199499-1.82840.035517
18-0.045072-0.41310.340298
19-0.054238-0.49710.310207
20-0.080292-0.73590.231925
21-0.04324-0.39630.346443
22-0.20863-1.91210.029635
23-0.209302-1.91830.029236
240.0046270.04240.483136
250.1519831.39290.083656
26-0.117251-1.07460.14281
27-0.115746-1.06080.145904
28-0.107357-0.98390.163984
290.1373711.2590.105754
30-0.128365-1.17650.121362
31-0.002992-0.02740.489095
32-0.01665-0.15260.439541
330.0288390.26430.396092
340.0266870.24460.403685
350.1213531.11220.134609
36-0.139154-1.27540.102847
37-0.155032-1.42090.079525
380.0664650.60920.27203
390.1068840.97960.165047
400.0517090.47390.318394
41-0.093854-0.86020.196067
42-0.013088-0.120.452402
430.0768760.70460.24151
440.0203930.18690.426093
450.0493290.45210.32618
460.0709320.65010.258701
47-0.00049-0.00450.498214
480.0886840.81280.209315


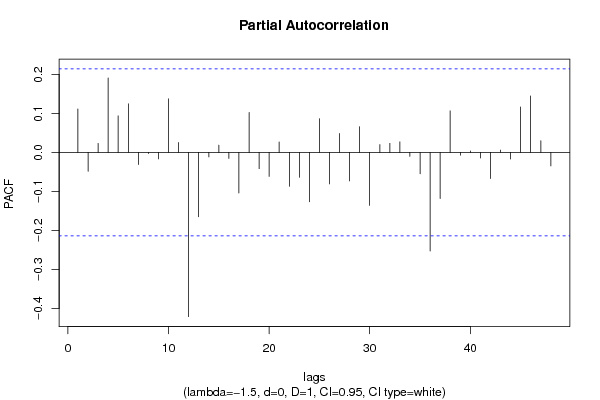
Partial Autocorrelation Function
Time lag kPACF(k)T-STATP-value
10.1112071.01920.155511
2-0.048517-0.44470.328853
30.0230580.21130.416572
40.1905721.74660.042179
50.0936880.85870.196485
60.1243241.13950.128877
7-0.031029-0.28440.388407
8-0.002713-0.02490.490111
9-0.016557-0.15170.439876
100.1372691.25810.105923
110.0254190.2330.408175
12-0.420891-3.85750.000112
13-0.164964-1.51190.067153
14-0.011493-0.10530.458182
150.0185710.17020.432627
16-0.015317-0.14040.444348
17-0.104112-0.95420.17136
180.1022360.9370.175719
19-0.041645-0.38170.35183
20-0.061463-0.56330.287359
210.0268780.24630.403009
22-0.086578-0.79350.21486
23-0.063572-0.58260.280846
24-0.126387-1.15840.125001
250.0861650.78970.215959
26-0.080747-0.74010.230664
270.0483910.44350.329267
28-0.072997-0.6690.252656
290.0658630.60360.273854
30-0.135853-1.24510.108276
310.0199320.18270.427744
320.0232430.2130.415913
330.0269690.24720.402687
34-0.010106-0.09260.463211
35-0.054892-0.50310.308108
36-0.252894-2.31780.011446
37-0.117949-1.0810.14139
380.1064370.97550.166054
39-0.006955-0.06370.474663
400.0037990.03480.486153
41-0.014597-0.13380.446948
42-0.066904-0.61320.270704
430.0057830.0530.478927
44-0.017082-0.15660.437983
450.1164331.06710.144486
460.1445021.32440.094484
470.0297970.27310.392725
48-0.034568-0.31680.376084

\begin{tabular}{lllllllll}
\hline
Partial Autocorrelation Function \tabularnewline
Time lag k & PACF(k) & T-STAT & P-value \tabularnewline
1 & 0.111207 & 1.0192 & 0.155511 \tabularnewline
2 & -0.048517 & -0.4447 & 0.328853 \tabularnewline
3 & 0.023058 & 0.2113 & 0.416572 \tabularnewline
4 & 0.190572 & 1.7466 & 0.042179 \tabularnewline
5 & 0.093688 & 0.8587 & 0.196485 \tabularnewline
6 & 0.124324 & 1.1395 & 0.128877 \tabularnewline
7 & -0.031029 & -0.2844 & 0.388407 \tabularnewline
8 & -0.002713 & -0.0249 & 0.490111 \tabularnewline
9 & -0.016557 & -0.1517 & 0.439876 \tabularnewline
10 & 0.137269 & 1.2581 & 0.105923 \tabularnewline
11 & 0.025419 & 0.233 & 0.408175 \tabularnewline
12 & -0.420891 & -3.8575 & 0.000112 \tabularnewline
13 & -0.164964 & -1.5119 & 0.067153 \tabularnewline
14 & -0.011493 & -0.1053 & 0.458182 \tabularnewline
15 & 0.018571 & 0.1702 & 0.432627 \tabularnewline
16 & -0.015317 & -0.1404 & 0.444348 \tabularnewline
17 & -0.104112 & -0.9542 & 0.17136 \tabularnewline
18 & 0.102236 & 0.937 & 0.175719 \tabularnewline
19 & -0.041645 & -0.3817 & 0.35183 \tabularnewline
20 & -0.061463 & -0.5633 & 0.287359 \tabularnewline
21 & 0.026878 & 0.2463 & 0.403009 \tabularnewline
22 & -0.086578 & -0.7935 & 0.21486 \tabularnewline
23 & -0.063572 & -0.5826 & 0.280846 \tabularnewline
24 & -0.126387 & -1.1584 & 0.125001 \tabularnewline
25 & 0.086165 & 0.7897 & 0.215959 \tabularnewline
26 & -0.080747 & -0.7401 & 0.230664 \tabularnewline
27 & 0.048391 & 0.4435 & 0.329267 \tabularnewline
28 & -0.072997 & -0.669 & 0.252656 \tabularnewline
29 & 0.065863 & 0.6036 & 0.273854 \tabularnewline
30 & -0.135853 & -1.2451 & 0.108276 \tabularnewline
31 & 0.019932 & 0.1827 & 0.427744 \tabularnewline
32 & 0.023243 & 0.213 & 0.415913 \tabularnewline
33 & 0.026969 & 0.2472 & 0.402687 \tabularnewline
34 & -0.010106 & -0.0926 & 0.463211 \tabularnewline
35 & -0.054892 & -0.5031 & 0.308108 \tabularnewline
36 & -0.252894 & -2.3178 & 0.011446 \tabularnewline
37 & -0.117949 & -1.081 & 0.14139 \tabularnewline
38 & 0.106437 & 0.9755 & 0.166054 \tabularnewline
39 & -0.006955 & -0.0637 & 0.474663 \tabularnewline
40 & 0.003799 & 0.0348 & 0.486153 \tabularnewline
41 & -0.014597 & -0.1338 & 0.446948 \tabularnewline
42 & -0.066904 & -0.6132 & 0.270704 \tabularnewline
43 & 0.005783 & 0.053 & 0.478927 \tabularnewline
44 & -0.017082 & -0.1566 & 0.437983 \tabularnewline
45 & 0.116433 & 1.0671 & 0.144486 \tabularnewline
46 & 0.144502 & 1.3244 & 0.094484 \tabularnewline
47 & 0.029797 & 0.2731 & 0.392725 \tabularnewline
48 & -0.034568 & -0.3168 & 0.376084 \tabularnewline
\hline
\end{tabular}
%Source: https://freestatistics.org/blog/index.php?pk=298547&T=2

[TABLE]
[ROW][C]Partial Autocorrelation Function[/C][/ROW]
[ROW][C]Time lag k[/C][C]PACF(k)[/C][C]T-STAT[/C][C]P-value[/C][/ROW]
[ROW][C]1[/C][C]0.111207[/C][C]1.0192[/C][C]0.155511[/C][/ROW]
[ROW][C]2[/C][C]-0.048517[/C][C]-0.4447[/C][C]0.328853[/C][/ROW]
[ROW][C]3[/C][C]0.023058[/C][C]0.2113[/C][C]0.416572[/C][/ROW]
[ROW][C]4[/C][C]0.190572[/C][C]1.7466[/C][C]0.042179[/C][/ROW]
[ROW][C]5[/C][C]0.093688[/C][C]0.8587[/C][C]0.196485[/C][/ROW]
[ROW][C]6[/C][C]0.124324[/C][C]1.1395[/C][C]0.128877[/C][/ROW]
[ROW][C]7[/C][C]-0.031029[/C][C]-0.2844[/C][C]0.388407[/C][/ROW]
[ROW][C]8[/C][C]-0.002713[/C][C]-0.0249[/C][C]0.490111[/C][/ROW]
[ROW][C]9[/C][C]-0.016557[/C][C]-0.1517[/C][C]0.439876[/C][/ROW]
[ROW][C]10[/C][C]0.137269[/C][C]1.2581[/C][C]0.105923[/C][/ROW]
[ROW][C]11[/C][C]0.025419[/C][C]0.233[/C][C]0.408175[/C][/ROW]
[ROW][C]12[/C][C]-0.420891[/C][C]-3.8575[/C][C]0.000112[/C][/ROW]
[ROW][C]13[/C][C]-0.164964[/C][C]-1.5119[/C][C]0.067153[/C][/ROW]
[ROW][C]14[/C][C]-0.011493[/C][C]-0.1053[/C][C]0.458182[/C][/ROW]
[ROW][C]15[/C][C]0.018571[/C][C]0.1702[/C][C]0.432627[/C][/ROW]
[ROW][C]16[/C][C]-0.015317[/C][C]-0.1404[/C][C]0.444348[/C][/ROW]
[ROW][C]17[/C][C]-0.104112[/C][C]-0.9542[/C][C]0.17136[/C][/ROW]
[ROW][C]18[/C][C]0.102236[/C][C]0.937[/C][C]0.175719[/C][/ROW]
[ROW][C]19[/C][C]-0.041645[/C][C]-0.3817[/C][C]0.35183[/C][/ROW]
[ROW][C]20[/C][C]-0.061463[/C][C]-0.5633[/C][C]0.287359[/C][/ROW]
[ROW][C]21[/C][C]0.026878[/C][C]0.2463[/C][C]0.403009[/C][/ROW]
[ROW][C]22[/C][C]-0.086578[/C][C]-0.7935[/C][C]0.21486[/C][/ROW]
[ROW][C]23[/C][C]-0.063572[/C][C]-0.5826[/C][C]0.280846[/C][/ROW]
[ROW][C]24[/C][C]-0.126387[/C][C]-1.1584[/C][C]0.125001[/C][/ROW]
[ROW][C]25[/C][C]0.086165[/C][C]0.7897[/C][C]0.215959[/C][/ROW]
[ROW][C]26[/C][C]-0.080747[/C][C]-0.7401[/C][C]0.230664[/C][/ROW]
[ROW][C]27[/C][C]0.048391[/C][C]0.4435[/C][C]0.329267[/C][/ROW]
[ROW][C]28[/C][C]-0.072997[/C][C]-0.669[/C][C]0.252656[/C][/ROW]
[ROW][C]29[/C][C]0.065863[/C][C]0.6036[/C][C]0.273854[/C][/ROW]
[ROW][C]30[/C][C]-0.135853[/C][C]-1.2451[/C][C]0.108276[/C][/ROW]
[ROW][C]31[/C][C]0.019932[/C][C]0.1827[/C][C]0.427744[/C][/ROW]
[ROW][C]32[/C][C]0.023243[/C][C]0.213[/C][C]0.415913[/C][/ROW]
[ROW][C]33[/C][C]0.026969[/C][C]0.2472[/C][C]0.402687[/C][/ROW]
[ROW][C]34[/C][C]-0.010106[/C][C]-0.0926[/C][C]0.463211[/C][/ROW]
[ROW][C]35[/C][C]-0.054892[/C][C]-0.5031[/C][C]0.308108[/C][/ROW]
[ROW][C]36[/C][C]-0.252894[/C][C]-2.3178[/C][C]0.011446[/C][/ROW]
[ROW][C]37[/C][C]-0.117949[/C][C]-1.081[/C][C]0.14139[/C][/ROW]
[ROW][C]38[/C][C]0.106437[/C][C]0.9755[/C][C]0.166054[/C][/ROW]
[ROW][C]39[/C][C]-0.006955[/C][C]-0.0637[/C][C]0.474663[/C][/ROW]
[ROW][C]40[/C][C]0.003799[/C][C]0.0348[/C][C]0.486153[/C][/ROW]
[ROW][C]41[/C][C]-0.014597[/C][C]-0.1338[/C][C]0.446948[/C][/ROW]
[ROW][C]42[/C][C]-0.066904[/C][C]-0.6132[/C][C]0.270704[/C][/ROW]
[ROW][C]43[/C][C]0.005783[/C][C]0.053[/C][C]0.478927[/C][/ROW]
[ROW][C]44[/C][C]-0.017082[/C][C]-0.1566[/C][C]0.437983[/C][/ROW]
[ROW][C]45[/C][C]0.116433[/C][C]1.0671[/C][C]0.144486[/C][/ROW]
[ROW][C]46[/C][C]0.144502[/C][C]1.3244[/C][C]0.094484[/C][/ROW]
[ROW][C]47[/C][C]0.029797[/C][C]0.2731[/C][C]0.392725[/C][/ROW]
[ROW][C]48[/C][C]-0.034568[/C][C]-0.3168[/C][C]0.376084[/C][/ROW]
[/TABLE]
Source: https://freestatistics.org/blog/index.php?pk=298547&T=2

Globally Unique Identifier (entire table): ba.freestatistics.org/blog/index.php?pk=298547&T=2

As an alternative you can also use a QR Code:  

The GUIDs for individual cells are displayed in the table below:

Partial Autocorrelation Function
Time lag kPACF(k)T-STATP-value
10.1112071.01920.155511
2-0.048517-0.44470.328853
30.0230580.21130.416572
40.1905721.74660.042179
50.0936880.85870.196485
60.1243241.13950.128877
7-0.031029-0.28440.388407
8-0.002713-0.02490.490111
9-0.016557-0.15170.439876
100.1372691.25810.105923
110.0254190.2330.408175
12-0.420891-3.85750.000112
13-0.164964-1.51190.067153
14-0.011493-0.10530.458182
150.0185710.17020.432627
16-0.015317-0.14040.444348
17-0.104112-0.95420.17136
180.1022360.9370.175719
19-0.041645-0.38170.35183
20-0.061463-0.56330.287359
210.0268780.24630.403009
22-0.086578-0.79350.21486
23-0.063572-0.58260.280846
24-0.126387-1.15840.125001
250.0861650.78970.215959
26-0.080747-0.74010.230664
270.0483910.44350.329267
28-0.072997-0.6690.252656
290.0658630.60360.273854
30-0.135853-1.24510.108276
310.0199320.18270.427744
320.0232430.2130.415913
330.0269690.24720.402687
34-0.010106-0.09260.463211
35-0.054892-0.50310.308108
36-0.252894-2.31780.011446
37-0.117949-1.0810.14139
380.1064370.97550.166054
39-0.006955-0.06370.474663
400.0037990.03480.486153
41-0.014597-0.13380.446948
42-0.066904-0.61320.270704
430.0057830.0530.478927
44-0.017082-0.15660.437983
450.1164331.06710.144486
460.1445021.32440.094484
470.0297970.27310.392725
48-0.034568-0.31680.376084


Parameters (Session):
par4 = 12 ;
Parameters (R input):
par1 = 48 ; par2 = -1.5 ; par3 = 0 ; par4 = 1 ; par5 = 12 ; par6 = White Noise ; par7 = 0.95 ; par8 = ;
R code (references can be found in the software module):
par8 <- ''
par7 <- '0.95'
par6 <- 'White Noise'
par5 <- '12'
par4 <- '1'
par3 <- '0'
par2 <- '-1.5'
par1 <- 'Default'
if (par1 == 'Default') {
par1 = 10*log10(length(x))
} else {
par1 <- as.numeric(par1)
}
par2 <- as.numeric(par2)
par3 <- as.numeric(par3)
par4 <- as.numeric(par4)
par5 <- as.numeric(par5)
if (par6 == 'White Noise') par6 <- 'white' else par6 <- 'ma'
par7 <- as.numeric(par7)
if (par8 != '') par8 <- as.numeric(par8)
x <- na.omit(x)
ox <- x
if (par8 == '') {
if (par2 == 0) {
x <- log(x)
} else {
x <- (x ^ par2 - 1) / par2
}
} else {
x <- log(x,base=par8)
}
if (par3 > 0) x <- diff(x,lag=1,difference=par3)
if (par4 > 0) x <- diff(x,lag=par5,difference=par4)
bitmap(file='picts.png')
op <- par(mfrow=c(2,1))
plot(ox,type='l',main='Original Time Series',xlab='time',ylab='value')
if (par8=='') {
mytitle <- paste('Working Time Series (lambda=',par2,', d=',par3,', D=',par4,')',sep='')
mysub <- paste('(lambda=',par2,', d=',par3,', D=',par4,', CI=', par7, ', CI type=',par6,')',sep='')
} else {
mytitle <- paste('Working Time Series (base=',par8,', d=',par3,', D=',par4,')',sep='')
mysub <- paste('(base=',par8,', d=',par3,', D=',par4,', CI=', par7, ', CI type=',par6,')',sep='')
}
plot(x,type='l', main=mytitle,xlab='time',ylab='value')
par(op)
dev.off()
bitmap(file='pic1.png')
racf <- acf(x, par1, main='Autocorrelation', xlab='time lag', ylab='ACF', ci.type=par6, ci=par7, sub=mysub)
dev.off()
bitmap(file='pic2.png')
rpacf <- pacf(x,par1,main='Partial Autocorrelation',xlab='lags',ylab='PACF',sub=mysub)
dev.off()
(myacf <- c(racf$acf))
(mypacf <- c(rpacf$acf))
lengthx <- length(x)
sqrtn <- sqrt(lengthx)
load(file='createtable')
a<-table.start()
a<-table.row.start(a)
a<-table.element(a,'Autocorrelation Function',4,TRUE)
a<-table.row.end(a)
a<-table.row.start(a)
a<-table.element(a,'Time lag k',header=TRUE)
a<-table.element(a,'ACF(k)',header=TRUE)
a<-table.element(a,'T-STAT',header=TRUE)
a<-table.element(a,'P-value',header=TRUE)
a<-table.row.end(a)
for (i in 2:(par1+1)) {
a<-table.row.start(a)
a<-table.element(a,i-1,header=TRUE)
a<-table.element(a,round(myacf[i],6))
mytstat <- myacf[i]*sqrtn
a<-table.element(a,round(mytstat,4))
a<-table.element(a,round(1-pt(abs(mytstat),lengthx),6))
a<-table.row.end(a)
}
a<-table.end(a)
table.save(a,file='mytable.tab')
a<-table.start()
a<-table.row.start(a)
a<-table.element(a,'Partial Autocorrelation Function',4,TRUE)
a<-table.row.end(a)
a<-table.row.start(a)
a<-table.element(a,'Time lag k',header=TRUE)
a<-table.element(a,'PACF(k)',header=TRUE)
a<-table.element(a,'T-STAT',header=TRUE)
a<-table.element(a,'P-value',header=TRUE)
a<-table.row.end(a)
for (i in 1:par1) {
a<-table.row.start(a)
a<-table.element(a,i,header=TRUE)
a<-table.element(a,round(mypacf[i],6))
mytstat <- mypacf[i]*sqrtn
a<-table.element(a,round(mytstat,4))
a<-table.element(a,round(1-pt(abs(mytstat),lengthx),6))
a<-table.row.end(a)
}
a<-table.end(a)
table.save(a,file='mytable1.tab')