Free Statistics

of Irreproducible Research!

Author's title

Author*The author of this computation has been verified*
R Software Modulerwasp_autocorrelation.wasp
Title produced by software(Partial) Autocorrelation Function
Date of computationFri, 09 Dec 2016 14:49:32 +0100
Cite this page as followsStatistical Computations at FreeStatistics.org, Office for Research Development and Education, URL https://freestatistics.org/blog/index.php?v=date/2016/Dec/09/t1481291413z53zqj2u4s6q3d4.htm/, Retrieved Sat, 18 May 2024 08:17:50 +0000
Statistical Computations at FreeStatistics.org, Office for Research Development and Education, URL https://freestatistics.org/blog/index.php?pk=298544, Retrieved Sat, 18 May 2024 08:17:50 +0000
QR Codes:

Original text written by user:
IsPrivate?No (this computation is public)
User-defined keywords
Estimated Impact51
Family? (F = Feedback message, R = changed R code, M = changed R Module, P = changed Parameters, D = changed Data)
-       [(Partial) Autocorrelation Function] [ACF D=d=0] [2016-12-09 13:49:32] [9fb47d69755d1f4b66b6f2591280f9e0] [Current]
Feedback Forum

Post a new message
Dataseries X:
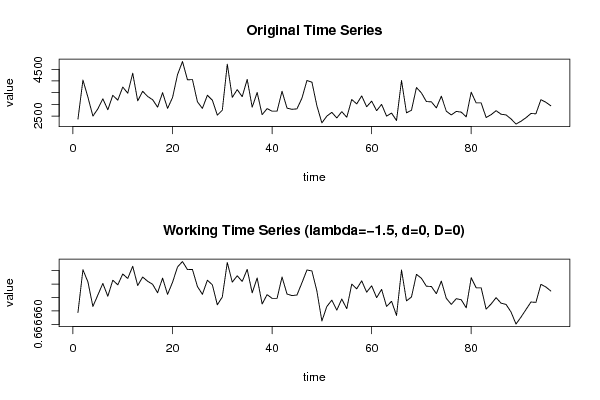
2370
4040
3310
2500
2810
3240
2770
3390
3180
3740
3480
4330
3150
3560
3340
3200
2880
3500
2830
3290
4270
4830
4050
4060
3110
2830
3390
3180
2540
2750
4720
3300
3630
3330
4070
2880
3510
2560
2820
2710
2710
3560
2840
2790
2810
3270
4020
3950
2940
2210
2500
2660
2420
2690
2450
3210
3020
3360
2900
3140
2730
3000
2500
2630
2310
4020
2640
2750
3720
3490
3120
3110
2850
3350
2710
2550
2700
2670
2470
3520
3060
3060
2440
2560
2730
2580
2550
2380
2160
2280
2430
2610
2600
3200
3090
2940


Summary of computational transaction
Raw Input view raw input (R code)
Raw Outputview raw output of R engine
Computing time1 seconds
R ServerBig Analytics Cloud Computing Center

\begin{tabular}{lllllllll}
\hline
Summary of computational transaction \tabularnewline
Raw Input view raw input (R code)  \tabularnewline
Raw Outputview raw output of R engine  \tabularnewline
Computing time1 seconds \tabularnewline
R ServerBig Analytics Cloud Computing Center \tabularnewline
\hline
\end{tabular}
%Source: https://freestatistics.org/blog/index.php?pk=298544&T=0

[TABLE]
[ROW]
Summary of computational transaction[/C][/ROW] [ROW]Raw Input[/C] view raw input (R code) [/C][/ROW] [ROW]Raw Output[/C]view raw output of R engine [/C][/ROW] [ROW]Computing time[/C]1 seconds[/C][/ROW] [ROW]R Server[/C]Big Analytics Cloud Computing Center[/C][/ROW] [/TABLE] Source: https://freestatistics.org/blog/index.php?pk=298544&T=0

Globally Unique Identifier (entire table): ba.freestatistics.org/blog/index.php?pk=298544&T=0

As an alternative you can also use a QR Code:  

The GUIDs for individual cells are displayed in the table below:

Summary of computational transaction
Raw Input view raw input (R code)
Raw Outputview raw output of R engine
Computing time1 seconds
R ServerBig Analytics Cloud Computing Center


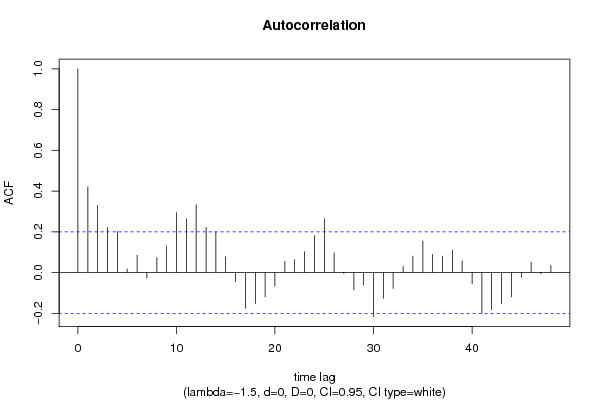
Autocorrelation Function
Time lag kACF(k)T-STATP-value
10.4208634.12364e-05
20.3285963.21960.000876
30.2201652.15720.016744
40.2016881.97610.025505
50.0175270.17170.432006
60.0844950.82790.204898
7-0.026207-0.25680.398949
80.072410.70950.239875
90.1308541.28210.101447
100.2944142.88470.002419
110.2629442.57630.005755
120.3328993.26170.000767
130.2217622.17280.016128
140.1995831.95550.026716
150.0770550.7550.226055
16-0.043706-0.42820.33472
17-0.175401-1.71860.044458
18-0.151371-1.48310.070659
19-0.119349-1.16940.122574
20-0.065889-0.64560.260047
210.0548250.53720.296194
220.0635830.6230.267387
230.1024221.00350.159065
240.1812521.77590.039459
250.263862.58530.005617
260.0972920.95330.171424
27-0.004975-0.04870.480613
28-0.084285-0.82580.205476
29-0.061066-0.59830.275517
30-0.216634-2.12260.018182
31-0.126196-1.23650.109651
32-0.07791-0.76340.22356
330.0297730.29170.385567
340.0807360.79110.215432
350.1550071.51880.066055
360.0883330.86550.194466
370.0805470.78920.215971
380.1092721.07060.143507
390.0568120.55660.289533
40-0.054903-0.53790.295931
41-0.199822-1.95780.026576
42-0.181221-1.77560.039484
43-0.153134-1.50040.068396
44-0.118832-1.16430.123591
45-0.023788-0.23310.4081
460.0507280.4970.310152
47-0.00541-0.0530.478918
480.0340960.33410.369529

\begin{tabular}{lllllllll}
\hline
Autocorrelation Function \tabularnewline
Time lag k & ACF(k) & T-STAT & P-value \tabularnewline
1 & 0.420863 & 4.1236 & 4e-05 \tabularnewline
2 & 0.328596 & 3.2196 & 0.000876 \tabularnewline
3 & 0.220165 & 2.1572 & 0.016744 \tabularnewline
4 & 0.201688 & 1.9761 & 0.025505 \tabularnewline
5 & 0.017527 & 0.1717 & 0.432006 \tabularnewline
6 & 0.084495 & 0.8279 & 0.204898 \tabularnewline
7 & -0.026207 & -0.2568 & 0.398949 \tabularnewline
8 & 0.07241 & 0.7095 & 0.239875 \tabularnewline
9 & 0.130854 & 1.2821 & 0.101447 \tabularnewline
10 & 0.294414 & 2.8847 & 0.002419 \tabularnewline
11 & 0.262944 & 2.5763 & 0.005755 \tabularnewline
12 & 0.332899 & 3.2617 & 0.000767 \tabularnewline
13 & 0.221762 & 2.1728 & 0.016128 \tabularnewline
14 & 0.199583 & 1.9555 & 0.026716 \tabularnewline
15 & 0.077055 & 0.755 & 0.226055 \tabularnewline
16 & -0.043706 & -0.4282 & 0.33472 \tabularnewline
17 & -0.175401 & -1.7186 & 0.044458 \tabularnewline
18 & -0.151371 & -1.4831 & 0.070659 \tabularnewline
19 & -0.119349 & -1.1694 & 0.122574 \tabularnewline
20 & -0.065889 & -0.6456 & 0.260047 \tabularnewline
21 & 0.054825 & 0.5372 & 0.296194 \tabularnewline
22 & 0.063583 & 0.623 & 0.267387 \tabularnewline
23 & 0.102422 & 1.0035 & 0.159065 \tabularnewline
24 & 0.181252 & 1.7759 & 0.039459 \tabularnewline
25 & 0.26386 & 2.5853 & 0.005617 \tabularnewline
26 & 0.097292 & 0.9533 & 0.171424 \tabularnewline
27 & -0.004975 & -0.0487 & 0.480613 \tabularnewline
28 & -0.084285 & -0.8258 & 0.205476 \tabularnewline
29 & -0.061066 & -0.5983 & 0.275517 \tabularnewline
30 & -0.216634 & -2.1226 & 0.018182 \tabularnewline
31 & -0.126196 & -1.2365 & 0.109651 \tabularnewline
32 & -0.07791 & -0.7634 & 0.22356 \tabularnewline
33 & 0.029773 & 0.2917 & 0.385567 \tabularnewline
34 & 0.080736 & 0.7911 & 0.215432 \tabularnewline
35 & 0.155007 & 1.5188 & 0.066055 \tabularnewline
36 & 0.088333 & 0.8655 & 0.194466 \tabularnewline
37 & 0.080547 & 0.7892 & 0.215971 \tabularnewline
38 & 0.109272 & 1.0706 & 0.143507 \tabularnewline
39 & 0.056812 & 0.5566 & 0.289533 \tabularnewline
40 & -0.054903 & -0.5379 & 0.295931 \tabularnewline
41 & -0.199822 & -1.9578 & 0.026576 \tabularnewline
42 & -0.181221 & -1.7756 & 0.039484 \tabularnewline
43 & -0.153134 & -1.5004 & 0.068396 \tabularnewline
44 & -0.118832 & -1.1643 & 0.123591 \tabularnewline
45 & -0.023788 & -0.2331 & 0.4081 \tabularnewline
46 & 0.050728 & 0.497 & 0.310152 \tabularnewline
47 & -0.00541 & -0.053 & 0.478918 \tabularnewline
48 & 0.034096 & 0.3341 & 0.369529 \tabularnewline
\hline
\end{tabular}
%Source: https://freestatistics.org/blog/index.php?pk=298544&T=1

[TABLE]
[ROW][C]Autocorrelation Function[/C][/ROW]
[ROW][C]Time lag k[/C][C]ACF(k)[/C][C]T-STAT[/C][C]P-value[/C][/ROW]
[ROW][C]1[/C][C]0.420863[/C][C]4.1236[/C][C]4e-05[/C][/ROW]
[ROW][C]2[/C][C]0.328596[/C][C]3.2196[/C][C]0.000876[/C][/ROW]
[ROW][C]3[/C][C]0.220165[/C][C]2.1572[/C][C]0.016744[/C][/ROW]
[ROW][C]4[/C][C]0.201688[/C][C]1.9761[/C][C]0.025505[/C][/ROW]
[ROW][C]5[/C][C]0.017527[/C][C]0.1717[/C][C]0.432006[/C][/ROW]
[ROW][C]6[/C][C]0.084495[/C][C]0.8279[/C][C]0.204898[/C][/ROW]
[ROW][C]7[/C][C]-0.026207[/C][C]-0.2568[/C][C]0.398949[/C][/ROW]
[ROW][C]8[/C][C]0.07241[/C][C]0.7095[/C][C]0.239875[/C][/ROW]
[ROW][C]9[/C][C]0.130854[/C][C]1.2821[/C][C]0.101447[/C][/ROW]
[ROW][C]10[/C][C]0.294414[/C][C]2.8847[/C][C]0.002419[/C][/ROW]
[ROW][C]11[/C][C]0.262944[/C][C]2.5763[/C][C]0.005755[/C][/ROW]
[ROW][C]12[/C][C]0.332899[/C][C]3.2617[/C][C]0.000767[/C][/ROW]
[ROW][C]13[/C][C]0.221762[/C][C]2.1728[/C][C]0.016128[/C][/ROW]
[ROW][C]14[/C][C]0.199583[/C][C]1.9555[/C][C]0.026716[/C][/ROW]
[ROW][C]15[/C][C]0.077055[/C][C]0.755[/C][C]0.226055[/C][/ROW]
[ROW][C]16[/C][C]-0.043706[/C][C]-0.4282[/C][C]0.33472[/C][/ROW]
[ROW][C]17[/C][C]-0.175401[/C][C]-1.7186[/C][C]0.044458[/C][/ROW]
[ROW][C]18[/C][C]-0.151371[/C][C]-1.4831[/C][C]0.070659[/C][/ROW]
[ROW][C]19[/C][C]-0.119349[/C][C]-1.1694[/C][C]0.122574[/C][/ROW]
[ROW][C]20[/C][C]-0.065889[/C][C]-0.6456[/C][C]0.260047[/C][/ROW]
[ROW][C]21[/C][C]0.054825[/C][C]0.5372[/C][C]0.296194[/C][/ROW]
[ROW][C]22[/C][C]0.063583[/C][C]0.623[/C][C]0.267387[/C][/ROW]
[ROW][C]23[/C][C]0.102422[/C][C]1.0035[/C][C]0.159065[/C][/ROW]
[ROW][C]24[/C][C]0.181252[/C][C]1.7759[/C][C]0.039459[/C][/ROW]
[ROW][C]25[/C][C]0.26386[/C][C]2.5853[/C][C]0.005617[/C][/ROW]
[ROW][C]26[/C][C]0.097292[/C][C]0.9533[/C][C]0.171424[/C][/ROW]
[ROW][C]27[/C][C]-0.004975[/C][C]-0.0487[/C][C]0.480613[/C][/ROW]
[ROW][C]28[/C][C]-0.084285[/C][C]-0.8258[/C][C]0.205476[/C][/ROW]
[ROW][C]29[/C][C]-0.061066[/C][C]-0.5983[/C][C]0.275517[/C][/ROW]
[ROW][C]30[/C][C]-0.216634[/C][C]-2.1226[/C][C]0.018182[/C][/ROW]
[ROW][C]31[/C][C]-0.126196[/C][C]-1.2365[/C][C]0.109651[/C][/ROW]
[ROW][C]32[/C][C]-0.07791[/C][C]-0.7634[/C][C]0.22356[/C][/ROW]
[ROW][C]33[/C][C]0.029773[/C][C]0.2917[/C][C]0.385567[/C][/ROW]
[ROW][C]34[/C][C]0.080736[/C][C]0.7911[/C][C]0.215432[/C][/ROW]
[ROW][C]35[/C][C]0.155007[/C][C]1.5188[/C][C]0.066055[/C][/ROW]
[ROW][C]36[/C][C]0.088333[/C][C]0.8655[/C][C]0.194466[/C][/ROW]
[ROW][C]37[/C][C]0.080547[/C][C]0.7892[/C][C]0.215971[/C][/ROW]
[ROW][C]38[/C][C]0.109272[/C][C]1.0706[/C][C]0.143507[/C][/ROW]
[ROW][C]39[/C][C]0.056812[/C][C]0.5566[/C][C]0.289533[/C][/ROW]
[ROW][C]40[/C][C]-0.054903[/C][C]-0.5379[/C][C]0.295931[/C][/ROW]
[ROW][C]41[/C][C]-0.199822[/C][C]-1.9578[/C][C]0.026576[/C][/ROW]
[ROW][C]42[/C][C]-0.181221[/C][C]-1.7756[/C][C]0.039484[/C][/ROW]
[ROW][C]43[/C][C]-0.153134[/C][C]-1.5004[/C][C]0.068396[/C][/ROW]
[ROW][C]44[/C][C]-0.118832[/C][C]-1.1643[/C][C]0.123591[/C][/ROW]
[ROW][C]45[/C][C]-0.023788[/C][C]-0.2331[/C][C]0.4081[/C][/ROW]
[ROW][C]46[/C][C]0.050728[/C][C]0.497[/C][C]0.310152[/C][/ROW]
[ROW][C]47[/C][C]-0.00541[/C][C]-0.053[/C][C]0.478918[/C][/ROW]
[ROW][C]48[/C][C]0.034096[/C][C]0.3341[/C][C]0.369529[/C][/ROW]
[/TABLE]
Source: https://freestatistics.org/blog/index.php?pk=298544&T=1

Globally Unique Identifier (entire table): ba.freestatistics.org/blog/index.php?pk=298544&T=1

As an alternative you can also use a QR Code:  

The GUIDs for individual cells are displayed in the table below:

Autocorrelation Function
Time lag kACF(k)T-STATP-value
10.4208634.12364e-05
20.3285963.21960.000876
30.2201652.15720.016744
40.2016881.97610.025505
50.0175270.17170.432006
60.0844950.82790.204898
7-0.026207-0.25680.398949
80.072410.70950.239875
90.1308541.28210.101447
100.2944142.88470.002419
110.2629442.57630.005755
120.3328993.26170.000767
130.2217622.17280.016128
140.1995831.95550.026716
150.0770550.7550.226055
16-0.043706-0.42820.33472
17-0.175401-1.71860.044458
18-0.151371-1.48310.070659
19-0.119349-1.16940.122574
20-0.065889-0.64560.260047
210.0548250.53720.296194
220.0635830.6230.267387
230.1024221.00350.159065
240.1812521.77590.039459
250.263862.58530.005617
260.0972920.95330.171424
27-0.004975-0.04870.480613
28-0.084285-0.82580.205476
29-0.061066-0.59830.275517
30-0.216634-2.12260.018182
31-0.126196-1.23650.109651
32-0.07791-0.76340.22356
330.0297730.29170.385567
340.0807360.79110.215432
350.1550071.51880.066055
360.0883330.86550.194466
370.0805470.78920.215971
380.1092721.07060.143507
390.0568120.55660.289533
40-0.054903-0.53790.295931
41-0.199822-1.95780.026576
42-0.181221-1.77560.039484
43-0.153134-1.50040.068396
44-0.118832-1.16430.123591
45-0.023788-0.23310.4081
460.0507280.4970.310152
47-0.00541-0.0530.478918
480.0340960.33410.369529


Partial Autocorrelation Function
Time lag kPACF(k)T-STATP-value
10.4208634.12364e-05
20.1840751.80360.037218
30.0375570.3680.356848
40.0699760.68560.247301
5-0.150524-1.47480.071765
60.0795340.77930.218869
7-0.084311-0.82610.205404
80.1091881.06980.143691
90.1440411.41130.080693
100.226082.21510.014558
110.0974430.95470.171054
120.1038061.01710.155835
13-0.04349-0.42610.335488
14-0.032222-0.31570.376456
15-0.071365-0.69920.24305
16-0.17602-1.72460.043905
17-0.141349-1.38490.084642
18-0.069454-0.68050.24891
190.0330680.3240.373323
200.0022170.02170.491356
210.1260451.2350.109926
22-0.049242-0.48250.315284
23-0.001258-0.01230.495097
240.0594890.58290.280674
250.1853621.81620.036232
26-0.01944-0.19050.424671
27-0.052835-0.51770.302939
28-0.026933-0.26390.396217
290.0606590.59430.276844
30-0.15553-1.52390.065414
31-0.013749-0.13470.446562
320.0569660.55810.289022
330.0332830.32610.372529
340.0433240.42450.336081
35-0.061457-0.60220.274244
36-0.073572-0.72090.236374
37-0.096964-0.950.172237
380.1399041.37080.086821
390.0194920.1910.42447
400.0280590.27490.391985
41-0.173872-1.70360.045846
420.0459350.45010.326838
43-0.027751-0.27190.39314
44-0.049234-0.48240.315314
450.0617370.60490.273336
460.0245730.24080.405124
47-0.097397-0.95430.171167
48-0.066462-0.65120.258239

\begin{tabular}{lllllllll}
\hline
Partial Autocorrelation Function \tabularnewline
Time lag k & PACF(k) & T-STAT & P-value \tabularnewline
1 & 0.420863 & 4.1236 & 4e-05 \tabularnewline
2 & 0.184075 & 1.8036 & 0.037218 \tabularnewline
3 & 0.037557 & 0.368 & 0.356848 \tabularnewline
4 & 0.069976 & 0.6856 & 0.247301 \tabularnewline
5 & -0.150524 & -1.4748 & 0.071765 \tabularnewline
6 & 0.079534 & 0.7793 & 0.218869 \tabularnewline
7 & -0.084311 & -0.8261 & 0.205404 \tabularnewline
8 & 0.109188 & 1.0698 & 0.143691 \tabularnewline
9 & 0.144041 & 1.4113 & 0.080693 \tabularnewline
10 & 0.22608 & 2.2151 & 0.014558 \tabularnewline
11 & 0.097443 & 0.9547 & 0.171054 \tabularnewline
12 & 0.103806 & 1.0171 & 0.155835 \tabularnewline
13 & -0.04349 & -0.4261 & 0.335488 \tabularnewline
14 & -0.032222 & -0.3157 & 0.376456 \tabularnewline
15 & -0.071365 & -0.6992 & 0.24305 \tabularnewline
16 & -0.17602 & -1.7246 & 0.043905 \tabularnewline
17 & -0.141349 & -1.3849 & 0.084642 \tabularnewline
18 & -0.069454 & -0.6805 & 0.24891 \tabularnewline
19 & 0.033068 & 0.324 & 0.373323 \tabularnewline
20 & 0.002217 & 0.0217 & 0.491356 \tabularnewline
21 & 0.126045 & 1.235 & 0.109926 \tabularnewline
22 & -0.049242 & -0.4825 & 0.315284 \tabularnewline
23 & -0.001258 & -0.0123 & 0.495097 \tabularnewline
24 & 0.059489 & 0.5829 & 0.280674 \tabularnewline
25 & 0.185362 & 1.8162 & 0.036232 \tabularnewline
26 & -0.01944 & -0.1905 & 0.424671 \tabularnewline
27 & -0.052835 & -0.5177 & 0.302939 \tabularnewline
28 & -0.026933 & -0.2639 & 0.396217 \tabularnewline
29 & 0.060659 & 0.5943 & 0.276844 \tabularnewline
30 & -0.15553 & -1.5239 & 0.065414 \tabularnewline
31 & -0.013749 & -0.1347 & 0.446562 \tabularnewline
32 & 0.056966 & 0.5581 & 0.289022 \tabularnewline
33 & 0.033283 & 0.3261 & 0.372529 \tabularnewline
34 & 0.043324 & 0.4245 & 0.336081 \tabularnewline
35 & -0.061457 & -0.6022 & 0.274244 \tabularnewline
36 & -0.073572 & -0.7209 & 0.236374 \tabularnewline
37 & -0.096964 & -0.95 & 0.172237 \tabularnewline
38 & 0.139904 & 1.3708 & 0.086821 \tabularnewline
39 & 0.019492 & 0.191 & 0.42447 \tabularnewline
40 & 0.028059 & 0.2749 & 0.391985 \tabularnewline
41 & -0.173872 & -1.7036 & 0.045846 \tabularnewline
42 & 0.045935 & 0.4501 & 0.326838 \tabularnewline
43 & -0.027751 & -0.2719 & 0.39314 \tabularnewline
44 & -0.049234 & -0.4824 & 0.315314 \tabularnewline
45 & 0.061737 & 0.6049 & 0.273336 \tabularnewline
46 & 0.024573 & 0.2408 & 0.405124 \tabularnewline
47 & -0.097397 & -0.9543 & 0.171167 \tabularnewline
48 & -0.066462 & -0.6512 & 0.258239 \tabularnewline
\hline
\end{tabular}
%Source: https://freestatistics.org/blog/index.php?pk=298544&T=2

[TABLE]
[ROW][C]Partial Autocorrelation Function[/C][/ROW]
[ROW][C]Time lag k[/C][C]PACF(k)[/C][C]T-STAT[/C][C]P-value[/C][/ROW]
[ROW][C]1[/C][C]0.420863[/C][C]4.1236[/C][C]4e-05[/C][/ROW]
[ROW][C]2[/C][C]0.184075[/C][C]1.8036[/C][C]0.037218[/C][/ROW]
[ROW][C]3[/C][C]0.037557[/C][C]0.368[/C][C]0.356848[/C][/ROW]
[ROW][C]4[/C][C]0.069976[/C][C]0.6856[/C][C]0.247301[/C][/ROW]
[ROW][C]5[/C][C]-0.150524[/C][C]-1.4748[/C][C]0.071765[/C][/ROW]
[ROW][C]6[/C][C]0.079534[/C][C]0.7793[/C][C]0.218869[/C][/ROW]
[ROW][C]7[/C][C]-0.084311[/C][C]-0.8261[/C][C]0.205404[/C][/ROW]
[ROW][C]8[/C][C]0.109188[/C][C]1.0698[/C][C]0.143691[/C][/ROW]
[ROW][C]9[/C][C]0.144041[/C][C]1.4113[/C][C]0.080693[/C][/ROW]
[ROW][C]10[/C][C]0.22608[/C][C]2.2151[/C][C]0.014558[/C][/ROW]
[ROW][C]11[/C][C]0.097443[/C][C]0.9547[/C][C]0.171054[/C][/ROW]
[ROW][C]12[/C][C]0.103806[/C][C]1.0171[/C][C]0.155835[/C][/ROW]
[ROW][C]13[/C][C]-0.04349[/C][C]-0.4261[/C][C]0.335488[/C][/ROW]
[ROW][C]14[/C][C]-0.032222[/C][C]-0.3157[/C][C]0.376456[/C][/ROW]
[ROW][C]15[/C][C]-0.071365[/C][C]-0.6992[/C][C]0.24305[/C][/ROW]
[ROW][C]16[/C][C]-0.17602[/C][C]-1.7246[/C][C]0.043905[/C][/ROW]
[ROW][C]17[/C][C]-0.141349[/C][C]-1.3849[/C][C]0.084642[/C][/ROW]
[ROW][C]18[/C][C]-0.069454[/C][C]-0.6805[/C][C]0.24891[/C][/ROW]
[ROW][C]19[/C][C]0.033068[/C][C]0.324[/C][C]0.373323[/C][/ROW]
[ROW][C]20[/C][C]0.002217[/C][C]0.0217[/C][C]0.491356[/C][/ROW]
[ROW][C]21[/C][C]0.126045[/C][C]1.235[/C][C]0.109926[/C][/ROW]
[ROW][C]22[/C][C]-0.049242[/C][C]-0.4825[/C][C]0.315284[/C][/ROW]
[ROW][C]23[/C][C]-0.001258[/C][C]-0.0123[/C][C]0.495097[/C][/ROW]
[ROW][C]24[/C][C]0.059489[/C][C]0.5829[/C][C]0.280674[/C][/ROW]
[ROW][C]25[/C][C]0.185362[/C][C]1.8162[/C][C]0.036232[/C][/ROW]
[ROW][C]26[/C][C]-0.01944[/C][C]-0.1905[/C][C]0.424671[/C][/ROW]
[ROW][C]27[/C][C]-0.052835[/C][C]-0.5177[/C][C]0.302939[/C][/ROW]
[ROW][C]28[/C][C]-0.026933[/C][C]-0.2639[/C][C]0.396217[/C][/ROW]
[ROW][C]29[/C][C]0.060659[/C][C]0.5943[/C][C]0.276844[/C][/ROW]
[ROW][C]30[/C][C]-0.15553[/C][C]-1.5239[/C][C]0.065414[/C][/ROW]
[ROW][C]31[/C][C]-0.013749[/C][C]-0.1347[/C][C]0.446562[/C][/ROW]
[ROW][C]32[/C][C]0.056966[/C][C]0.5581[/C][C]0.289022[/C][/ROW]
[ROW][C]33[/C][C]0.033283[/C][C]0.3261[/C][C]0.372529[/C][/ROW]
[ROW][C]34[/C][C]0.043324[/C][C]0.4245[/C][C]0.336081[/C][/ROW]
[ROW][C]35[/C][C]-0.061457[/C][C]-0.6022[/C][C]0.274244[/C][/ROW]
[ROW][C]36[/C][C]-0.073572[/C][C]-0.7209[/C][C]0.236374[/C][/ROW]
[ROW][C]37[/C][C]-0.096964[/C][C]-0.95[/C][C]0.172237[/C][/ROW]
[ROW][C]38[/C][C]0.139904[/C][C]1.3708[/C][C]0.086821[/C][/ROW]
[ROW][C]39[/C][C]0.019492[/C][C]0.191[/C][C]0.42447[/C][/ROW]
[ROW][C]40[/C][C]0.028059[/C][C]0.2749[/C][C]0.391985[/C][/ROW]
[ROW][C]41[/C][C]-0.173872[/C][C]-1.7036[/C][C]0.045846[/C][/ROW]
[ROW][C]42[/C][C]0.045935[/C][C]0.4501[/C][C]0.326838[/C][/ROW]
[ROW][C]43[/C][C]-0.027751[/C][C]-0.2719[/C][C]0.39314[/C][/ROW]
[ROW][C]44[/C][C]-0.049234[/C][C]-0.4824[/C][C]0.315314[/C][/ROW]
[ROW][C]45[/C][C]0.061737[/C][C]0.6049[/C][C]0.273336[/C][/ROW]
[ROW][C]46[/C][C]0.024573[/C][C]0.2408[/C][C]0.405124[/C][/ROW]
[ROW][C]47[/C][C]-0.097397[/C][C]-0.9543[/C][C]0.171167[/C][/ROW]
[ROW][C]48[/C][C]-0.066462[/C][C]-0.6512[/C][C]0.258239[/C][/ROW]
[/TABLE]
Source: https://freestatistics.org/blog/index.php?pk=298544&T=2

Globally Unique Identifier (entire table): ba.freestatistics.org/blog/index.php?pk=298544&T=2

As an alternative you can also use a QR Code:  

The GUIDs for individual cells are displayed in the table below:

Partial Autocorrelation Function
Time lag kPACF(k)T-STATP-value
10.4208634.12364e-05
20.1840751.80360.037218
30.0375570.3680.356848
40.0699760.68560.247301
5-0.150524-1.47480.071765
60.0795340.77930.218869
7-0.084311-0.82610.205404
80.1091881.06980.143691
90.1440411.41130.080693
100.226082.21510.014558
110.0974430.95470.171054
120.1038061.01710.155835
13-0.04349-0.42610.335488
14-0.032222-0.31570.376456
15-0.071365-0.69920.24305
16-0.17602-1.72460.043905
17-0.141349-1.38490.084642
18-0.069454-0.68050.24891
190.0330680.3240.373323
200.0022170.02170.491356
210.1260451.2350.109926
22-0.049242-0.48250.315284
23-0.001258-0.01230.495097
240.0594890.58290.280674
250.1853621.81620.036232
26-0.01944-0.19050.424671
27-0.052835-0.51770.302939
28-0.026933-0.26390.396217
290.0606590.59430.276844
30-0.15553-1.52390.065414
31-0.013749-0.13470.446562
320.0569660.55810.289022
330.0332830.32610.372529
340.0433240.42450.336081
35-0.061457-0.60220.274244
36-0.073572-0.72090.236374
37-0.096964-0.950.172237
380.1399041.37080.086821
390.0194920.1910.42447
400.0280590.27490.391985
41-0.173872-1.70360.045846
420.0459350.45010.326838
43-0.027751-0.27190.39314
44-0.049234-0.48240.315314
450.0617370.60490.273336
460.0245730.24080.405124
47-0.097397-0.95430.171167
48-0.066462-0.65120.258239


Parameters (Session):
par4 = 12 ;
Parameters (R input):
par1 = 48 ; par2 = -1.5 ; par3 = 0 ; par4 = 0 ; par5 = 12 ; par6 = White Noise ; par7 = 0.95 ; par8 = ;
R code (references can be found in the software module):
par8 <- ''
par7 <- '0.95'
par6 <- 'White Noise'
par5 <- '12'
par4 <- '1'
par3 <- '0'
par2 <- '-1.5'
par1 <- '48'
if (par1 == 'Default') {
par1 = 10*log10(length(x))
} else {
par1 <- as.numeric(par1)
}
par2 <- as.numeric(par2)
par3 <- as.numeric(par3)
par4 <- as.numeric(par4)
par5 <- as.numeric(par5)
if (par6 == 'White Noise') par6 <- 'white' else par6 <- 'ma'
par7 <- as.numeric(par7)
if (par8 != '') par8 <- as.numeric(par8)
x <- na.omit(x)
ox <- x
if (par8 == '') {
if (par2 == 0) {
x <- log(x)
} else {
x <- (x ^ par2 - 1) / par2
}
} else {
x <- log(x,base=par8)
}
if (par3 > 0) x <- diff(x,lag=1,difference=par3)
if (par4 > 0) x <- diff(x,lag=par5,difference=par4)
bitmap(file='picts.png')
op <- par(mfrow=c(2,1))
plot(ox,type='l',main='Original Time Series',xlab='time',ylab='value')
if (par8=='') {
mytitle <- paste('Working Time Series (lambda=',par2,', d=',par3,', D=',par4,')',sep='')
mysub <- paste('(lambda=',par2,', d=',par3,', D=',par4,', CI=', par7, ', CI type=',par6,')',sep='')
} else {
mytitle <- paste('Working Time Series (base=',par8,', d=',par3,', D=',par4,')',sep='')
mysub <- paste('(base=',par8,', d=',par3,', D=',par4,', CI=', par7, ', CI type=',par6,')',sep='')
}
plot(x,type='l', main=mytitle,xlab='time',ylab='value')
par(op)
dev.off()
bitmap(file='pic1.png')
racf <- acf(x, par1, main='Autocorrelation', xlab='time lag', ylab='ACF', ci.type=par6, ci=par7, sub=mysub)
dev.off()
bitmap(file='pic2.png')
rpacf <- pacf(x,par1,main='Partial Autocorrelation',xlab='lags',ylab='PACF',sub=mysub)
dev.off()
(myacf <- c(racf$acf))
(mypacf <- c(rpacf$acf))
lengthx <- length(x)
sqrtn <- sqrt(lengthx)
load(file='createtable')
a<-table.start()
a<-table.row.start(a)
a<-table.element(a,'Autocorrelation Function',4,TRUE)
a<-table.row.end(a)
a<-table.row.start(a)
a<-table.element(a,'Time lag k',header=TRUE)
a<-table.element(a,'ACF(k)',header=TRUE)
a<-table.element(a,'T-STAT',header=TRUE)
a<-table.element(a,'P-value',header=TRUE)
a<-table.row.end(a)
for (i in 2:(par1+1)) {
a<-table.row.start(a)
a<-table.element(a,i-1,header=TRUE)
a<-table.element(a,round(myacf[i],6))
mytstat <- myacf[i]*sqrtn
a<-table.element(a,round(mytstat,4))
a<-table.element(a,round(1-pt(abs(mytstat),lengthx),6))
a<-table.row.end(a)
}
a<-table.end(a)
table.save(a,file='mytable.tab')
a<-table.start()
a<-table.row.start(a)
a<-table.element(a,'Partial Autocorrelation Function',4,TRUE)
a<-table.row.end(a)
a<-table.row.start(a)
a<-table.element(a,'Time lag k',header=TRUE)
a<-table.element(a,'PACF(k)',header=TRUE)
a<-table.element(a,'T-STAT',header=TRUE)
a<-table.element(a,'P-value',header=TRUE)
a<-table.row.end(a)
for (i in 1:par1) {
a<-table.row.start(a)
a<-table.element(a,i,header=TRUE)
a<-table.element(a,round(mypacf[i],6))
mytstat <- mypacf[i]*sqrtn
a<-table.element(a,round(mytstat,4))
a<-table.element(a,round(1-pt(abs(mytstat),lengthx),6))
a<-table.row.end(a)
}
a<-table.end(a)
table.save(a,file='mytable1.tab')