Free Statistics

of Irreproducible Research!

Author's title

Author*The author of this computation has been verified*
R Software Modulerwasp_autocorrelation.wasp
Title produced by software(Partial) Autocorrelation Function
Date of computationFri, 09 Dec 2016 08:57:23 +0100
Cite this page as followsStatistical Computations at FreeStatistics.org, Office for Research Development and Education, URL https://freestatistics.org/blog/index.php?v=date/2016/Dec/09/t1481270272c1bu77h6npkc2n3.htm/, Retrieved Sat, 18 May 2024 05:42:27 +0000
Statistical Computations at FreeStatistics.org, Office for Research Development and Education, URL https://freestatistics.org/blog/index.php?pk=298426, Retrieved Sat, 18 May 2024 05:42:27 +0000
QR Codes:

Original text written by user:
IsPrivate?No (this computation is public)
User-defined keywords
Estimated Impact98
Family? (F = Feedback message, R = changed R code, M = changed R Module, P = changed Parameters, D = changed Data)
-       [(Partial) Autocorrelation Function] [] [2016-12-09 07:57:23] [94ac3c9a028ddd47e8862e80eac9f626] [Current]
Feedback Forum

Post a new message
Dataseries X:
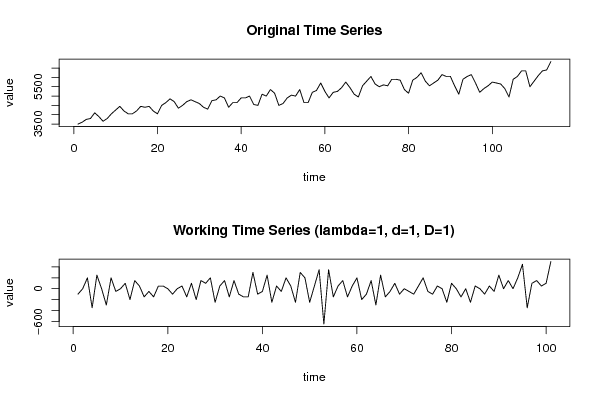
3500
3600
3750
3800
4100
3900
3650
3800
4050
4250
4450
4200
4050
4050
4200
4450
4400
4450
4200
4050
4500
4650
4850
4700
4350
4500
4700
4800
4700
4600
4400
4300
4750
4800
5000
4900
4400
4650
4650
4900
4900
5000
4550
4500
5100
5000
5350
5150
4500
4600
4900
5050
5000
5350
4650
4650
5200
5300
5700
5250
4900
5200
5250
5450
5750
5450
5100
4950
5550
5800
6050
5650
5500
5600
5550
5900
5900
5850
5350
5150
5850
6000
6250
5800
5550
5700
5850
6150
6050
6050
5550
5100
5900
6050
6150
5700
5200
5400
5550
5750
5700
5650
5400
4950
5900
6050
6350
6350
5500
5800
6100
6350
6400
6850


Summary of computational transaction
Raw Input view raw input (R code)
Raw Outputview raw output of R engine
Computing time1 seconds
R ServerBig Analytics Cloud Computing Center

\begin{tabular}{lllllllll}
\hline
Summary of computational transaction \tabularnewline
Raw Input view raw input (R code)  \tabularnewline
Raw Outputview raw output of R engine  \tabularnewline
Computing time1 seconds \tabularnewline
R ServerBig Analytics Cloud Computing Center \tabularnewline
\hline
\end{tabular}
%Source: https://freestatistics.org/blog/index.php?pk=298426&T=0

[TABLE]
[ROW]
Summary of computational transaction[/C][/ROW] [ROW]Raw Input[/C] view raw input (R code) [/C][/ROW] [ROW]Raw Output[/C]view raw output of R engine [/C][/ROW] [ROW]Computing time[/C]1 seconds[/C][/ROW] [ROW]R Server[/C]Big Analytics Cloud Computing Center[/C][/ROW] [/TABLE] Source: https://freestatistics.org/blog/index.php?pk=298426&T=0

Globally Unique Identifier (entire table): ba.freestatistics.org/blog/index.php?pk=298426&T=0

As an alternative you can also use a QR Code:  

The GUIDs for individual cells are displayed in the table below:

Summary of computational transaction
Raw Input view raw input (R code)
Raw Outputview raw output of R engine
Computing time1 seconds
R ServerBig Analytics Cloud Computing Center


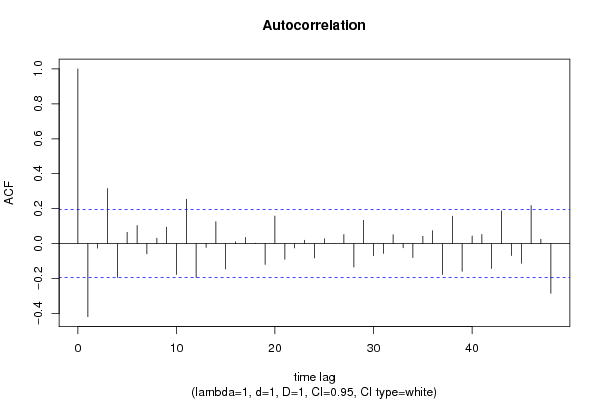
Autocorrelation Function
Time lag kACF(k)T-STATP-value
1-0.418579-4.20672.8e-05
2-0.02598-0.26110.397275
30.3148243.16390.001028
4-0.194615-1.95590.026622
50.0642260.64550.260046
60.1038951.04410.149458
7-0.058671-0.58960.278377
80.0308260.30980.378677
90.09380.94270.174046
10-0.17659-1.77470.03948
110.2534182.54680.00619
12-0.193935-1.9490.027033
13-0.022119-0.22230.412266
140.1247571.25380.106405
15-0.144921-1.45640.074186
160.0104740.10530.458188
170.0352120.35390.362085
180.0018150.01820.492743
19-0.11913-1.19720.117006
200.1571041.57890.058746
21-0.089553-0.90.185131
22-0.024829-0.24950.401731
230.0187920.18890.425294
24-0.081993-0.8240.205934
250.0268360.26970.393972
26-0.000149-0.00150.499404
270.0513730.51630.30339
28-0.134382-1.35050.089934
290.1330721.33740.092055
30-0.070047-0.7040.241538
31-0.056123-0.5640.286993
320.0505060.50760.306428
33-0.024062-0.24180.404706
34-0.080081-0.80480.21141
350.0413840.41590.339181
360.0738130.74180.229961
37-0.176867-1.77750.039248
380.1568631.57650.059024
39-0.15846-1.59250.057199
400.0436910.43910.330768
410.0518420.5210.301753
42-0.142642-1.43350.077396
430.1868761.87810.031627
44-0.068038-0.68380.247841
45-0.112867-1.13430.129678
460.2173852.18470.015612
470.024440.24560.403236
48-0.284615-2.86030.002571

\begin{tabular}{lllllllll}
\hline
Autocorrelation Function \tabularnewline
Time lag k & ACF(k) & T-STAT & P-value \tabularnewline
1 & -0.418579 & -4.2067 & 2.8e-05 \tabularnewline
2 & -0.02598 & -0.2611 & 0.397275 \tabularnewline
3 & 0.314824 & 3.1639 & 0.001028 \tabularnewline
4 & -0.194615 & -1.9559 & 0.026622 \tabularnewline
5 & 0.064226 & 0.6455 & 0.260046 \tabularnewline
6 & 0.103895 & 1.0441 & 0.149458 \tabularnewline
7 & -0.058671 & -0.5896 & 0.278377 \tabularnewline
8 & 0.030826 & 0.3098 & 0.378677 \tabularnewline
9 & 0.0938 & 0.9427 & 0.174046 \tabularnewline
10 & -0.17659 & -1.7747 & 0.03948 \tabularnewline
11 & 0.253418 & 2.5468 & 0.00619 \tabularnewline
12 & -0.193935 & -1.949 & 0.027033 \tabularnewline
13 & -0.022119 & -0.2223 & 0.412266 \tabularnewline
14 & 0.124757 & 1.2538 & 0.106405 \tabularnewline
15 & -0.144921 & -1.4564 & 0.074186 \tabularnewline
16 & 0.010474 & 0.1053 & 0.458188 \tabularnewline
17 & 0.035212 & 0.3539 & 0.362085 \tabularnewline
18 & 0.001815 & 0.0182 & 0.492743 \tabularnewline
19 & -0.11913 & -1.1972 & 0.117006 \tabularnewline
20 & 0.157104 & 1.5789 & 0.058746 \tabularnewline
21 & -0.089553 & -0.9 & 0.185131 \tabularnewline
22 & -0.024829 & -0.2495 & 0.401731 \tabularnewline
23 & 0.018792 & 0.1889 & 0.425294 \tabularnewline
24 & -0.081993 & -0.824 & 0.205934 \tabularnewline
25 & 0.026836 & 0.2697 & 0.393972 \tabularnewline
26 & -0.000149 & -0.0015 & 0.499404 \tabularnewline
27 & 0.051373 & 0.5163 & 0.30339 \tabularnewline
28 & -0.134382 & -1.3505 & 0.089934 \tabularnewline
29 & 0.133072 & 1.3374 & 0.092055 \tabularnewline
30 & -0.070047 & -0.704 & 0.241538 \tabularnewline
31 & -0.056123 & -0.564 & 0.286993 \tabularnewline
32 & 0.050506 & 0.5076 & 0.306428 \tabularnewline
33 & -0.024062 & -0.2418 & 0.404706 \tabularnewline
34 & -0.080081 & -0.8048 & 0.21141 \tabularnewline
35 & 0.041384 & 0.4159 & 0.339181 \tabularnewline
36 & 0.073813 & 0.7418 & 0.229961 \tabularnewline
37 & -0.176867 & -1.7775 & 0.039248 \tabularnewline
38 & 0.156863 & 1.5765 & 0.059024 \tabularnewline
39 & -0.15846 & -1.5925 & 0.057199 \tabularnewline
40 & 0.043691 & 0.4391 & 0.330768 \tabularnewline
41 & 0.051842 & 0.521 & 0.301753 \tabularnewline
42 & -0.142642 & -1.4335 & 0.077396 \tabularnewline
43 & 0.186876 & 1.8781 & 0.031627 \tabularnewline
44 & -0.068038 & -0.6838 & 0.247841 \tabularnewline
45 & -0.112867 & -1.1343 & 0.129678 \tabularnewline
46 & 0.217385 & 2.1847 & 0.015612 \tabularnewline
47 & 0.02444 & 0.2456 & 0.403236 \tabularnewline
48 & -0.284615 & -2.8603 & 0.002571 \tabularnewline
\hline
\end{tabular}
%Source: https://freestatistics.org/blog/index.php?pk=298426&T=1

[TABLE]
[ROW][C]Autocorrelation Function[/C][/ROW]
[ROW][C]Time lag k[/C][C]ACF(k)[/C][C]T-STAT[/C][C]P-value[/C][/ROW]
[ROW][C]1[/C][C]-0.418579[/C][C]-4.2067[/C][C]2.8e-05[/C][/ROW]
[ROW][C]2[/C][C]-0.02598[/C][C]-0.2611[/C][C]0.397275[/C][/ROW]
[ROW][C]3[/C][C]0.314824[/C][C]3.1639[/C][C]0.001028[/C][/ROW]
[ROW][C]4[/C][C]-0.194615[/C][C]-1.9559[/C][C]0.026622[/C][/ROW]
[ROW][C]5[/C][C]0.064226[/C][C]0.6455[/C][C]0.260046[/C][/ROW]
[ROW][C]6[/C][C]0.103895[/C][C]1.0441[/C][C]0.149458[/C][/ROW]
[ROW][C]7[/C][C]-0.058671[/C][C]-0.5896[/C][C]0.278377[/C][/ROW]
[ROW][C]8[/C][C]0.030826[/C][C]0.3098[/C][C]0.378677[/C][/ROW]
[ROW][C]9[/C][C]0.0938[/C][C]0.9427[/C][C]0.174046[/C][/ROW]
[ROW][C]10[/C][C]-0.17659[/C][C]-1.7747[/C][C]0.03948[/C][/ROW]
[ROW][C]11[/C][C]0.253418[/C][C]2.5468[/C][C]0.00619[/C][/ROW]
[ROW][C]12[/C][C]-0.193935[/C][C]-1.949[/C][C]0.027033[/C][/ROW]
[ROW][C]13[/C][C]-0.022119[/C][C]-0.2223[/C][C]0.412266[/C][/ROW]
[ROW][C]14[/C][C]0.124757[/C][C]1.2538[/C][C]0.106405[/C][/ROW]
[ROW][C]15[/C][C]-0.144921[/C][C]-1.4564[/C][C]0.074186[/C][/ROW]
[ROW][C]16[/C][C]0.010474[/C][C]0.1053[/C][C]0.458188[/C][/ROW]
[ROW][C]17[/C][C]0.035212[/C][C]0.3539[/C][C]0.362085[/C][/ROW]
[ROW][C]18[/C][C]0.001815[/C][C]0.0182[/C][C]0.492743[/C][/ROW]
[ROW][C]19[/C][C]-0.11913[/C][C]-1.1972[/C][C]0.117006[/C][/ROW]
[ROW][C]20[/C][C]0.157104[/C][C]1.5789[/C][C]0.058746[/C][/ROW]
[ROW][C]21[/C][C]-0.089553[/C][C]-0.9[/C][C]0.185131[/C][/ROW]
[ROW][C]22[/C][C]-0.024829[/C][C]-0.2495[/C][C]0.401731[/C][/ROW]
[ROW][C]23[/C][C]0.018792[/C][C]0.1889[/C][C]0.425294[/C][/ROW]
[ROW][C]24[/C][C]-0.081993[/C][C]-0.824[/C][C]0.205934[/C][/ROW]
[ROW][C]25[/C][C]0.026836[/C][C]0.2697[/C][C]0.393972[/C][/ROW]
[ROW][C]26[/C][C]-0.000149[/C][C]-0.0015[/C][C]0.499404[/C][/ROW]
[ROW][C]27[/C][C]0.051373[/C][C]0.5163[/C][C]0.30339[/C][/ROW]
[ROW][C]28[/C][C]-0.134382[/C][C]-1.3505[/C][C]0.089934[/C][/ROW]
[ROW][C]29[/C][C]0.133072[/C][C]1.3374[/C][C]0.092055[/C][/ROW]
[ROW][C]30[/C][C]-0.070047[/C][C]-0.704[/C][C]0.241538[/C][/ROW]
[ROW][C]31[/C][C]-0.056123[/C][C]-0.564[/C][C]0.286993[/C][/ROW]
[ROW][C]32[/C][C]0.050506[/C][C]0.5076[/C][C]0.306428[/C][/ROW]
[ROW][C]33[/C][C]-0.024062[/C][C]-0.2418[/C][C]0.404706[/C][/ROW]
[ROW][C]34[/C][C]-0.080081[/C][C]-0.8048[/C][C]0.21141[/C][/ROW]
[ROW][C]35[/C][C]0.041384[/C][C]0.4159[/C][C]0.339181[/C][/ROW]
[ROW][C]36[/C][C]0.073813[/C][C]0.7418[/C][C]0.229961[/C][/ROW]
[ROW][C]37[/C][C]-0.176867[/C][C]-1.7775[/C][C]0.039248[/C][/ROW]
[ROW][C]38[/C][C]0.156863[/C][C]1.5765[/C][C]0.059024[/C][/ROW]
[ROW][C]39[/C][C]-0.15846[/C][C]-1.5925[/C][C]0.057199[/C][/ROW]
[ROW][C]40[/C][C]0.043691[/C][C]0.4391[/C][C]0.330768[/C][/ROW]
[ROW][C]41[/C][C]0.051842[/C][C]0.521[/C][C]0.301753[/C][/ROW]
[ROW][C]42[/C][C]-0.142642[/C][C]-1.4335[/C][C]0.077396[/C][/ROW]
[ROW][C]43[/C][C]0.186876[/C][C]1.8781[/C][C]0.031627[/C][/ROW]
[ROW][C]44[/C][C]-0.068038[/C][C]-0.6838[/C][C]0.247841[/C][/ROW]
[ROW][C]45[/C][C]-0.112867[/C][C]-1.1343[/C][C]0.129678[/C][/ROW]
[ROW][C]46[/C][C]0.217385[/C][C]2.1847[/C][C]0.015612[/C][/ROW]
[ROW][C]47[/C][C]0.02444[/C][C]0.2456[/C][C]0.403236[/C][/ROW]
[ROW][C]48[/C][C]-0.284615[/C][C]-2.8603[/C][C]0.002571[/C][/ROW]
[/TABLE]
Source: https://freestatistics.org/blog/index.php?pk=298426&T=1

Globally Unique Identifier (entire table): ba.freestatistics.org/blog/index.php?pk=298426&T=1

As an alternative you can also use a QR Code:  

The GUIDs for individual cells are displayed in the table below:

Autocorrelation Function
Time lag kACF(k)T-STATP-value
1-0.418579-4.20672.8e-05
2-0.02598-0.26110.397275
30.3148243.16390.001028
4-0.194615-1.95590.026622
50.0642260.64550.260046
60.1038951.04410.149458
7-0.058671-0.58960.278377
80.0308260.30980.378677
90.09380.94270.174046
10-0.17659-1.77470.03948
110.2534182.54680.00619
12-0.193935-1.9490.027033
13-0.022119-0.22230.412266
140.1247571.25380.106405
15-0.144921-1.45640.074186
160.0104740.10530.458188
170.0352120.35390.362085
180.0018150.01820.492743
19-0.11913-1.19720.117006
200.1571041.57890.058746
21-0.089553-0.90.185131
22-0.024829-0.24950.401731
230.0187920.18890.425294
24-0.081993-0.8240.205934
250.0268360.26970.393972
26-0.000149-0.00150.499404
270.0513730.51630.30339
28-0.134382-1.35050.089934
290.1330721.33740.092055
30-0.070047-0.7040.241538
31-0.056123-0.5640.286993
320.0505060.50760.306428
33-0.024062-0.24180.404706
34-0.080081-0.80480.21141
350.0413840.41590.339181
360.0738130.74180.229961
37-0.176867-1.77750.039248
380.1568631.57650.059024
39-0.15846-1.59250.057199
400.0436910.43910.330768
410.0518420.5210.301753
42-0.142642-1.43350.077396
430.1868761.87810.031627
44-0.068038-0.68380.247841
45-0.112867-1.13430.129678
460.2173852.18470.015612
470.024440.24560.403236
48-0.284615-2.86030.002571


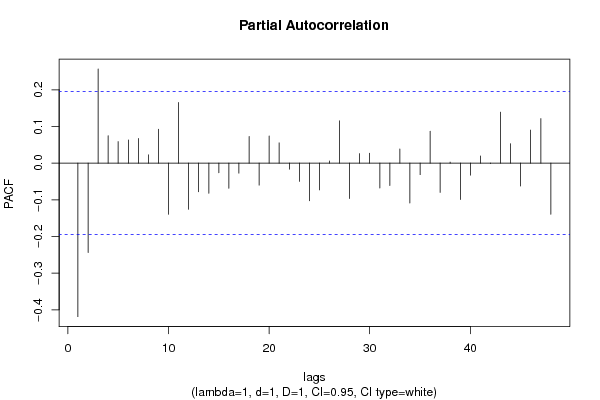
Partial Autocorrelation Function
Time lag kPACF(k)T-STATP-value
1-0.418579-4.20672.8e-05
2-0.243927-2.45140.007973
30.2567872.58070.005649
40.0748180.75190.226926
50.0587470.59040.278121
60.063230.63550.263284
70.0671310.67470.250716
80.0225760.22690.410486
90.0922160.92680.178131
10-0.139285-1.39980.082319
110.1652781.6610.049905
12-0.125638-1.26270.104811
13-0.077959-0.78350.21759
14-0.08226-0.82670.205176
15-0.026468-0.2660.395389
16-0.068659-0.690.245885
17-0.027238-0.27370.392423
180.0728470.73210.2329
19-0.060073-0.60370.27369
200.0738130.74180.229963
210.0552590.55530.289944
22-0.016327-0.16410.434995
23-0.04972-0.49970.309195
24-0.102451-1.02960.152823
25-0.073043-0.73410.232301
260.0057950.05820.476836
270.1153371.15910.12457
28-0.096639-0.97120.166883
290.0259590.26090.397356
300.0270360.27170.393199
31-0.067772-0.68110.248685
32-0.061103-0.61410.270273
330.0387590.38950.348854
34-0.108962-1.09510.138049
35-0.03134-0.3150.37672
360.0869930.87430.192023
37-0.079703-0.8010.212504
380.0027630.02780.488953
39-0.099093-0.99590.160846
40-0.032744-0.32910.371389
410.0193220.19420.423212
42-0.000942-0.00950.496233
430.1390041.3970.082742
440.0527290.52990.298664
45-0.062464-0.62780.265791
460.0900120.90460.183912
470.1214561.22060.112536
48-0.139512-1.40210.081978

\begin{tabular}{lllllllll}
\hline
Partial Autocorrelation Function \tabularnewline
Time lag k & PACF(k) & T-STAT & P-value \tabularnewline
1 & -0.418579 & -4.2067 & 2.8e-05 \tabularnewline
2 & -0.243927 & -2.4514 & 0.007973 \tabularnewline
3 & 0.256787 & 2.5807 & 0.005649 \tabularnewline
4 & 0.074818 & 0.7519 & 0.226926 \tabularnewline
5 & 0.058747 & 0.5904 & 0.278121 \tabularnewline
6 & 0.06323 & 0.6355 & 0.263284 \tabularnewline
7 & 0.067131 & 0.6747 & 0.250716 \tabularnewline
8 & 0.022576 & 0.2269 & 0.410486 \tabularnewline
9 & 0.092216 & 0.9268 & 0.178131 \tabularnewline
10 & -0.139285 & -1.3998 & 0.082319 \tabularnewline
11 & 0.165278 & 1.661 & 0.049905 \tabularnewline
12 & -0.125638 & -1.2627 & 0.104811 \tabularnewline
13 & -0.077959 & -0.7835 & 0.21759 \tabularnewline
14 & -0.08226 & -0.8267 & 0.205176 \tabularnewline
15 & -0.026468 & -0.266 & 0.395389 \tabularnewline
16 & -0.068659 & -0.69 & 0.245885 \tabularnewline
17 & -0.027238 & -0.2737 & 0.392423 \tabularnewline
18 & 0.072847 & 0.7321 & 0.2329 \tabularnewline
19 & -0.060073 & -0.6037 & 0.27369 \tabularnewline
20 & 0.073813 & 0.7418 & 0.229963 \tabularnewline
21 & 0.055259 & 0.5553 & 0.289944 \tabularnewline
22 & -0.016327 & -0.1641 & 0.434995 \tabularnewline
23 & -0.04972 & -0.4997 & 0.309195 \tabularnewline
24 & -0.102451 & -1.0296 & 0.152823 \tabularnewline
25 & -0.073043 & -0.7341 & 0.232301 \tabularnewline
26 & 0.005795 & 0.0582 & 0.476836 \tabularnewline
27 & 0.115337 & 1.1591 & 0.12457 \tabularnewline
28 & -0.096639 & -0.9712 & 0.166883 \tabularnewline
29 & 0.025959 & 0.2609 & 0.397356 \tabularnewline
30 & 0.027036 & 0.2717 & 0.393199 \tabularnewline
31 & -0.067772 & -0.6811 & 0.248685 \tabularnewline
32 & -0.061103 & -0.6141 & 0.270273 \tabularnewline
33 & 0.038759 & 0.3895 & 0.348854 \tabularnewline
34 & -0.108962 & -1.0951 & 0.138049 \tabularnewline
35 & -0.03134 & -0.315 & 0.37672 \tabularnewline
36 & 0.086993 & 0.8743 & 0.192023 \tabularnewline
37 & -0.079703 & -0.801 & 0.212504 \tabularnewline
38 & 0.002763 & 0.0278 & 0.488953 \tabularnewline
39 & -0.099093 & -0.9959 & 0.160846 \tabularnewline
40 & -0.032744 & -0.3291 & 0.371389 \tabularnewline
41 & 0.019322 & 0.1942 & 0.423212 \tabularnewline
42 & -0.000942 & -0.0095 & 0.496233 \tabularnewline
43 & 0.139004 & 1.397 & 0.082742 \tabularnewline
44 & 0.052729 & 0.5299 & 0.298664 \tabularnewline
45 & -0.062464 & -0.6278 & 0.265791 \tabularnewline
46 & 0.090012 & 0.9046 & 0.183912 \tabularnewline
47 & 0.121456 & 1.2206 & 0.112536 \tabularnewline
48 & -0.139512 & -1.4021 & 0.081978 \tabularnewline
\hline
\end{tabular}
%Source: https://freestatistics.org/blog/index.php?pk=298426&T=2

[TABLE]
[ROW][C]Partial Autocorrelation Function[/C][/ROW]
[ROW][C]Time lag k[/C][C]PACF(k)[/C][C]T-STAT[/C][C]P-value[/C][/ROW]
[ROW][C]1[/C][C]-0.418579[/C][C]-4.2067[/C][C]2.8e-05[/C][/ROW]
[ROW][C]2[/C][C]-0.243927[/C][C]-2.4514[/C][C]0.007973[/C][/ROW]
[ROW][C]3[/C][C]0.256787[/C][C]2.5807[/C][C]0.005649[/C][/ROW]
[ROW][C]4[/C][C]0.074818[/C][C]0.7519[/C][C]0.226926[/C][/ROW]
[ROW][C]5[/C][C]0.058747[/C][C]0.5904[/C][C]0.278121[/C][/ROW]
[ROW][C]6[/C][C]0.06323[/C][C]0.6355[/C][C]0.263284[/C][/ROW]
[ROW][C]7[/C][C]0.067131[/C][C]0.6747[/C][C]0.250716[/C][/ROW]
[ROW][C]8[/C][C]0.022576[/C][C]0.2269[/C][C]0.410486[/C][/ROW]
[ROW][C]9[/C][C]0.092216[/C][C]0.9268[/C][C]0.178131[/C][/ROW]
[ROW][C]10[/C][C]-0.139285[/C][C]-1.3998[/C][C]0.082319[/C][/ROW]
[ROW][C]11[/C][C]0.165278[/C][C]1.661[/C][C]0.049905[/C][/ROW]
[ROW][C]12[/C][C]-0.125638[/C][C]-1.2627[/C][C]0.104811[/C][/ROW]
[ROW][C]13[/C][C]-0.077959[/C][C]-0.7835[/C][C]0.21759[/C][/ROW]
[ROW][C]14[/C][C]-0.08226[/C][C]-0.8267[/C][C]0.205176[/C][/ROW]
[ROW][C]15[/C][C]-0.026468[/C][C]-0.266[/C][C]0.395389[/C][/ROW]
[ROW][C]16[/C][C]-0.068659[/C][C]-0.69[/C][C]0.245885[/C][/ROW]
[ROW][C]17[/C][C]-0.027238[/C][C]-0.2737[/C][C]0.392423[/C][/ROW]
[ROW][C]18[/C][C]0.072847[/C][C]0.7321[/C][C]0.2329[/C][/ROW]
[ROW][C]19[/C][C]-0.060073[/C][C]-0.6037[/C][C]0.27369[/C][/ROW]
[ROW][C]20[/C][C]0.073813[/C][C]0.7418[/C][C]0.229963[/C][/ROW]
[ROW][C]21[/C][C]0.055259[/C][C]0.5553[/C][C]0.289944[/C][/ROW]
[ROW][C]22[/C][C]-0.016327[/C][C]-0.1641[/C][C]0.434995[/C][/ROW]
[ROW][C]23[/C][C]-0.04972[/C][C]-0.4997[/C][C]0.309195[/C][/ROW]
[ROW][C]24[/C][C]-0.102451[/C][C]-1.0296[/C][C]0.152823[/C][/ROW]
[ROW][C]25[/C][C]-0.073043[/C][C]-0.7341[/C][C]0.232301[/C][/ROW]
[ROW][C]26[/C][C]0.005795[/C][C]0.0582[/C][C]0.476836[/C][/ROW]
[ROW][C]27[/C][C]0.115337[/C][C]1.1591[/C][C]0.12457[/C][/ROW]
[ROW][C]28[/C][C]-0.096639[/C][C]-0.9712[/C][C]0.166883[/C][/ROW]
[ROW][C]29[/C][C]0.025959[/C][C]0.2609[/C][C]0.397356[/C][/ROW]
[ROW][C]30[/C][C]0.027036[/C][C]0.2717[/C][C]0.393199[/C][/ROW]
[ROW][C]31[/C][C]-0.067772[/C][C]-0.6811[/C][C]0.248685[/C][/ROW]
[ROW][C]32[/C][C]-0.061103[/C][C]-0.6141[/C][C]0.270273[/C][/ROW]
[ROW][C]33[/C][C]0.038759[/C][C]0.3895[/C][C]0.348854[/C][/ROW]
[ROW][C]34[/C][C]-0.108962[/C][C]-1.0951[/C][C]0.138049[/C][/ROW]
[ROW][C]35[/C][C]-0.03134[/C][C]-0.315[/C][C]0.37672[/C][/ROW]
[ROW][C]36[/C][C]0.086993[/C][C]0.8743[/C][C]0.192023[/C][/ROW]
[ROW][C]37[/C][C]-0.079703[/C][C]-0.801[/C][C]0.212504[/C][/ROW]
[ROW][C]38[/C][C]0.002763[/C][C]0.0278[/C][C]0.488953[/C][/ROW]
[ROW][C]39[/C][C]-0.099093[/C][C]-0.9959[/C][C]0.160846[/C][/ROW]
[ROW][C]40[/C][C]-0.032744[/C][C]-0.3291[/C][C]0.371389[/C][/ROW]
[ROW][C]41[/C][C]0.019322[/C][C]0.1942[/C][C]0.423212[/C][/ROW]
[ROW][C]42[/C][C]-0.000942[/C][C]-0.0095[/C][C]0.496233[/C][/ROW]
[ROW][C]43[/C][C]0.139004[/C][C]1.397[/C][C]0.082742[/C][/ROW]
[ROW][C]44[/C][C]0.052729[/C][C]0.5299[/C][C]0.298664[/C][/ROW]
[ROW][C]45[/C][C]-0.062464[/C][C]-0.6278[/C][C]0.265791[/C][/ROW]
[ROW][C]46[/C][C]0.090012[/C][C]0.9046[/C][C]0.183912[/C][/ROW]
[ROW][C]47[/C][C]0.121456[/C][C]1.2206[/C][C]0.112536[/C][/ROW]
[ROW][C]48[/C][C]-0.139512[/C][C]-1.4021[/C][C]0.081978[/C][/ROW]
[/TABLE]
Source: https://freestatistics.org/blog/index.php?pk=298426&T=2

Globally Unique Identifier (entire table): ba.freestatistics.org/blog/index.php?pk=298426&T=2

As an alternative you can also use a QR Code:  

The GUIDs for individual cells are displayed in the table below:

Partial Autocorrelation Function
Time lag kPACF(k)T-STATP-value
1-0.418579-4.20672.8e-05
2-0.243927-2.45140.007973
30.2567872.58070.005649
40.0748180.75190.226926
50.0587470.59040.278121
60.063230.63550.263284
70.0671310.67470.250716
80.0225760.22690.410486
90.0922160.92680.178131
10-0.139285-1.39980.082319
110.1652781.6610.049905
12-0.125638-1.26270.104811
13-0.077959-0.78350.21759
14-0.08226-0.82670.205176
15-0.026468-0.2660.395389
16-0.068659-0.690.245885
17-0.027238-0.27370.392423
180.0728470.73210.2329
19-0.060073-0.60370.27369
200.0738130.74180.229963
210.0552590.55530.289944
22-0.016327-0.16410.434995
23-0.04972-0.49970.309195
24-0.102451-1.02960.152823
25-0.073043-0.73410.232301
260.0057950.05820.476836
270.1153371.15910.12457
28-0.096639-0.97120.166883
290.0259590.26090.397356
300.0270360.27170.393199
31-0.067772-0.68110.248685
32-0.061103-0.61410.270273
330.0387590.38950.348854
34-0.108962-1.09510.138049
35-0.03134-0.3150.37672
360.0869930.87430.192023
37-0.079703-0.8010.212504
380.0027630.02780.488953
39-0.099093-0.99590.160846
40-0.032744-0.32910.371389
410.0193220.19420.423212
42-0.000942-0.00950.496233
430.1390041.3970.082742
440.0527290.52990.298664
45-0.062464-0.62780.265791
460.0900120.90460.183912
470.1214561.22060.112536
48-0.139512-1.40210.081978


Parameters (Session):
par1 = 48 ; par2 = 1 ; par3 = 1 ; par4 = 1 ; par5 = 12 ; par6 = White Noise ; par7 = 0.95 ;
Parameters (R input):
par1 = 48 ; par2 = 1 ; par3 = 1 ; par4 = 1 ; par5 = 12 ; par6 = White Noise ; par7 = 0.95 ; par8 = ;
R code (references can be found in the software module):
if (par1 == 'Default') {
par1 = 10*log10(length(x))
} else {
par1 <- as.numeric(par1)
}
par2 <- as.numeric(par2)
par3 <- as.numeric(par3)
par4 <- as.numeric(par4)
par5 <- as.numeric(par5)
if (par6 == 'White Noise') par6 <- 'white' else par6 <- 'ma'
par7 <- as.numeric(par7)
if (par8 != '') par8 <- as.numeric(par8)
x <- na.omit(x)
ox <- x
if (par8 == '') {
if (par2 == 0) {
x <- log(x)
} else {
x <- (x ^ par2 - 1) / par2
}
} else {
x <- log(x,base=par8)
}
if (par3 > 0) x <- diff(x,lag=1,difference=par3)
if (par4 > 0) x <- diff(x,lag=par5,difference=par4)
bitmap(file='picts.png')
op <- par(mfrow=c(2,1))
plot(ox,type='l',main='Original Time Series',xlab='time',ylab='value')
if (par8=='') {
mytitle <- paste('Working Time Series (lambda=',par2,', d=',par3,', D=',par4,')',sep='')
mysub <- paste('(lambda=',par2,', d=',par3,', D=',par4,', CI=', par7, ', CI type=',par6,')',sep='')
} else {
mytitle <- paste('Working Time Series (base=',par8,', d=',par3,', D=',par4,')',sep='')
mysub <- paste('(base=',par8,', d=',par3,', D=',par4,', CI=', par7, ', CI type=',par6,')',sep='')
}
plot(x,type='l', main=mytitle,xlab='time',ylab='value')
par(op)
dev.off()
bitmap(file='pic1.png')
racf <- acf(x, par1, main='Autocorrelation', xlab='time lag', ylab='ACF', ci.type=par6, ci=par7, sub=mysub)
dev.off()
bitmap(file='pic2.png')
rpacf <- pacf(x,par1,main='Partial Autocorrelation',xlab='lags',ylab='PACF',sub=mysub)
dev.off()
(myacf <- c(racf$acf))
(mypacf <- c(rpacf$acf))
lengthx <- length(x)
sqrtn <- sqrt(lengthx)
load(file='createtable')
a<-table.start()
a<-table.row.start(a)
a<-table.element(a,'Autocorrelation Function',4,TRUE)
a<-table.row.end(a)
a<-table.row.start(a)
a<-table.element(a,'Time lag k',header=TRUE)
a<-table.element(a,'ACF(k)',header=TRUE)
a<-table.element(a,'T-STAT',header=TRUE)
a<-table.element(a,'P-value',header=TRUE)
a<-table.row.end(a)
for (i in 2:(par1+1)) {
a<-table.row.start(a)
a<-table.element(a,i-1,header=TRUE)
a<-table.element(a,round(myacf[i],6))
mytstat <- myacf[i]*sqrtn
a<-table.element(a,round(mytstat,4))
a<-table.element(a,round(1-pt(abs(mytstat),lengthx),6))
a<-table.row.end(a)
}
a<-table.end(a)
table.save(a,file='mytable.tab')
a<-table.start()
a<-table.row.start(a)
a<-table.element(a,'Partial Autocorrelation Function',4,TRUE)
a<-table.row.end(a)
a<-table.row.start(a)
a<-table.element(a,'Time lag k',header=TRUE)
a<-table.element(a,'PACF(k)',header=TRUE)
a<-table.element(a,'T-STAT',header=TRUE)
a<-table.element(a,'P-value',header=TRUE)
a<-table.row.end(a)
for (i in 1:par1) {
a<-table.row.start(a)
a<-table.element(a,i,header=TRUE)
a<-table.element(a,round(mypacf[i],6))
mytstat <- mypacf[i]*sqrtn
a<-table.element(a,round(mytstat,4))
a<-table.element(a,round(1-pt(abs(mytstat),lengthx),6))
a<-table.row.end(a)
}
a<-table.end(a)
table.save(a,file='mytable1.tab')