Free Statistics

of Irreproducible Research!

Author's title

Author*The author of this computation has been verified*
R Software Modulerwasp_autocorrelation.wasp
Title produced by software(Partial) Autocorrelation Function
Date of computationFri, 09 Dec 2016 08:55:45 +0100
Cite this page as followsStatistical Computations at FreeStatistics.org, Office for Research Development and Education, URL https://freestatistics.org/blog/index.php?v=date/2016/Dec/09/t1481270196yo8h98pz00q7kat.htm/, Retrieved Sat, 18 May 2024 05:05:43 +0000
Statistical Computations at FreeStatistics.org, Office for Research Development and Education, URL https://freestatistics.org/blog/index.php?pk=298425, Retrieved Sat, 18 May 2024 05:05:43 +0000
QR Codes:

Original text written by user:
IsPrivate?No (this computation is public)
User-defined keywords
Estimated Impact105
Family? (F = Feedback message, R = changed R code, M = changed R Module, P = changed Parameters, D = changed Data)
-       [(Partial) Autocorrelation Function] [] [2016-12-09 07:55:45] [24da340c2401d75222b6137c0718139b] [Current]
Feedback Forum

Post a new message
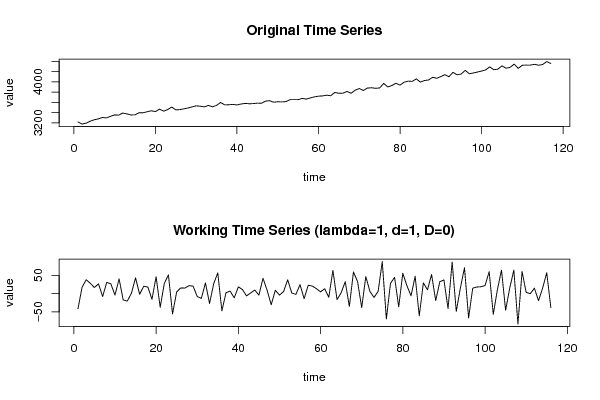
Dataseries X:
3217.2
3176
3193.5
3231.7
3260.2
3277.1
3304.2
3296.4
3327.3
3354.3
3350.5
3391.1
3374.2
3354
3355.1
3398.4
3396.8
3417.2
3435.4
3420
3466.3
3429.1
3457.3
3508.7
3453.3
3458
3473.8
3489.1
3511.2
3531.9
3524.2
3511.2
3540.5
3513.6
3540.5
3597.5
3550.4
3553
3560.2
3548.8
3567.4
3578.9
3572.8
3575
3584.9
3581.1
3623.2
3632.6
3602.4
3611.9
3608.1
3613.8
3651.9
3653.8
3651.9
3676.8
3663.2
3686.3
3707.1
3720.7
3725.6
3739.2
3729.4
3793.3
3777.2
3779.5
3812.4
3777.2
3836.7
3869.7
3831.7
3878.6
3884.8
3874.5
3881
3969
3899.9
3928.1
3972.8
3936.8
3992.9
4014.8
4009
4056.8
3996.2
4025.7
4036.4
4088.8
4069.8
4102.7
4140.2
4099.6
4186.2
4137.7
4153.4
4224.5
4158.3
4173.4
4191.7
4210.7
4232.9
4293.1
4236.7
4247.8
4312.3
4266.9
4282.4
4346.9
4263.8
4324.4
4328.1
4328.1
4343.2
4324.2
4339.5
4396.7
4358.6


Summary of computational transaction
Raw Input view raw input (R code)
Raw Outputview raw output of R engine
Computing time2 seconds
R ServerBig Analytics Cloud Computing Center

\begin{tabular}{lllllllll}
\hline
Summary of computational transaction \tabularnewline
Raw Input view raw input (R code)  \tabularnewline
Raw Outputview raw output of R engine  \tabularnewline
Computing time2 seconds \tabularnewline
R ServerBig Analytics Cloud Computing Center \tabularnewline
\hline
\end{tabular}
%Source: https://freestatistics.org/blog/index.php?pk=298425&T=0

[TABLE]
[ROW]
Summary of computational transaction[/C][/ROW] [ROW]Raw Input[/C] view raw input (R code) [/C][/ROW] [ROW]Raw Output[/C]view raw output of R engine [/C][/ROW] [ROW]Computing time[/C]2 seconds[/C][/ROW] [ROW]R Server[/C]Big Analytics Cloud Computing Center[/C][/ROW] [/TABLE] Source: https://freestatistics.org/blog/index.php?pk=298425&T=0

Globally Unique Identifier (entire table): ba.freestatistics.org/blog/index.php?pk=298425&T=0

As an alternative you can also use a QR Code:  

The GUIDs for individual cells are displayed in the table below:

Summary of computational transaction
Raw Input view raw input (R code)
Raw Outputview raw output of R engine
Computing time2 seconds
R ServerBig Analytics Cloud Computing Center


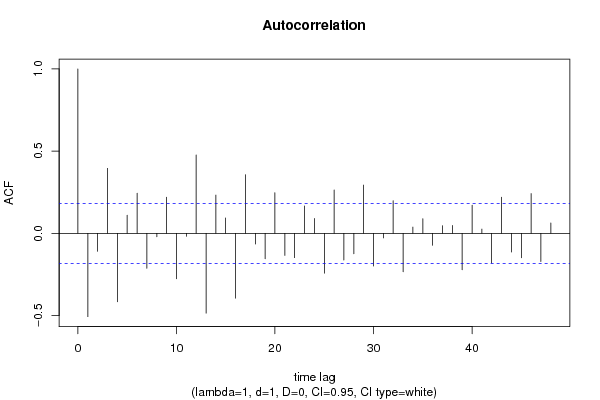
Autocorrelation Function
Time lag kACF(k)T-STATP-value
1-0.506771-5.45810
2-0.109031-1.17430.12134
30.3951284.25572.1e-05
4-0.415779-4.47819e-06
50.1097911.18250.119716
60.2443992.63230.004818
7-0.212253-2.2860.012034
8-0.02046-0.22040.412988
90.2198042.36740.009785
10-0.276776-2.9810.001751
11-0.017967-0.19350.42345
120.4760985.12771e-06
13-0.48536-5.22750
140.2326492.50570.006804
150.0935521.00760.157876
16-0.394358-4.24742.2e-05
170.3568513.84349.9e-05
18-0.065242-0.70270.241831
19-0.154904-1.66840.04897
200.2464922.65480.004525
21-0.134222-1.44560.075491
22-0.147646-1.59020.057256
230.1659551.78740.038243
240.0904130.97380.166097
25-0.241949-2.60590.005183
260.2639742.84310.002641
27-0.16184-1.74310.041986
28-0.124513-1.3410.091262
290.293243.15830.001012
30-0.198244-2.13520.017426
31-0.027535-0.29660.383668
320.1980392.13290.017518
33-0.233741-2.51750.006592
340.0378520.40770.34213
350.0891410.96010.169505
36-0.072829-0.78440.217204
370.0464780.50060.308806
380.0476380.51310.304437
39-0.221432-2.38490.009352
400.1705841.83730.034366
410.0258640.27860.390539
42-0.180028-1.9390.027468
430.2195752.36490.009848
44-0.113936-1.22710.111129
45-0.14824-1.59660.056538
460.2417272.60350.005217
47-0.171337-1.84540.033768
480.0627970.67630.250083

\begin{tabular}{lllllllll}
\hline
Autocorrelation Function \tabularnewline
Time lag k & ACF(k) & T-STAT & P-value \tabularnewline
1 & -0.506771 & -5.4581 & 0 \tabularnewline
2 & -0.109031 & -1.1743 & 0.12134 \tabularnewline
3 & 0.395128 & 4.2557 & 2.1e-05 \tabularnewline
4 & -0.415779 & -4.4781 & 9e-06 \tabularnewline
5 & 0.109791 & 1.1825 & 0.119716 \tabularnewline
6 & 0.244399 & 2.6323 & 0.004818 \tabularnewline
7 & -0.212253 & -2.286 & 0.012034 \tabularnewline
8 & -0.02046 & -0.2204 & 0.412988 \tabularnewline
9 & 0.219804 & 2.3674 & 0.009785 \tabularnewline
10 & -0.276776 & -2.981 & 0.001751 \tabularnewline
11 & -0.017967 & -0.1935 & 0.42345 \tabularnewline
12 & 0.476098 & 5.1277 & 1e-06 \tabularnewline
13 & -0.48536 & -5.2275 & 0 \tabularnewline
14 & 0.232649 & 2.5057 & 0.006804 \tabularnewline
15 & 0.093552 & 1.0076 & 0.157876 \tabularnewline
16 & -0.394358 & -4.2474 & 2.2e-05 \tabularnewline
17 & 0.356851 & 3.8434 & 9.9e-05 \tabularnewline
18 & -0.065242 & -0.7027 & 0.241831 \tabularnewline
19 & -0.154904 & -1.6684 & 0.04897 \tabularnewline
20 & 0.246492 & 2.6548 & 0.004525 \tabularnewline
21 & -0.134222 & -1.4456 & 0.075491 \tabularnewline
22 & -0.147646 & -1.5902 & 0.057256 \tabularnewline
23 & 0.165955 & 1.7874 & 0.038243 \tabularnewline
24 & 0.090413 & 0.9738 & 0.166097 \tabularnewline
25 & -0.241949 & -2.6059 & 0.005183 \tabularnewline
26 & 0.263974 & 2.8431 & 0.002641 \tabularnewline
27 & -0.16184 & -1.7431 & 0.041986 \tabularnewline
28 & -0.124513 & -1.341 & 0.091262 \tabularnewline
29 & 0.29324 & 3.1583 & 0.001012 \tabularnewline
30 & -0.198244 & -2.1352 & 0.017426 \tabularnewline
31 & -0.027535 & -0.2966 & 0.383668 \tabularnewline
32 & 0.198039 & 2.1329 & 0.017518 \tabularnewline
33 & -0.233741 & -2.5175 & 0.006592 \tabularnewline
34 & 0.037852 & 0.4077 & 0.34213 \tabularnewline
35 & 0.089141 & 0.9601 & 0.169505 \tabularnewline
36 & -0.072829 & -0.7844 & 0.217204 \tabularnewline
37 & 0.046478 & 0.5006 & 0.308806 \tabularnewline
38 & 0.047638 & 0.5131 & 0.304437 \tabularnewline
39 & -0.221432 & -2.3849 & 0.009352 \tabularnewline
40 & 0.170584 & 1.8373 & 0.034366 \tabularnewline
41 & 0.025864 & 0.2786 & 0.390539 \tabularnewline
42 & -0.180028 & -1.939 & 0.027468 \tabularnewline
43 & 0.219575 & 2.3649 & 0.009848 \tabularnewline
44 & -0.113936 & -1.2271 & 0.111129 \tabularnewline
45 & -0.14824 & -1.5966 & 0.056538 \tabularnewline
46 & 0.241727 & 2.6035 & 0.005217 \tabularnewline
47 & -0.171337 & -1.8454 & 0.033768 \tabularnewline
48 & 0.062797 & 0.6763 & 0.250083 \tabularnewline
\hline
\end{tabular}
%Source: https://freestatistics.org/blog/index.php?pk=298425&T=1

[TABLE]
[ROW][C]Autocorrelation Function[/C][/ROW]
[ROW][C]Time lag k[/C][C]ACF(k)[/C][C]T-STAT[/C][C]P-value[/C][/ROW]
[ROW][C]1[/C][C]-0.506771[/C][C]-5.4581[/C][C]0[/C][/ROW]
[ROW][C]2[/C][C]-0.109031[/C][C]-1.1743[/C][C]0.12134[/C][/ROW]
[ROW][C]3[/C][C]0.395128[/C][C]4.2557[/C][C]2.1e-05[/C][/ROW]
[ROW][C]4[/C][C]-0.415779[/C][C]-4.4781[/C][C]9e-06[/C][/ROW]
[ROW][C]5[/C][C]0.109791[/C][C]1.1825[/C][C]0.119716[/C][/ROW]
[ROW][C]6[/C][C]0.244399[/C][C]2.6323[/C][C]0.004818[/C][/ROW]
[ROW][C]7[/C][C]-0.212253[/C][C]-2.286[/C][C]0.012034[/C][/ROW]
[ROW][C]8[/C][C]-0.02046[/C][C]-0.2204[/C][C]0.412988[/C][/ROW]
[ROW][C]9[/C][C]0.219804[/C][C]2.3674[/C][C]0.009785[/C][/ROW]
[ROW][C]10[/C][C]-0.276776[/C][C]-2.981[/C][C]0.001751[/C][/ROW]
[ROW][C]11[/C][C]-0.017967[/C][C]-0.1935[/C][C]0.42345[/C][/ROW]
[ROW][C]12[/C][C]0.476098[/C][C]5.1277[/C][C]1e-06[/C][/ROW]
[ROW][C]13[/C][C]-0.48536[/C][C]-5.2275[/C][C]0[/C][/ROW]
[ROW][C]14[/C][C]0.232649[/C][C]2.5057[/C][C]0.006804[/C][/ROW]
[ROW][C]15[/C][C]0.093552[/C][C]1.0076[/C][C]0.157876[/C][/ROW]
[ROW][C]16[/C][C]-0.394358[/C][C]-4.2474[/C][C]2.2e-05[/C][/ROW]
[ROW][C]17[/C][C]0.356851[/C][C]3.8434[/C][C]9.9e-05[/C][/ROW]
[ROW][C]18[/C][C]-0.065242[/C][C]-0.7027[/C][C]0.241831[/C][/ROW]
[ROW][C]19[/C][C]-0.154904[/C][C]-1.6684[/C][C]0.04897[/C][/ROW]
[ROW][C]20[/C][C]0.246492[/C][C]2.6548[/C][C]0.004525[/C][/ROW]
[ROW][C]21[/C][C]-0.134222[/C][C]-1.4456[/C][C]0.075491[/C][/ROW]
[ROW][C]22[/C][C]-0.147646[/C][C]-1.5902[/C][C]0.057256[/C][/ROW]
[ROW][C]23[/C][C]0.165955[/C][C]1.7874[/C][C]0.038243[/C][/ROW]
[ROW][C]24[/C][C]0.090413[/C][C]0.9738[/C][C]0.166097[/C][/ROW]
[ROW][C]25[/C][C]-0.241949[/C][C]-2.6059[/C][C]0.005183[/C][/ROW]
[ROW][C]26[/C][C]0.263974[/C][C]2.8431[/C][C]0.002641[/C][/ROW]
[ROW][C]27[/C][C]-0.16184[/C][C]-1.7431[/C][C]0.041986[/C][/ROW]
[ROW][C]28[/C][C]-0.124513[/C][C]-1.341[/C][C]0.091262[/C][/ROW]
[ROW][C]29[/C][C]0.29324[/C][C]3.1583[/C][C]0.001012[/C][/ROW]
[ROW][C]30[/C][C]-0.198244[/C][C]-2.1352[/C][C]0.017426[/C][/ROW]
[ROW][C]31[/C][C]-0.027535[/C][C]-0.2966[/C][C]0.383668[/C][/ROW]
[ROW][C]32[/C][C]0.198039[/C][C]2.1329[/C][C]0.017518[/C][/ROW]
[ROW][C]33[/C][C]-0.233741[/C][C]-2.5175[/C][C]0.006592[/C][/ROW]
[ROW][C]34[/C][C]0.037852[/C][C]0.4077[/C][C]0.34213[/C][/ROW]
[ROW][C]35[/C][C]0.089141[/C][C]0.9601[/C][C]0.169505[/C][/ROW]
[ROW][C]36[/C][C]-0.072829[/C][C]-0.7844[/C][C]0.217204[/C][/ROW]
[ROW][C]37[/C][C]0.046478[/C][C]0.5006[/C][C]0.308806[/C][/ROW]
[ROW][C]38[/C][C]0.047638[/C][C]0.5131[/C][C]0.304437[/C][/ROW]
[ROW][C]39[/C][C]-0.221432[/C][C]-2.3849[/C][C]0.009352[/C][/ROW]
[ROW][C]40[/C][C]0.170584[/C][C]1.8373[/C][C]0.034366[/C][/ROW]
[ROW][C]41[/C][C]0.025864[/C][C]0.2786[/C][C]0.390539[/C][/ROW]
[ROW][C]42[/C][C]-0.180028[/C][C]-1.939[/C][C]0.027468[/C][/ROW]
[ROW][C]43[/C][C]0.219575[/C][C]2.3649[/C][C]0.009848[/C][/ROW]
[ROW][C]44[/C][C]-0.113936[/C][C]-1.2271[/C][C]0.111129[/C][/ROW]
[ROW][C]45[/C][C]-0.14824[/C][C]-1.5966[/C][C]0.056538[/C][/ROW]
[ROW][C]46[/C][C]0.241727[/C][C]2.6035[/C][C]0.005217[/C][/ROW]
[ROW][C]47[/C][C]-0.171337[/C][C]-1.8454[/C][C]0.033768[/C][/ROW]
[ROW][C]48[/C][C]0.062797[/C][C]0.6763[/C][C]0.250083[/C][/ROW]
[/TABLE]
Source: https://freestatistics.org/blog/index.php?pk=298425&T=1

Globally Unique Identifier (entire table): ba.freestatistics.org/blog/index.php?pk=298425&T=1

As an alternative you can also use a QR Code:  

The GUIDs for individual cells are displayed in the table below:

Autocorrelation Function
Time lag kACF(k)T-STATP-value
1-0.506771-5.45810
2-0.109031-1.17430.12134
30.3951284.25572.1e-05
4-0.415779-4.47819e-06
50.1097911.18250.119716
60.2443992.63230.004818
7-0.212253-2.2860.012034
8-0.02046-0.22040.412988
90.2198042.36740.009785
10-0.276776-2.9810.001751
11-0.017967-0.19350.42345
120.4760985.12771e-06
13-0.48536-5.22750
140.2326492.50570.006804
150.0935521.00760.157876
16-0.394358-4.24742.2e-05
170.3568513.84349.9e-05
18-0.065242-0.70270.241831
19-0.154904-1.66840.04897
200.2464922.65480.004525
21-0.134222-1.44560.075491
22-0.147646-1.59020.057256
230.1659551.78740.038243
240.0904130.97380.166097
25-0.241949-2.60590.005183
260.2639742.84310.002641
27-0.16184-1.74310.041986
28-0.124513-1.3410.091262
290.293243.15830.001012
30-0.198244-2.13520.017426
31-0.027535-0.29660.383668
320.1980392.13290.017518
33-0.233741-2.51750.006592
340.0378520.40770.34213
350.0891410.96010.169505
36-0.072829-0.78440.217204
370.0464780.50060.308806
380.0476380.51310.304437
39-0.221432-2.38490.009352
400.1705841.83730.034366
410.0258640.27860.390539
42-0.180028-1.9390.027468
430.2195752.36490.009848
44-0.113936-1.22710.111129
45-0.14824-1.59660.056538
460.2417272.60350.005217
47-0.171337-1.84540.033768
480.0627970.67630.250083


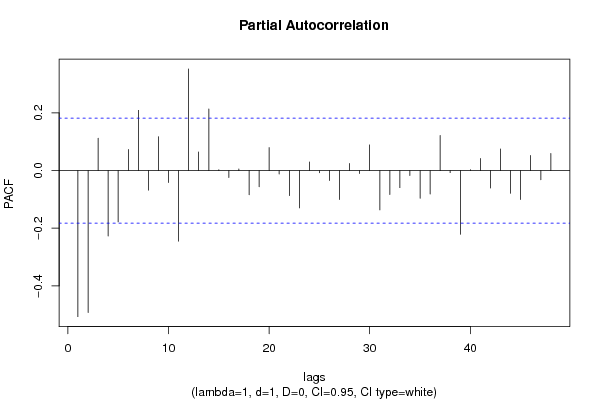
Partial Autocorrelation Function
Time lag kPACF(k)T-STATP-value
1-0.506771-5.45810
2-0.492272-5.30190
30.1122461.20890.114574
4-0.227226-2.44730.007946
5-0.177879-1.91580.028925
60.0731550.78790.21618
70.2089292.25020.01316
8-0.067926-0.73160.232948
90.1172631.2630.104568
10-0.041582-0.44780.327549
11-0.244833-2.63690.004756
120.3526773.79850.000117
130.0643410.6930.244854
140.2139092.30390.011505
150.002720.02930.488341
16-0.023982-0.25830.398319
170.0057960.06240.475166
18-0.083898-0.90360.184037
19-0.056239-0.60570.272945
200.0796660.8580.196322
21-0.011625-0.12520.45029
22-0.086778-0.93460.175962
23-0.129485-1.39460.082901
240.0298370.32140.374259
25-0.007564-0.08150.467604
26-0.034347-0.36990.356054
27-0.100214-1.07930.141338
280.0243720.26250.396705
29-0.010262-0.11050.45609
300.0891610.96030.169452
31-0.136413-1.46920.072241
32-0.083242-0.89650.185909
33-0.059216-0.63780.262438
34-0.01687-0.18170.42807
35-0.096207-1.03620.151135
36-0.081069-0.87310.192196
370.1220141.31410.095698
38-0.007069-0.07610.469721
39-0.220921-2.37940.009486
400.0028080.03020.487961
410.0420410.45280.32577
42-0.060386-0.65040.258369
430.0751110.8090.210095
44-0.078552-0.8460.199639
45-0.100374-1.08110.140956
460.052340.56370.287016
47-0.031538-0.33970.367358
480.0594490.64030.261627

\begin{tabular}{lllllllll}
\hline
Partial Autocorrelation Function \tabularnewline
Time lag k & PACF(k) & T-STAT & P-value \tabularnewline
1 & -0.506771 & -5.4581 & 0 \tabularnewline
2 & -0.492272 & -5.3019 & 0 \tabularnewline
3 & 0.112246 & 1.2089 & 0.114574 \tabularnewline
4 & -0.227226 & -2.4473 & 0.007946 \tabularnewline
5 & -0.177879 & -1.9158 & 0.028925 \tabularnewline
6 & 0.073155 & 0.7879 & 0.21618 \tabularnewline
7 & 0.208929 & 2.2502 & 0.01316 \tabularnewline
8 & -0.067926 & -0.7316 & 0.232948 \tabularnewline
9 & 0.117263 & 1.263 & 0.104568 \tabularnewline
10 & -0.041582 & -0.4478 & 0.327549 \tabularnewline
11 & -0.244833 & -2.6369 & 0.004756 \tabularnewline
12 & 0.352677 & 3.7985 & 0.000117 \tabularnewline
13 & 0.064341 & 0.693 & 0.244854 \tabularnewline
14 & 0.213909 & 2.3039 & 0.011505 \tabularnewline
15 & 0.00272 & 0.0293 & 0.488341 \tabularnewline
16 & -0.023982 & -0.2583 & 0.398319 \tabularnewline
17 & 0.005796 & 0.0624 & 0.475166 \tabularnewline
18 & -0.083898 & -0.9036 & 0.184037 \tabularnewline
19 & -0.056239 & -0.6057 & 0.272945 \tabularnewline
20 & 0.079666 & 0.858 & 0.196322 \tabularnewline
21 & -0.011625 & -0.1252 & 0.45029 \tabularnewline
22 & -0.086778 & -0.9346 & 0.175962 \tabularnewline
23 & -0.129485 & -1.3946 & 0.082901 \tabularnewline
24 & 0.029837 & 0.3214 & 0.374259 \tabularnewline
25 & -0.007564 & -0.0815 & 0.467604 \tabularnewline
26 & -0.034347 & -0.3699 & 0.356054 \tabularnewline
27 & -0.100214 & -1.0793 & 0.141338 \tabularnewline
28 & 0.024372 & 0.2625 & 0.396705 \tabularnewline
29 & -0.010262 & -0.1105 & 0.45609 \tabularnewline
30 & 0.089161 & 0.9603 & 0.169452 \tabularnewline
31 & -0.136413 & -1.4692 & 0.072241 \tabularnewline
32 & -0.083242 & -0.8965 & 0.185909 \tabularnewline
33 & -0.059216 & -0.6378 & 0.262438 \tabularnewline
34 & -0.01687 & -0.1817 & 0.42807 \tabularnewline
35 & -0.096207 & -1.0362 & 0.151135 \tabularnewline
36 & -0.081069 & -0.8731 & 0.192196 \tabularnewline
37 & 0.122014 & 1.3141 & 0.095698 \tabularnewline
38 & -0.007069 & -0.0761 & 0.469721 \tabularnewline
39 & -0.220921 & -2.3794 & 0.009486 \tabularnewline
40 & 0.002808 & 0.0302 & 0.487961 \tabularnewline
41 & 0.042041 & 0.4528 & 0.32577 \tabularnewline
42 & -0.060386 & -0.6504 & 0.258369 \tabularnewline
43 & 0.075111 & 0.809 & 0.210095 \tabularnewline
44 & -0.078552 & -0.846 & 0.199639 \tabularnewline
45 & -0.100374 & -1.0811 & 0.140956 \tabularnewline
46 & 0.05234 & 0.5637 & 0.287016 \tabularnewline
47 & -0.031538 & -0.3397 & 0.367358 \tabularnewline
48 & 0.059449 & 0.6403 & 0.261627 \tabularnewline
\hline
\end{tabular}
%Source: https://freestatistics.org/blog/index.php?pk=298425&T=2

[TABLE]
[ROW][C]Partial Autocorrelation Function[/C][/ROW]
[ROW][C]Time lag k[/C][C]PACF(k)[/C][C]T-STAT[/C][C]P-value[/C][/ROW]
[ROW][C]1[/C][C]-0.506771[/C][C]-5.4581[/C][C]0[/C][/ROW]
[ROW][C]2[/C][C]-0.492272[/C][C]-5.3019[/C][C]0[/C][/ROW]
[ROW][C]3[/C][C]0.112246[/C][C]1.2089[/C][C]0.114574[/C][/ROW]
[ROW][C]4[/C][C]-0.227226[/C][C]-2.4473[/C][C]0.007946[/C][/ROW]
[ROW][C]5[/C][C]-0.177879[/C][C]-1.9158[/C][C]0.028925[/C][/ROW]
[ROW][C]6[/C][C]0.073155[/C][C]0.7879[/C][C]0.21618[/C][/ROW]
[ROW][C]7[/C][C]0.208929[/C][C]2.2502[/C][C]0.01316[/C][/ROW]
[ROW][C]8[/C][C]-0.067926[/C][C]-0.7316[/C][C]0.232948[/C][/ROW]
[ROW][C]9[/C][C]0.117263[/C][C]1.263[/C][C]0.104568[/C][/ROW]
[ROW][C]10[/C][C]-0.041582[/C][C]-0.4478[/C][C]0.327549[/C][/ROW]
[ROW][C]11[/C][C]-0.244833[/C][C]-2.6369[/C][C]0.004756[/C][/ROW]
[ROW][C]12[/C][C]0.352677[/C][C]3.7985[/C][C]0.000117[/C][/ROW]
[ROW][C]13[/C][C]0.064341[/C][C]0.693[/C][C]0.244854[/C][/ROW]
[ROW][C]14[/C][C]0.213909[/C][C]2.3039[/C][C]0.011505[/C][/ROW]
[ROW][C]15[/C][C]0.00272[/C][C]0.0293[/C][C]0.488341[/C][/ROW]
[ROW][C]16[/C][C]-0.023982[/C][C]-0.2583[/C][C]0.398319[/C][/ROW]
[ROW][C]17[/C][C]0.005796[/C][C]0.0624[/C][C]0.475166[/C][/ROW]
[ROW][C]18[/C][C]-0.083898[/C][C]-0.9036[/C][C]0.184037[/C][/ROW]
[ROW][C]19[/C][C]-0.056239[/C][C]-0.6057[/C][C]0.272945[/C][/ROW]
[ROW][C]20[/C][C]0.079666[/C][C]0.858[/C][C]0.196322[/C][/ROW]
[ROW][C]21[/C][C]-0.011625[/C][C]-0.1252[/C][C]0.45029[/C][/ROW]
[ROW][C]22[/C][C]-0.086778[/C][C]-0.9346[/C][C]0.175962[/C][/ROW]
[ROW][C]23[/C][C]-0.129485[/C][C]-1.3946[/C][C]0.082901[/C][/ROW]
[ROW][C]24[/C][C]0.029837[/C][C]0.3214[/C][C]0.374259[/C][/ROW]
[ROW][C]25[/C][C]-0.007564[/C][C]-0.0815[/C][C]0.467604[/C][/ROW]
[ROW][C]26[/C][C]-0.034347[/C][C]-0.3699[/C][C]0.356054[/C][/ROW]
[ROW][C]27[/C][C]-0.100214[/C][C]-1.0793[/C][C]0.141338[/C][/ROW]
[ROW][C]28[/C][C]0.024372[/C][C]0.2625[/C][C]0.396705[/C][/ROW]
[ROW][C]29[/C][C]-0.010262[/C][C]-0.1105[/C][C]0.45609[/C][/ROW]
[ROW][C]30[/C][C]0.089161[/C][C]0.9603[/C][C]0.169452[/C][/ROW]
[ROW][C]31[/C][C]-0.136413[/C][C]-1.4692[/C][C]0.072241[/C][/ROW]
[ROW][C]32[/C][C]-0.083242[/C][C]-0.8965[/C][C]0.185909[/C][/ROW]
[ROW][C]33[/C][C]-0.059216[/C][C]-0.6378[/C][C]0.262438[/C][/ROW]
[ROW][C]34[/C][C]-0.01687[/C][C]-0.1817[/C][C]0.42807[/C][/ROW]
[ROW][C]35[/C][C]-0.096207[/C][C]-1.0362[/C][C]0.151135[/C][/ROW]
[ROW][C]36[/C][C]-0.081069[/C][C]-0.8731[/C][C]0.192196[/C][/ROW]
[ROW][C]37[/C][C]0.122014[/C][C]1.3141[/C][C]0.095698[/C][/ROW]
[ROW][C]38[/C][C]-0.007069[/C][C]-0.0761[/C][C]0.469721[/C][/ROW]
[ROW][C]39[/C][C]-0.220921[/C][C]-2.3794[/C][C]0.009486[/C][/ROW]
[ROW][C]40[/C][C]0.002808[/C][C]0.0302[/C][C]0.487961[/C][/ROW]
[ROW][C]41[/C][C]0.042041[/C][C]0.4528[/C][C]0.32577[/C][/ROW]
[ROW][C]42[/C][C]-0.060386[/C][C]-0.6504[/C][C]0.258369[/C][/ROW]
[ROW][C]43[/C][C]0.075111[/C][C]0.809[/C][C]0.210095[/C][/ROW]
[ROW][C]44[/C][C]-0.078552[/C][C]-0.846[/C][C]0.199639[/C][/ROW]
[ROW][C]45[/C][C]-0.100374[/C][C]-1.0811[/C][C]0.140956[/C][/ROW]
[ROW][C]46[/C][C]0.05234[/C][C]0.5637[/C][C]0.287016[/C][/ROW]
[ROW][C]47[/C][C]-0.031538[/C][C]-0.3397[/C][C]0.367358[/C][/ROW]
[ROW][C]48[/C][C]0.059449[/C][C]0.6403[/C][C]0.261627[/C][/ROW]
[/TABLE]
Source: https://freestatistics.org/blog/index.php?pk=298425&T=2

Globally Unique Identifier (entire table): ba.freestatistics.org/blog/index.php?pk=298425&T=2

As an alternative you can also use a QR Code:  

The GUIDs for individual cells are displayed in the table below:

Partial Autocorrelation Function
Time lag kPACF(k)T-STATP-value
1-0.506771-5.45810
2-0.492272-5.30190
30.1122461.20890.114574
4-0.227226-2.44730.007946
5-0.177879-1.91580.028925
60.0731550.78790.21618
70.2089292.25020.01316
8-0.067926-0.73160.232948
90.1172631.2630.104568
10-0.041582-0.44780.327549
11-0.244833-2.63690.004756
120.3526773.79850.000117
130.0643410.6930.244854
140.2139092.30390.011505
150.002720.02930.488341
16-0.023982-0.25830.398319
170.0057960.06240.475166
18-0.083898-0.90360.184037
19-0.056239-0.60570.272945
200.0796660.8580.196322
21-0.011625-0.12520.45029
22-0.086778-0.93460.175962
23-0.129485-1.39460.082901
240.0298370.32140.374259
25-0.007564-0.08150.467604
26-0.034347-0.36990.356054
27-0.100214-1.07930.141338
280.0243720.26250.396705
29-0.010262-0.11050.45609
300.0891610.96030.169452
31-0.136413-1.46920.072241
32-0.083242-0.89650.185909
33-0.059216-0.63780.262438
34-0.01687-0.18170.42807
35-0.096207-1.03620.151135
36-0.081069-0.87310.192196
370.1220141.31410.095698
38-0.007069-0.07610.469721
39-0.220921-2.37940.009486
400.0028080.03020.487961
410.0420410.45280.32577
42-0.060386-0.65040.258369
430.0751110.8090.210095
44-0.078552-0.8460.199639
45-0.100374-1.08110.140956
460.052340.56370.287016
47-0.031538-0.33970.367358
480.0594490.64030.261627


Parameters (Session):
par1 = 48 ; par2 = 1 ; par3 = 1 ; par4 = 0 ; par5 = 1 ; par6 = White Noise ; par7 = 0.95 ;
Parameters (R input):
par1 = 48 ; par2 = 1 ; par3 = 1 ; par4 = 0 ; par5 = 1 ; par6 = White Noise ; par7 = 0.95 ; par8 = ;
R code (references can be found in the software module):
par8 <- ''
par7 <- '0.95'
par6 <- 'White Noise'
par5 <- '1'
par4 <- '0'
par3 <- '0'
par2 <- '1'
par1 <- '48'
if (par1 == 'Default') {
par1 = 10*log10(length(x))
} else {
par1 <- as.numeric(par1)
}
par2 <- as.numeric(par2)
par3 <- as.numeric(par3)
par4 <- as.numeric(par4)
par5 <- as.numeric(par5)
if (par6 == 'White Noise') par6 <- 'white' else par6 <- 'ma'
par7 <- as.numeric(par7)
if (par8 != '') par8 <- as.numeric(par8)
x <- na.omit(x)
ox <- x
if (par8 == '') {
if (par2 == 0) {
x <- log(x)
} else {
x <- (x ^ par2 - 1) / par2
}
} else {
x <- log(x,base=par8)
}
if (par3 > 0) x <- diff(x,lag=1,difference=par3)
if (par4 > 0) x <- diff(x,lag=par5,difference=par4)
bitmap(file='picts.png')
op <- par(mfrow=c(2,1))
plot(ox,type='l',main='Original Time Series',xlab='time',ylab='value')
if (par8=='') {
mytitle <- paste('Working Time Series (lambda=',par2,', d=',par3,', D=',par4,')',sep='')
mysub <- paste('(lambda=',par2,', d=',par3,', D=',par4,', CI=', par7, ', CI type=',par6,')',sep='')
} else {
mytitle <- paste('Working Time Series (base=',par8,', d=',par3,', D=',par4,')',sep='')
mysub <- paste('(base=',par8,', d=',par3,', D=',par4,', CI=', par7, ', CI type=',par6,')',sep='')
}
plot(x,type='l', main=mytitle,xlab='time',ylab='value')
par(op)
dev.off()
bitmap(file='pic1.png')
racf <- acf(x, par1, main='Autocorrelation', xlab='time lag', ylab='ACF', ci.type=par6, ci=par7, sub=mysub)
dev.off()
bitmap(file='pic2.png')
rpacf <- pacf(x,par1,main='Partial Autocorrelation',xlab='lags',ylab='PACF',sub=mysub)
dev.off()
(myacf <- c(racf$acf))
(mypacf <- c(rpacf$acf))
lengthx <- length(x)
sqrtn <- sqrt(lengthx)
load(file='createtable')
a<-table.start()
a<-table.row.start(a)
a<-table.element(a,'Autocorrelation Function',4,TRUE)
a<-table.row.end(a)
a<-table.row.start(a)
a<-table.element(a,'Time lag k',header=TRUE)
a<-table.element(a,'ACF(k)',header=TRUE)
a<-table.element(a,'T-STAT',header=TRUE)
a<-table.element(a,'P-value',header=TRUE)
a<-table.row.end(a)
for (i in 2:(par1+1)) {
a<-table.row.start(a)
a<-table.element(a,i-1,header=TRUE)
a<-table.element(a,round(myacf[i],6))
mytstat <- myacf[i]*sqrtn
a<-table.element(a,round(mytstat,4))
a<-table.element(a,round(1-pt(abs(mytstat),lengthx),6))
a<-table.row.end(a)
}
a<-table.end(a)
table.save(a,file='mytable.tab')
a<-table.start()
a<-table.row.start(a)
a<-table.element(a,'Partial Autocorrelation Function',4,TRUE)
a<-table.row.end(a)
a<-table.row.start(a)
a<-table.element(a,'Time lag k',header=TRUE)
a<-table.element(a,'PACF(k)',header=TRUE)
a<-table.element(a,'T-STAT',header=TRUE)
a<-table.element(a,'P-value',header=TRUE)
a<-table.row.end(a)
for (i in 1:par1) {
a<-table.row.start(a)
a<-table.element(a,i,header=TRUE)
a<-table.element(a,round(mypacf[i],6))
mytstat <- mypacf[i]*sqrtn
a<-table.element(a,round(mytstat,4))
a<-table.element(a,round(1-pt(abs(mytstat),lengthx),6))
a<-table.row.end(a)
}
a<-table.end(a)
table.save(a,file='mytable1.tab')