Free Statistics

of Irreproducible Research!

Author's title

Author*The author of this computation has been verified*
R Software Modulerwasp_autocorrelation.wasp
Title produced by software(Partial) Autocorrelation Function
Date of computationFri, 09 Dec 2016 08:51:37 +0100
Cite this page as followsStatistical Computations at FreeStatistics.org, Office for Research Development and Education, URL https://freestatistics.org/blog/index.php?v=date/2016/Dec/09/t1481270060848h1o14phs0slc.htm/, Retrieved Sat, 18 May 2024 04:33:28 +0000
Statistical Computations at FreeStatistics.org, Office for Research Development and Education, URL https://freestatistics.org/blog/index.php?pk=298422, Retrieved Sat, 18 May 2024 04:33:28 +0000
QR Codes:

Original text written by user:
IsPrivate?No (this computation is public)
User-defined keywords
Estimated Impact102
Family? (F = Feedback message, R = changed R code, M = changed R Module, P = changed Parameters, D = changed Data)
-       [(Partial) Autocorrelation Function] [] [2016-12-09 07:51:37] [24da340c2401d75222b6137c0718139b] [Current]
Feedback Forum

Post a new message
Dataseries X:
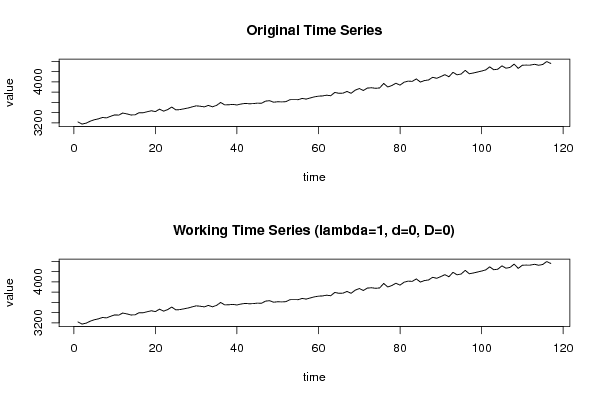
3217.2
3176
3193.5
3231.7
3260.2
3277.1
3304.2
3296.4
3327.3
3354.3
3350.5
3391.1
3374.2
3354
3355.1
3398.4
3396.8
3417.2
3435.4
3420
3466.3
3429.1
3457.3
3508.7
3453.3
3458
3473.8
3489.1
3511.2
3531.9
3524.2
3511.2
3540.5
3513.6
3540.5
3597.5
3550.4
3553
3560.2
3548.8
3567.4
3578.9
3572.8
3575
3584.9
3581.1
3623.2
3632.6
3602.4
3611.9
3608.1
3613.8
3651.9
3653.8
3651.9
3676.8
3663.2
3686.3
3707.1
3720.7
3725.6
3739.2
3729.4
3793.3
3777.2
3779.5
3812.4
3777.2
3836.7
3869.7
3831.7
3878.6
3884.8
3874.5
3881
3969
3899.9
3928.1
3972.8
3936.8
3992.9
4014.8
4009
4056.8
3996.2
4025.7
4036.4
4088.8
4069.8
4102.7
4140.2
4099.6
4186.2
4137.7
4153.4
4224.5
4158.3
4173.4
4191.7
4210.7
4232.9
4293.1
4236.7
4247.8
4312.3
4266.9
4282.4
4346.9
4263.8
4324.4
4328.1
4328.1
4343.2
4324.2
4339.5
4396.7
4358.6


Summary of computational transaction
Raw Input view raw input (R code)
Raw Outputview raw output of R engine
Computing time2 seconds
R ServerBig Analytics Cloud Computing Center

\begin{tabular}{lllllllll}
\hline
Summary of computational transaction \tabularnewline
Raw Input view raw input (R code)  \tabularnewline
Raw Outputview raw output of R engine  \tabularnewline
Computing time2 seconds \tabularnewline
R ServerBig Analytics Cloud Computing Center \tabularnewline
\hline
\end{tabular}
%Source: https://freestatistics.org/blog/index.php?pk=298422&T=0

[TABLE]
[ROW]
Summary of computational transaction[/C][/ROW] [ROW]Raw Input[/C] view raw input (R code) [/C][/ROW] [ROW]Raw Output[/C]view raw output of R engine [/C][/ROW] [ROW]Computing time[/C]2 seconds[/C][/ROW] [ROW]R Server[/C]Big Analytics Cloud Computing Center[/C][/ROW] [/TABLE] Source: https://freestatistics.org/blog/index.php?pk=298422&T=0

Globally Unique Identifier (entire table): ba.freestatistics.org/blog/index.php?pk=298422&T=0

As an alternative you can also use a QR Code:  

The GUIDs for individual cells are displayed in the table below:

Summary of computational transaction
Raw Input view raw input (R code)
Raw Outputview raw output of R engine
Computing time2 seconds
R ServerBig Analytics Cloud Computing Center


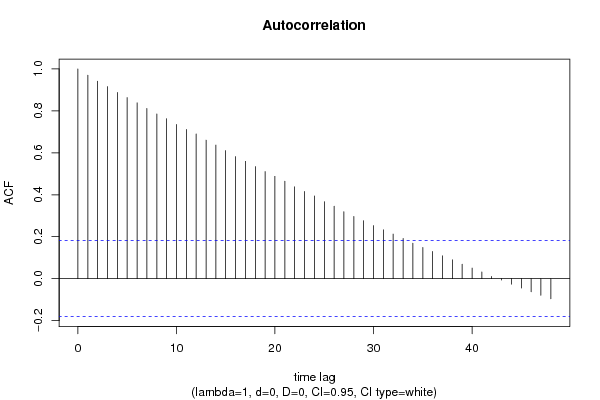
Autocorrelation Function
Time lag kACF(k)T-STATP-value
10.97026510.4950
20.94125310.18120
30.9156919.90470
40.8876579.60150
50.8632619.33760
60.8383349.0680
70.8113228.77580
80.7854398.49580
90.7629478.25250
100.7349757.950
110.7116447.69760
120.6901357.46490
130.6604527.14390
140.6367976.8880
150.6106246.60490
160.5820936.29630
170.5592966.04970
180.5340855.7770
190.510425.5210
200.4877555.27590
210.4645865.02531e-06
220.4375624.7333e-06
230.415614.49558e-06
240.3942144.26412e-05
250.3667853.96746.3e-05
260.3450783.73260.000147
270.3189643.45010.00039
280.2960813.20260.000877
290.2761732.98730.001715
300.2527772.73420.003613
310.2327192.51720.00659
320.2122572.29590.011731
330.191782.07440.020117
340.1692051.83020.034881
350.1488741.61030.055011
360.1292211.39770.082419
370.1086991.17580.12104
380.089730.97060.16688
390.0684360.74020.230316
400.0502510.54350.293895
410.0318530.34450.365529
420.010070.10890.456723
43-0.006867-0.07430.470458
44-0.026131-0.28260.388974
45-0.044846-0.48510.314262
46-0.062528-0.67630.25008
47-0.079281-0.85760.196444
48-0.096128-1.03980.150292

\begin{tabular}{lllllllll}
\hline
Autocorrelation Function \tabularnewline
Time lag k & ACF(k) & T-STAT & P-value \tabularnewline
1 & 0.970265 & 10.495 & 0 \tabularnewline
2 & 0.941253 & 10.1812 & 0 \tabularnewline
3 & 0.915691 & 9.9047 & 0 \tabularnewline
4 & 0.887657 & 9.6015 & 0 \tabularnewline
5 & 0.863261 & 9.3376 & 0 \tabularnewline
6 & 0.838334 & 9.068 & 0 \tabularnewline
7 & 0.811322 & 8.7758 & 0 \tabularnewline
8 & 0.785439 & 8.4958 & 0 \tabularnewline
9 & 0.762947 & 8.2525 & 0 \tabularnewline
10 & 0.734975 & 7.95 & 0 \tabularnewline
11 & 0.711644 & 7.6976 & 0 \tabularnewline
12 & 0.690135 & 7.4649 & 0 \tabularnewline
13 & 0.660452 & 7.1439 & 0 \tabularnewline
14 & 0.636797 & 6.888 & 0 \tabularnewline
15 & 0.610624 & 6.6049 & 0 \tabularnewline
16 & 0.582093 & 6.2963 & 0 \tabularnewline
17 & 0.559296 & 6.0497 & 0 \tabularnewline
18 & 0.534085 & 5.777 & 0 \tabularnewline
19 & 0.51042 & 5.521 & 0 \tabularnewline
20 & 0.487755 & 5.2759 & 0 \tabularnewline
21 & 0.464586 & 5.0253 & 1e-06 \tabularnewline
22 & 0.437562 & 4.733 & 3e-06 \tabularnewline
23 & 0.41561 & 4.4955 & 8e-06 \tabularnewline
24 & 0.394214 & 4.2641 & 2e-05 \tabularnewline
25 & 0.366785 & 3.9674 & 6.3e-05 \tabularnewline
26 & 0.345078 & 3.7326 & 0.000147 \tabularnewline
27 & 0.318964 & 3.4501 & 0.00039 \tabularnewline
28 & 0.296081 & 3.2026 & 0.000877 \tabularnewline
29 & 0.276173 & 2.9873 & 0.001715 \tabularnewline
30 & 0.252777 & 2.7342 & 0.003613 \tabularnewline
31 & 0.232719 & 2.5172 & 0.00659 \tabularnewline
32 & 0.212257 & 2.2959 & 0.011731 \tabularnewline
33 & 0.19178 & 2.0744 & 0.020117 \tabularnewline
34 & 0.169205 & 1.8302 & 0.034881 \tabularnewline
35 & 0.148874 & 1.6103 & 0.055011 \tabularnewline
36 & 0.129221 & 1.3977 & 0.082419 \tabularnewline
37 & 0.108699 & 1.1758 & 0.12104 \tabularnewline
38 & 0.08973 & 0.9706 & 0.16688 \tabularnewline
39 & 0.068436 & 0.7402 & 0.230316 \tabularnewline
40 & 0.050251 & 0.5435 & 0.293895 \tabularnewline
41 & 0.031853 & 0.3445 & 0.365529 \tabularnewline
42 & 0.01007 & 0.1089 & 0.456723 \tabularnewline
43 & -0.006867 & -0.0743 & 0.470458 \tabularnewline
44 & -0.026131 & -0.2826 & 0.388974 \tabularnewline
45 & -0.044846 & -0.4851 & 0.314262 \tabularnewline
46 & -0.062528 & -0.6763 & 0.25008 \tabularnewline
47 & -0.079281 & -0.8576 & 0.196444 \tabularnewline
48 & -0.096128 & -1.0398 & 0.150292 \tabularnewline
\hline
\end{tabular}
%Source: https://freestatistics.org/blog/index.php?pk=298422&T=1

[TABLE]
[ROW][C]Autocorrelation Function[/C][/ROW]
[ROW][C]Time lag k[/C][C]ACF(k)[/C][C]T-STAT[/C][C]P-value[/C][/ROW]
[ROW][C]1[/C][C]0.970265[/C][C]10.495[/C][C]0[/C][/ROW]
[ROW][C]2[/C][C]0.941253[/C][C]10.1812[/C][C]0[/C][/ROW]
[ROW][C]3[/C][C]0.915691[/C][C]9.9047[/C][C]0[/C][/ROW]
[ROW][C]4[/C][C]0.887657[/C][C]9.6015[/C][C]0[/C][/ROW]
[ROW][C]5[/C][C]0.863261[/C][C]9.3376[/C][C]0[/C][/ROW]
[ROW][C]6[/C][C]0.838334[/C][C]9.068[/C][C]0[/C][/ROW]
[ROW][C]7[/C][C]0.811322[/C][C]8.7758[/C][C]0[/C][/ROW]
[ROW][C]8[/C][C]0.785439[/C][C]8.4958[/C][C]0[/C][/ROW]
[ROW][C]9[/C][C]0.762947[/C][C]8.2525[/C][C]0[/C][/ROW]
[ROW][C]10[/C][C]0.734975[/C][C]7.95[/C][C]0[/C][/ROW]
[ROW][C]11[/C][C]0.711644[/C][C]7.6976[/C][C]0[/C][/ROW]
[ROW][C]12[/C][C]0.690135[/C][C]7.4649[/C][C]0[/C][/ROW]
[ROW][C]13[/C][C]0.660452[/C][C]7.1439[/C][C]0[/C][/ROW]
[ROW][C]14[/C][C]0.636797[/C][C]6.888[/C][C]0[/C][/ROW]
[ROW][C]15[/C][C]0.610624[/C][C]6.6049[/C][C]0[/C][/ROW]
[ROW][C]16[/C][C]0.582093[/C][C]6.2963[/C][C]0[/C][/ROW]
[ROW][C]17[/C][C]0.559296[/C][C]6.0497[/C][C]0[/C][/ROW]
[ROW][C]18[/C][C]0.534085[/C][C]5.777[/C][C]0[/C][/ROW]
[ROW][C]19[/C][C]0.51042[/C][C]5.521[/C][C]0[/C][/ROW]
[ROW][C]20[/C][C]0.487755[/C][C]5.2759[/C][C]0[/C][/ROW]
[ROW][C]21[/C][C]0.464586[/C][C]5.0253[/C][C]1e-06[/C][/ROW]
[ROW][C]22[/C][C]0.437562[/C][C]4.733[/C][C]3e-06[/C][/ROW]
[ROW][C]23[/C][C]0.41561[/C][C]4.4955[/C][C]8e-06[/C][/ROW]
[ROW][C]24[/C][C]0.394214[/C][C]4.2641[/C][C]2e-05[/C][/ROW]
[ROW][C]25[/C][C]0.366785[/C][C]3.9674[/C][C]6.3e-05[/C][/ROW]
[ROW][C]26[/C][C]0.345078[/C][C]3.7326[/C][C]0.000147[/C][/ROW]
[ROW][C]27[/C][C]0.318964[/C][C]3.4501[/C][C]0.00039[/C][/ROW]
[ROW][C]28[/C][C]0.296081[/C][C]3.2026[/C][C]0.000877[/C][/ROW]
[ROW][C]29[/C][C]0.276173[/C][C]2.9873[/C][C]0.001715[/C][/ROW]
[ROW][C]30[/C][C]0.252777[/C][C]2.7342[/C][C]0.003613[/C][/ROW]
[ROW][C]31[/C][C]0.232719[/C][C]2.5172[/C][C]0.00659[/C][/ROW]
[ROW][C]32[/C][C]0.212257[/C][C]2.2959[/C][C]0.011731[/C][/ROW]
[ROW][C]33[/C][C]0.19178[/C][C]2.0744[/C][C]0.020117[/C][/ROW]
[ROW][C]34[/C][C]0.169205[/C][C]1.8302[/C][C]0.034881[/C][/ROW]
[ROW][C]35[/C][C]0.148874[/C][C]1.6103[/C][C]0.055011[/C][/ROW]
[ROW][C]36[/C][C]0.129221[/C][C]1.3977[/C][C]0.082419[/C][/ROW]
[ROW][C]37[/C][C]0.108699[/C][C]1.1758[/C][C]0.12104[/C][/ROW]
[ROW][C]38[/C][C]0.08973[/C][C]0.9706[/C][C]0.16688[/C][/ROW]
[ROW][C]39[/C][C]0.068436[/C][C]0.7402[/C][C]0.230316[/C][/ROW]
[ROW][C]40[/C][C]0.050251[/C][C]0.5435[/C][C]0.293895[/C][/ROW]
[ROW][C]41[/C][C]0.031853[/C][C]0.3445[/C][C]0.365529[/C][/ROW]
[ROW][C]42[/C][C]0.01007[/C][C]0.1089[/C][C]0.456723[/C][/ROW]
[ROW][C]43[/C][C]-0.006867[/C][C]-0.0743[/C][C]0.470458[/C][/ROW]
[ROW][C]44[/C][C]-0.026131[/C][C]-0.2826[/C][C]0.388974[/C][/ROW]
[ROW][C]45[/C][C]-0.044846[/C][C]-0.4851[/C][C]0.314262[/C][/ROW]
[ROW][C]46[/C][C]-0.062528[/C][C]-0.6763[/C][C]0.25008[/C][/ROW]
[ROW][C]47[/C][C]-0.079281[/C][C]-0.8576[/C][C]0.196444[/C][/ROW]
[ROW][C]48[/C][C]-0.096128[/C][C]-1.0398[/C][C]0.150292[/C][/ROW]
[/TABLE]
Source: https://freestatistics.org/blog/index.php?pk=298422&T=1

Globally Unique Identifier (entire table): ba.freestatistics.org/blog/index.php?pk=298422&T=1

As an alternative you can also use a QR Code:  

The GUIDs for individual cells are displayed in the table below:

Autocorrelation Function
Time lag kACF(k)T-STATP-value
10.97026510.4950
20.94125310.18120
30.9156919.90470
40.8876579.60150
50.8632619.33760
60.8383349.0680
70.8113228.77580
80.7854398.49580
90.7629478.25250
100.7349757.950
110.7116447.69760
120.6901357.46490
130.6604527.14390
140.6367976.8880
150.6106246.60490
160.5820936.29630
170.5592966.04970
180.5340855.7770
190.510425.5210
200.4877555.27590
210.4645865.02531e-06
220.4375624.7333e-06
230.415614.49558e-06
240.3942144.26412e-05
250.3667853.96746.3e-05
260.3450783.73260.000147
270.3189643.45010.00039
280.2960813.20260.000877
290.2761732.98730.001715
300.2527772.73420.003613
310.2327192.51720.00659
320.2122572.29590.011731
330.191782.07440.020117
340.1692051.83020.034881
350.1488741.61030.055011
360.1292211.39770.082419
370.1086991.17580.12104
380.089730.97060.16688
390.0684360.74020.230316
400.0502510.54350.293895
410.0318530.34450.365529
420.010070.10890.456723
43-0.006867-0.07430.470458
44-0.026131-0.28260.388974
45-0.044846-0.48510.314262
46-0.062528-0.67630.25008
47-0.079281-0.85760.196444
48-0.096128-1.03980.150292


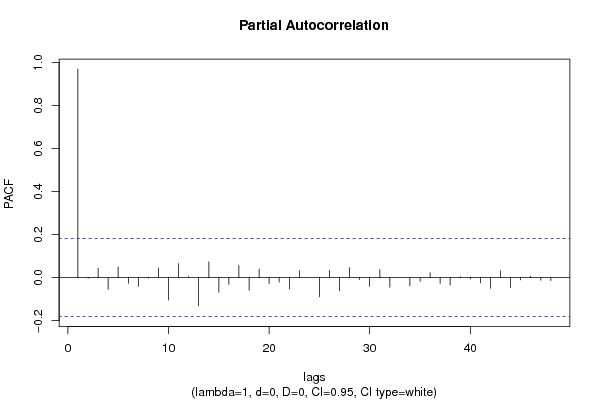
Partial Autocorrelation Function
Time lag kPACF(k)T-STATP-value
10.97026510.4950
2-0.002766-0.02990.488092
30.04410.4770.317119
4-0.054289-0.58720.27909
50.0500390.54130.294681
6-0.02602-0.28150.389429
7-0.040469-0.43770.331192
8-0.002286-0.02470.490158
90.045220.48910.312834
10-0.103795-1.12270.131929
110.0661160.71520.23797
120.0050630.05480.478209
13-0.1317-1.42460.078474
140.073490.79490.214136
15-0.068168-0.73730.231194
16-0.031351-0.33910.367567
170.0569280.61580.269621
18-0.057892-0.62620.266202
190.0402280.43510.332135
20-0.026793-0.28980.386239
21-0.020579-0.22260.412118
22-0.052594-0.56890.28526
230.0336530.3640.358251
24-0.000378-0.00410.498373
25-0.088891-0.96150.169142
260.0340210.3680.35677
27-0.061087-0.66080.255033
280.0468210.50640.306749
29-0.00874-0.09450.462424
30-0.039793-0.43040.333837
310.0365340.39520.346715
32-0.044707-0.48360.314794
33-0.000547-0.00590.497642
34-0.0379-0.40990.341296
35-0.016674-0.18040.428593
360.0227870.24650.402871
37-0.02647-0.28630.387573
38-0.034615-0.37440.354386
390.0038090.04120.483605
40-0.005572-0.06030.476023
41-0.024131-0.2610.397268
42-0.049136-0.53150.298043
430.0321340.34760.364389
44-0.045915-0.49660.310186
45-0.010116-0.10940.456529
460.0068760.07440.470418
47-0.012089-0.13080.448094
48-0.012869-0.13920.444768

\begin{tabular}{lllllllll}
\hline
Partial Autocorrelation Function \tabularnewline
Time lag k & PACF(k) & T-STAT & P-value \tabularnewline
1 & 0.970265 & 10.495 & 0 \tabularnewline
2 & -0.002766 & -0.0299 & 0.488092 \tabularnewline
3 & 0.0441 & 0.477 & 0.317119 \tabularnewline
4 & -0.054289 & -0.5872 & 0.27909 \tabularnewline
5 & 0.050039 & 0.5413 & 0.294681 \tabularnewline
6 & -0.02602 & -0.2815 & 0.389429 \tabularnewline
7 & -0.040469 & -0.4377 & 0.331192 \tabularnewline
8 & -0.002286 & -0.0247 & 0.490158 \tabularnewline
9 & 0.04522 & 0.4891 & 0.312834 \tabularnewline
10 & -0.103795 & -1.1227 & 0.131929 \tabularnewline
11 & 0.066116 & 0.7152 & 0.23797 \tabularnewline
12 & 0.005063 & 0.0548 & 0.478209 \tabularnewline
13 & -0.1317 & -1.4246 & 0.078474 \tabularnewline
14 & 0.07349 & 0.7949 & 0.214136 \tabularnewline
15 & -0.068168 & -0.7373 & 0.231194 \tabularnewline
16 & -0.031351 & -0.3391 & 0.367567 \tabularnewline
17 & 0.056928 & 0.6158 & 0.269621 \tabularnewline
18 & -0.057892 & -0.6262 & 0.266202 \tabularnewline
19 & 0.040228 & 0.4351 & 0.332135 \tabularnewline
20 & -0.026793 & -0.2898 & 0.386239 \tabularnewline
21 & -0.020579 & -0.2226 & 0.412118 \tabularnewline
22 & -0.052594 & -0.5689 & 0.28526 \tabularnewline
23 & 0.033653 & 0.364 & 0.358251 \tabularnewline
24 & -0.000378 & -0.0041 & 0.498373 \tabularnewline
25 & -0.088891 & -0.9615 & 0.169142 \tabularnewline
26 & 0.034021 & 0.368 & 0.35677 \tabularnewline
27 & -0.061087 & -0.6608 & 0.255033 \tabularnewline
28 & 0.046821 & 0.5064 & 0.306749 \tabularnewline
29 & -0.00874 & -0.0945 & 0.462424 \tabularnewline
30 & -0.039793 & -0.4304 & 0.333837 \tabularnewline
31 & 0.036534 & 0.3952 & 0.346715 \tabularnewline
32 & -0.044707 & -0.4836 & 0.314794 \tabularnewline
33 & -0.000547 & -0.0059 & 0.497642 \tabularnewline
34 & -0.0379 & -0.4099 & 0.341296 \tabularnewline
35 & -0.016674 & -0.1804 & 0.428593 \tabularnewline
36 & 0.022787 & 0.2465 & 0.402871 \tabularnewline
37 & -0.02647 & -0.2863 & 0.387573 \tabularnewline
38 & -0.034615 & -0.3744 & 0.354386 \tabularnewline
39 & 0.003809 & 0.0412 & 0.483605 \tabularnewline
40 & -0.005572 & -0.0603 & 0.476023 \tabularnewline
41 & -0.024131 & -0.261 & 0.397268 \tabularnewline
42 & -0.049136 & -0.5315 & 0.298043 \tabularnewline
43 & 0.032134 & 0.3476 & 0.364389 \tabularnewline
44 & -0.045915 & -0.4966 & 0.310186 \tabularnewline
45 & -0.010116 & -0.1094 & 0.456529 \tabularnewline
46 & 0.006876 & 0.0744 & 0.470418 \tabularnewline
47 & -0.012089 & -0.1308 & 0.448094 \tabularnewline
48 & -0.012869 & -0.1392 & 0.444768 \tabularnewline
\hline
\end{tabular}
%Source: https://freestatistics.org/blog/index.php?pk=298422&T=2

[TABLE]
[ROW][C]Partial Autocorrelation Function[/C][/ROW]
[ROW][C]Time lag k[/C][C]PACF(k)[/C][C]T-STAT[/C][C]P-value[/C][/ROW]
[ROW][C]1[/C][C]0.970265[/C][C]10.495[/C][C]0[/C][/ROW]
[ROW][C]2[/C][C]-0.002766[/C][C]-0.0299[/C][C]0.488092[/C][/ROW]
[ROW][C]3[/C][C]0.0441[/C][C]0.477[/C][C]0.317119[/C][/ROW]
[ROW][C]4[/C][C]-0.054289[/C][C]-0.5872[/C][C]0.27909[/C][/ROW]
[ROW][C]5[/C][C]0.050039[/C][C]0.5413[/C][C]0.294681[/C][/ROW]
[ROW][C]6[/C][C]-0.02602[/C][C]-0.2815[/C][C]0.389429[/C][/ROW]
[ROW][C]7[/C][C]-0.040469[/C][C]-0.4377[/C][C]0.331192[/C][/ROW]
[ROW][C]8[/C][C]-0.002286[/C][C]-0.0247[/C][C]0.490158[/C][/ROW]
[ROW][C]9[/C][C]0.04522[/C][C]0.4891[/C][C]0.312834[/C][/ROW]
[ROW][C]10[/C][C]-0.103795[/C][C]-1.1227[/C][C]0.131929[/C][/ROW]
[ROW][C]11[/C][C]0.066116[/C][C]0.7152[/C][C]0.23797[/C][/ROW]
[ROW][C]12[/C][C]0.005063[/C][C]0.0548[/C][C]0.478209[/C][/ROW]
[ROW][C]13[/C][C]-0.1317[/C][C]-1.4246[/C][C]0.078474[/C][/ROW]
[ROW][C]14[/C][C]0.07349[/C][C]0.7949[/C][C]0.214136[/C][/ROW]
[ROW][C]15[/C][C]-0.068168[/C][C]-0.7373[/C][C]0.231194[/C][/ROW]
[ROW][C]16[/C][C]-0.031351[/C][C]-0.3391[/C][C]0.367567[/C][/ROW]
[ROW][C]17[/C][C]0.056928[/C][C]0.6158[/C][C]0.269621[/C][/ROW]
[ROW][C]18[/C][C]-0.057892[/C][C]-0.6262[/C][C]0.266202[/C][/ROW]
[ROW][C]19[/C][C]0.040228[/C][C]0.4351[/C][C]0.332135[/C][/ROW]
[ROW][C]20[/C][C]-0.026793[/C][C]-0.2898[/C][C]0.386239[/C][/ROW]
[ROW][C]21[/C][C]-0.020579[/C][C]-0.2226[/C][C]0.412118[/C][/ROW]
[ROW][C]22[/C][C]-0.052594[/C][C]-0.5689[/C][C]0.28526[/C][/ROW]
[ROW][C]23[/C][C]0.033653[/C][C]0.364[/C][C]0.358251[/C][/ROW]
[ROW][C]24[/C][C]-0.000378[/C][C]-0.0041[/C][C]0.498373[/C][/ROW]
[ROW][C]25[/C][C]-0.088891[/C][C]-0.9615[/C][C]0.169142[/C][/ROW]
[ROW][C]26[/C][C]0.034021[/C][C]0.368[/C][C]0.35677[/C][/ROW]
[ROW][C]27[/C][C]-0.061087[/C][C]-0.6608[/C][C]0.255033[/C][/ROW]
[ROW][C]28[/C][C]0.046821[/C][C]0.5064[/C][C]0.306749[/C][/ROW]
[ROW][C]29[/C][C]-0.00874[/C][C]-0.0945[/C][C]0.462424[/C][/ROW]
[ROW][C]30[/C][C]-0.039793[/C][C]-0.4304[/C][C]0.333837[/C][/ROW]
[ROW][C]31[/C][C]0.036534[/C][C]0.3952[/C][C]0.346715[/C][/ROW]
[ROW][C]32[/C][C]-0.044707[/C][C]-0.4836[/C][C]0.314794[/C][/ROW]
[ROW][C]33[/C][C]-0.000547[/C][C]-0.0059[/C][C]0.497642[/C][/ROW]
[ROW][C]34[/C][C]-0.0379[/C][C]-0.4099[/C][C]0.341296[/C][/ROW]
[ROW][C]35[/C][C]-0.016674[/C][C]-0.1804[/C][C]0.428593[/C][/ROW]
[ROW][C]36[/C][C]0.022787[/C][C]0.2465[/C][C]0.402871[/C][/ROW]
[ROW][C]37[/C][C]-0.02647[/C][C]-0.2863[/C][C]0.387573[/C][/ROW]
[ROW][C]38[/C][C]-0.034615[/C][C]-0.3744[/C][C]0.354386[/C][/ROW]
[ROW][C]39[/C][C]0.003809[/C][C]0.0412[/C][C]0.483605[/C][/ROW]
[ROW][C]40[/C][C]-0.005572[/C][C]-0.0603[/C][C]0.476023[/C][/ROW]
[ROW][C]41[/C][C]-0.024131[/C][C]-0.261[/C][C]0.397268[/C][/ROW]
[ROW][C]42[/C][C]-0.049136[/C][C]-0.5315[/C][C]0.298043[/C][/ROW]
[ROW][C]43[/C][C]0.032134[/C][C]0.3476[/C][C]0.364389[/C][/ROW]
[ROW][C]44[/C][C]-0.045915[/C][C]-0.4966[/C][C]0.310186[/C][/ROW]
[ROW][C]45[/C][C]-0.010116[/C][C]-0.1094[/C][C]0.456529[/C][/ROW]
[ROW][C]46[/C][C]0.006876[/C][C]0.0744[/C][C]0.470418[/C][/ROW]
[ROW][C]47[/C][C]-0.012089[/C][C]-0.1308[/C][C]0.448094[/C][/ROW]
[ROW][C]48[/C][C]-0.012869[/C][C]-0.1392[/C][C]0.444768[/C][/ROW]
[/TABLE]
Source: https://freestatistics.org/blog/index.php?pk=298422&T=2

Globally Unique Identifier (entire table): ba.freestatistics.org/blog/index.php?pk=298422&T=2

As an alternative you can also use a QR Code:  

The GUIDs for individual cells are displayed in the table below:

Partial Autocorrelation Function
Time lag kPACF(k)T-STATP-value
10.97026510.4950
2-0.002766-0.02990.488092
30.04410.4770.317119
4-0.054289-0.58720.27909
50.0500390.54130.294681
6-0.02602-0.28150.389429
7-0.040469-0.43770.331192
8-0.002286-0.02470.490158
90.045220.48910.312834
10-0.103795-1.12270.131929
110.0661160.71520.23797
120.0050630.05480.478209
13-0.1317-1.42460.078474
140.073490.79490.214136
15-0.068168-0.73730.231194
16-0.031351-0.33910.367567
170.0569280.61580.269621
18-0.057892-0.62620.266202
190.0402280.43510.332135
20-0.026793-0.28980.386239
21-0.020579-0.22260.412118
22-0.052594-0.56890.28526
230.0336530.3640.358251
24-0.000378-0.00410.498373
25-0.088891-0.96150.169142
260.0340210.3680.35677
27-0.061087-0.66080.255033
280.0468210.50640.306749
29-0.00874-0.09450.462424
30-0.039793-0.43040.333837
310.0365340.39520.346715
32-0.044707-0.48360.314794
33-0.000547-0.00590.497642
34-0.0379-0.40990.341296
35-0.016674-0.18040.428593
360.0227870.24650.402871
37-0.02647-0.28630.387573
38-0.034615-0.37440.354386
390.0038090.04120.483605
40-0.005572-0.06030.476023
41-0.024131-0.2610.397268
42-0.049136-0.53150.298043
430.0321340.34760.364389
44-0.045915-0.49660.310186
45-0.010116-0.10940.456529
460.0068760.07440.470418
47-0.012089-0.13080.448094
48-0.012869-0.13920.444768


Parameters (Session):
par1 = 48 ; par2 = 1 ; par3 = 0 ; par4 = 0 ; par5 = 1 ; par6 = White Noise ; par7 = 0.95 ;
Parameters (R input):
par1 = 48 ; par2 = 1 ; par3 = 0 ; par4 = 0 ; par5 = 1 ; par6 = White Noise ; par7 = 0.95 ; par8 = ;
R code (references can be found in the software module):
if (par1 == 'Default') {
par1 = 10*log10(length(x))
} else {
par1 <- as.numeric(par1)
}
par2 <- as.numeric(par2)
par3 <- as.numeric(par3)
par4 <- as.numeric(par4)
par5 <- as.numeric(par5)
if (par6 == 'White Noise') par6 <- 'white' else par6 <- 'ma'
par7 <- as.numeric(par7)
if (par8 != '') par8 <- as.numeric(par8)
x <- na.omit(x)
ox <- x
if (par8 == '') {
if (par2 == 0) {
x <- log(x)
} else {
x <- (x ^ par2 - 1) / par2
}
} else {
x <- log(x,base=par8)
}
if (par3 > 0) x <- diff(x,lag=1,difference=par3)
if (par4 > 0) x <- diff(x,lag=par5,difference=par4)
bitmap(file='picts.png')
op <- par(mfrow=c(2,1))
plot(ox,type='l',main='Original Time Series',xlab='time',ylab='value')
if (par8=='') {
mytitle <- paste('Working Time Series (lambda=',par2,', d=',par3,', D=',par4,')',sep='')
mysub <- paste('(lambda=',par2,', d=',par3,', D=',par4,', CI=', par7, ', CI type=',par6,')',sep='')
} else {
mytitle <- paste('Working Time Series (base=',par8,', d=',par3,', D=',par4,')',sep='')
mysub <- paste('(base=',par8,', d=',par3,', D=',par4,', CI=', par7, ', CI type=',par6,')',sep='')
}
plot(x,type='l', main=mytitle,xlab='time',ylab='value')
par(op)
dev.off()
bitmap(file='pic1.png')
racf <- acf(x, par1, main='Autocorrelation', xlab='time lag', ylab='ACF', ci.type=par6, ci=par7, sub=mysub)
dev.off()
bitmap(file='pic2.png')
rpacf <- pacf(x,par1,main='Partial Autocorrelation',xlab='lags',ylab='PACF',sub=mysub)
dev.off()
(myacf <- c(racf$acf))
(mypacf <- c(rpacf$acf))
lengthx <- length(x)
sqrtn <- sqrt(lengthx)
load(file='createtable')
a<-table.start()
a<-table.row.start(a)
a<-table.element(a,'Autocorrelation Function',4,TRUE)
a<-table.row.end(a)
a<-table.row.start(a)
a<-table.element(a,'Time lag k',header=TRUE)
a<-table.element(a,'ACF(k)',header=TRUE)
a<-table.element(a,'T-STAT',header=TRUE)
a<-table.element(a,'P-value',header=TRUE)
a<-table.row.end(a)
for (i in 2:(par1+1)) {
a<-table.row.start(a)
a<-table.element(a,i-1,header=TRUE)
a<-table.element(a,round(myacf[i],6))
mytstat <- myacf[i]*sqrtn
a<-table.element(a,round(mytstat,4))
a<-table.element(a,round(1-pt(abs(mytstat),lengthx),6))
a<-table.row.end(a)
}
a<-table.end(a)
table.save(a,file='mytable.tab')
a<-table.start()
a<-table.row.start(a)
a<-table.element(a,'Partial Autocorrelation Function',4,TRUE)
a<-table.row.end(a)
a<-table.row.start(a)
a<-table.element(a,'Time lag k',header=TRUE)
a<-table.element(a,'PACF(k)',header=TRUE)
a<-table.element(a,'T-STAT',header=TRUE)
a<-table.element(a,'P-value',header=TRUE)
a<-table.row.end(a)
for (i in 1:par1) {
a<-table.row.start(a)
a<-table.element(a,i,header=TRUE)
a<-table.element(a,round(mypacf[i],6))
mytstat <- mypacf[i]*sqrtn
a<-table.element(a,round(mytstat,4))
a<-table.element(a,round(1-pt(abs(mytstat),lengthx),6))
a<-table.row.end(a)
}
a<-table.end(a)
table.save(a,file='mytable1.tab')