Free Statistics

of Irreproducible Research!

Author's title

Author*The author of this computation has been verified*
R Software Modulerwasp_autocorrelation.wasp
Title produced by software(Partial) Autocorrelation Function
Date of computationSun, 04 Dec 2016 16:57:20 +0100
Cite this page as followsStatistical Computations at FreeStatistics.org, Office for Research Development and Education, URL https://freestatistics.org/blog/index.php?v=date/2016/Dec/04/t1480867241bkymal31el0qkhu.htm/, Retrieved Sat, 18 May 2024 06:15:19 +0000
Statistical Computations at FreeStatistics.org, Office for Research Development and Education, URL https://freestatistics.org/blog/index.php?pk=297678, Retrieved Sat, 18 May 2024 06:15:19 +0000
QR Codes:

Original text written by user:
IsPrivate?No (this computation is public)
User-defined keywords
Estimated Impact131
Family? (F = Feedback message, R = changed R code, M = changed R Module, P = changed Parameters, D = changed Data)
-       [(Partial) Autocorrelation Function] [] [2016-12-04 15:57:20] [6deb082de88ded72ec069288c69f9f98] [Current]
Feedback Forum

Post a new message
Dataseries X:
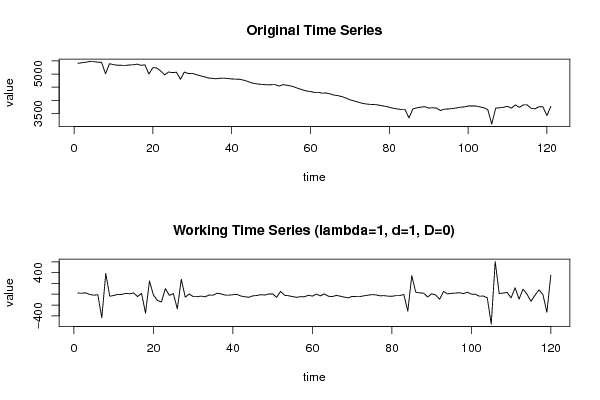
5410.4
5432.2
5452.9
5477.6
5472.5
5454.9
5446
5010.6
5395.9
5360
5336.9
5333.9
5329.6
5345.7
5353.8
5377.2
5334.1
5351.1
5001
5246.4
5230
5115.8
4972.6
5077.6
5056.9
5070.7
4799.3
5076
5021.5
5026.4
4981.9
4936.6
4901.8
4853.8
4839.2
4821.3
4840.5
4847.6
4832.3
4814.7
4806.4
4803.4
4770.3
4723.4
4667.1
4636.8
4613.2
4605.3
4590.4
4595.4
4600.1
4543.3
4596.4
4575.4
4547.9
4503.7
4446.3
4401.4
4354.3
4336.3
4300.9
4304.1
4273.2
4279.9
4243.1
4199.1
4177.6
4141.7
4088.3
4021.4
3981.2
3937.2
3893.1
3864.7
3847.8
3840.8
3828.4
3798.6
3773
3737.8
3699
3674
3648.8
3645.6
3331
3674.7
3714.5
3739.7
3759.7
3708.6
3717.3
3705.3
3612.8
3665
3670.8
3687.6
3708.2
3737.2
3748.7
3785.3
3787.1
3785.8
3749.7
3716.3
3650
3096.9
3703.2
3716
3736.9
3771.9
3704
3824.2
3733.5
3827.5
3827.6
3696.5
3675.8
3757.5
3753.3
3418.7
3772.9


Summary of computational transaction
Raw Input view raw input (R code)
Raw Outputview raw output of R engine
Computing time1 seconds
R ServerBig Analytics Cloud Computing Center

\begin{tabular}{lllllllll}
\hline
Summary of computational transaction \tabularnewline
Raw Input view raw input (R code)  \tabularnewline
Raw Outputview raw output of R engine  \tabularnewline
Computing time1 seconds \tabularnewline
R ServerBig Analytics Cloud Computing Center \tabularnewline
\hline
\end{tabular}
%Source: https://freestatistics.org/blog/index.php?pk=297678&T=0

[TABLE]
[ROW]
Summary of computational transaction[/C][/ROW] [ROW]Raw Input[/C] view raw input (R code) [/C][/ROW] [ROW]Raw Output[/C]view raw output of R engine [/C][/ROW] [ROW]Computing time[/C]1 seconds[/C][/ROW] [ROW]R Server[/C]Big Analytics Cloud Computing Center[/C][/ROW] [/TABLE] Source: https://freestatistics.org/blog/index.php?pk=297678&T=0

Globally Unique Identifier (entire table): ba.freestatistics.org/blog/index.php?pk=297678&T=0

As an alternative you can also use a QR Code:  

The GUIDs for individual cells are displayed in the table below:

Summary of computational transaction
Raw Input view raw input (R code)
Raw Outputview raw output of R engine
Computing time1 seconds
R ServerBig Analytics Cloud Computing Center


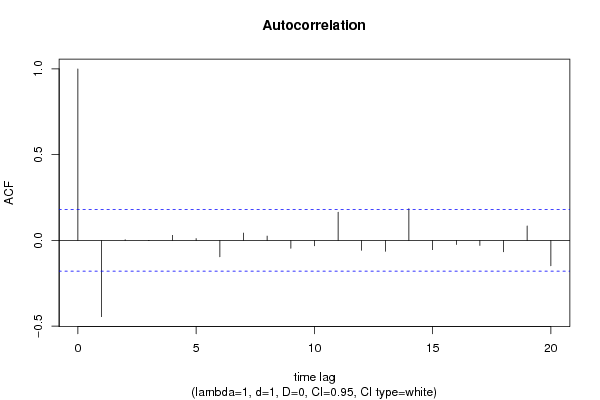
Autocorrelation Function
Time lag kACF(k)T-STATP-value
1-0.444617-4.87052e-06
20.0038570.04220.483186
3-0.00106-0.01160.495376
40.0294390.32250.373821
50.0106720.11690.453566
6-0.095139-1.04220.149709
70.0424490.4650.321384
80.0252110.27620.391447
9-0.045283-0.4960.310385
10-0.031458-0.34460.365497
110.1646191.80330.036925
12-0.057-0.62440.266775
13-0.063175-0.6920.245123
140.1845032.02110.022746
15-0.053873-0.59010.2781
16-0.024229-0.26540.395574
17-0.029159-0.31940.374983
18-0.06629-0.72620.234575
190.0842050.92240.17908
20-0.147752-1.61850.054086

\begin{tabular}{lllllllll}
\hline
Autocorrelation Function \tabularnewline
Time lag k & ACF(k) & T-STAT & P-value \tabularnewline
1 & -0.444617 & -4.8705 & 2e-06 \tabularnewline
2 & 0.003857 & 0.0422 & 0.483186 \tabularnewline
3 & -0.00106 & -0.0116 & 0.495376 \tabularnewline
4 & 0.029439 & 0.3225 & 0.373821 \tabularnewline
5 & 0.010672 & 0.1169 & 0.453566 \tabularnewline
6 & -0.095139 & -1.0422 & 0.149709 \tabularnewline
7 & 0.042449 & 0.465 & 0.321384 \tabularnewline
8 & 0.025211 & 0.2762 & 0.391447 \tabularnewline
9 & -0.045283 & -0.496 & 0.310385 \tabularnewline
10 & -0.031458 & -0.3446 & 0.365497 \tabularnewline
11 & 0.164619 & 1.8033 & 0.036925 \tabularnewline
12 & -0.057 & -0.6244 & 0.266775 \tabularnewline
13 & -0.063175 & -0.692 & 0.245123 \tabularnewline
14 & 0.184503 & 2.0211 & 0.022746 \tabularnewline
15 & -0.053873 & -0.5901 & 0.2781 \tabularnewline
16 & -0.024229 & -0.2654 & 0.395574 \tabularnewline
17 & -0.029159 & -0.3194 & 0.374983 \tabularnewline
18 & -0.06629 & -0.7262 & 0.234575 \tabularnewline
19 & 0.084205 & 0.9224 & 0.17908 \tabularnewline
20 & -0.147752 & -1.6185 & 0.054086 \tabularnewline
\hline
\end{tabular}
%Source: https://freestatistics.org/blog/index.php?pk=297678&T=1

[TABLE]
[ROW][C]Autocorrelation Function[/C][/ROW]
[ROW][C]Time lag k[/C][C]ACF(k)[/C][C]T-STAT[/C][C]P-value[/C][/ROW]
[ROW][C]1[/C][C]-0.444617[/C][C]-4.8705[/C][C]2e-06[/C][/ROW]
[ROW][C]2[/C][C]0.003857[/C][C]0.0422[/C][C]0.483186[/C][/ROW]
[ROW][C]3[/C][C]-0.00106[/C][C]-0.0116[/C][C]0.495376[/C][/ROW]
[ROW][C]4[/C][C]0.029439[/C][C]0.3225[/C][C]0.373821[/C][/ROW]
[ROW][C]5[/C][C]0.010672[/C][C]0.1169[/C][C]0.453566[/C][/ROW]
[ROW][C]6[/C][C]-0.095139[/C][C]-1.0422[/C][C]0.149709[/C][/ROW]
[ROW][C]7[/C][C]0.042449[/C][C]0.465[/C][C]0.321384[/C][/ROW]
[ROW][C]8[/C][C]0.025211[/C][C]0.2762[/C][C]0.391447[/C][/ROW]
[ROW][C]9[/C][C]-0.045283[/C][C]-0.496[/C][C]0.310385[/C][/ROW]
[ROW][C]10[/C][C]-0.031458[/C][C]-0.3446[/C][C]0.365497[/C][/ROW]
[ROW][C]11[/C][C]0.164619[/C][C]1.8033[/C][C]0.036925[/C][/ROW]
[ROW][C]12[/C][C]-0.057[/C][C]-0.6244[/C][C]0.266775[/C][/ROW]
[ROW][C]13[/C][C]-0.063175[/C][C]-0.692[/C][C]0.245123[/C][/ROW]
[ROW][C]14[/C][C]0.184503[/C][C]2.0211[/C][C]0.022746[/C][/ROW]
[ROW][C]15[/C][C]-0.053873[/C][C]-0.5901[/C][C]0.2781[/C][/ROW]
[ROW][C]16[/C][C]-0.024229[/C][C]-0.2654[/C][C]0.395574[/C][/ROW]
[ROW][C]17[/C][C]-0.029159[/C][C]-0.3194[/C][C]0.374983[/C][/ROW]
[ROW][C]18[/C][C]-0.06629[/C][C]-0.7262[/C][C]0.234575[/C][/ROW]
[ROW][C]19[/C][C]0.084205[/C][C]0.9224[/C][C]0.17908[/C][/ROW]
[ROW][C]20[/C][C]-0.147752[/C][C]-1.6185[/C][C]0.054086[/C][/ROW]
[/TABLE]
Source: https://freestatistics.org/blog/index.php?pk=297678&T=1

Globally Unique Identifier (entire table): ba.freestatistics.org/blog/index.php?pk=297678&T=1

As an alternative you can also use a QR Code:  

The GUIDs for individual cells are displayed in the table below:

Autocorrelation Function
Time lag kACF(k)T-STATP-value
1-0.444617-4.87052e-06
20.0038570.04220.483186
3-0.00106-0.01160.495376
40.0294390.32250.373821
50.0106720.11690.453566
6-0.095139-1.04220.149709
70.0424490.4650.321384
80.0252110.27620.391447
9-0.045283-0.4960.310385
10-0.031458-0.34460.365497
110.1646191.80330.036925
12-0.057-0.62440.266775
13-0.063175-0.6920.245123
140.1845032.02110.022746
15-0.053873-0.59010.2781
16-0.024229-0.26540.395574
17-0.029159-0.31940.374983
18-0.06629-0.72620.234575
190.0842050.92240.17908
20-0.147752-1.61850.054086


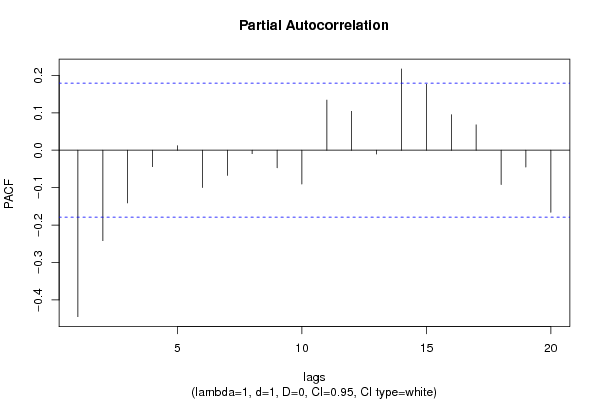
Partial Autocorrelation Function
Time lag kPACF(k)T-STATP-value
1-0.444617-4.87052e-06
2-0.241586-2.64640.004613
3-0.140762-1.5420.062857
4-0.043937-0.48130.315589
50.0119880.13130.447871
6-0.099827-1.09360.138171
7-0.067208-0.73620.231516
8-0.009143-0.10020.460193
9-0.047058-0.51550.303577
10-0.09029-0.98910.162308
110.1337841.46550.072695
120.1037841.13690.128924
13-0.009946-0.1090.45671
140.2170692.37790.009496
150.1764251.93260.027818
160.0946791.03720.150875
170.0678050.74280.229538
18-0.091482-1.00210.159148
19-0.044785-0.49060.312305
20-0.165613-1.81420.036073

\begin{tabular}{lllllllll}
\hline
Partial Autocorrelation Function \tabularnewline
Time lag k & PACF(k) & T-STAT & P-value \tabularnewline
1 & -0.444617 & -4.8705 & 2e-06 \tabularnewline
2 & -0.241586 & -2.6464 & 0.004613 \tabularnewline
3 & -0.140762 & -1.542 & 0.062857 \tabularnewline
4 & -0.043937 & -0.4813 & 0.315589 \tabularnewline
5 & 0.011988 & 0.1313 & 0.447871 \tabularnewline
6 & -0.099827 & -1.0936 & 0.138171 \tabularnewline
7 & -0.067208 & -0.7362 & 0.231516 \tabularnewline
8 & -0.009143 & -0.1002 & 0.460193 \tabularnewline
9 & -0.047058 & -0.5155 & 0.303577 \tabularnewline
10 & -0.09029 & -0.9891 & 0.162308 \tabularnewline
11 & 0.133784 & 1.4655 & 0.072695 \tabularnewline
12 & 0.103784 & 1.1369 & 0.128924 \tabularnewline
13 & -0.009946 & -0.109 & 0.45671 \tabularnewline
14 & 0.217069 & 2.3779 & 0.009496 \tabularnewline
15 & 0.176425 & 1.9326 & 0.027818 \tabularnewline
16 & 0.094679 & 1.0372 & 0.150875 \tabularnewline
17 & 0.067805 & 0.7428 & 0.229538 \tabularnewline
18 & -0.091482 & -1.0021 & 0.159148 \tabularnewline
19 & -0.044785 & -0.4906 & 0.312305 \tabularnewline
20 & -0.165613 & -1.8142 & 0.036073 \tabularnewline
\hline
\end{tabular}
%Source: https://freestatistics.org/blog/index.php?pk=297678&T=2

[TABLE]
[ROW][C]Partial Autocorrelation Function[/C][/ROW]
[ROW][C]Time lag k[/C][C]PACF(k)[/C][C]T-STAT[/C][C]P-value[/C][/ROW]
[ROW][C]1[/C][C]-0.444617[/C][C]-4.8705[/C][C]2e-06[/C][/ROW]
[ROW][C]2[/C][C]-0.241586[/C][C]-2.6464[/C][C]0.004613[/C][/ROW]
[ROW][C]3[/C][C]-0.140762[/C][C]-1.542[/C][C]0.062857[/C][/ROW]
[ROW][C]4[/C][C]-0.043937[/C][C]-0.4813[/C][C]0.315589[/C][/ROW]
[ROW][C]5[/C][C]0.011988[/C][C]0.1313[/C][C]0.447871[/C][/ROW]
[ROW][C]6[/C][C]-0.099827[/C][C]-1.0936[/C][C]0.138171[/C][/ROW]
[ROW][C]7[/C][C]-0.067208[/C][C]-0.7362[/C][C]0.231516[/C][/ROW]
[ROW][C]8[/C][C]-0.009143[/C][C]-0.1002[/C][C]0.460193[/C][/ROW]
[ROW][C]9[/C][C]-0.047058[/C][C]-0.5155[/C][C]0.303577[/C][/ROW]
[ROW][C]10[/C][C]-0.09029[/C][C]-0.9891[/C][C]0.162308[/C][/ROW]
[ROW][C]11[/C][C]0.133784[/C][C]1.4655[/C][C]0.072695[/C][/ROW]
[ROW][C]12[/C][C]0.103784[/C][C]1.1369[/C][C]0.128924[/C][/ROW]
[ROW][C]13[/C][C]-0.009946[/C][C]-0.109[/C][C]0.45671[/C][/ROW]
[ROW][C]14[/C][C]0.217069[/C][C]2.3779[/C][C]0.009496[/C][/ROW]
[ROW][C]15[/C][C]0.176425[/C][C]1.9326[/C][C]0.027818[/C][/ROW]
[ROW][C]16[/C][C]0.094679[/C][C]1.0372[/C][C]0.150875[/C][/ROW]
[ROW][C]17[/C][C]0.067805[/C][C]0.7428[/C][C]0.229538[/C][/ROW]
[ROW][C]18[/C][C]-0.091482[/C][C]-1.0021[/C][C]0.159148[/C][/ROW]
[ROW][C]19[/C][C]-0.044785[/C][C]-0.4906[/C][C]0.312305[/C][/ROW]
[ROW][C]20[/C][C]-0.165613[/C][C]-1.8142[/C][C]0.036073[/C][/ROW]
[/TABLE]
Source: https://freestatistics.org/blog/index.php?pk=297678&T=2

Globally Unique Identifier (entire table): ba.freestatistics.org/blog/index.php?pk=297678&T=2

As an alternative you can also use a QR Code:  

The GUIDs for individual cells are displayed in the table below:

Partial Autocorrelation Function
Time lag kPACF(k)T-STATP-value
1-0.444617-4.87052e-06
2-0.241586-2.64640.004613
3-0.140762-1.5420.062857
4-0.043937-0.48130.315589
50.0119880.13130.447871
6-0.099827-1.09360.138171
7-0.067208-0.73620.231516
8-0.009143-0.10020.460193
9-0.047058-0.51550.303577
10-0.09029-0.98910.162308
110.1337841.46550.072695
120.1037841.13690.128924
13-0.009946-0.1090.45671
140.2170692.37790.009496
150.1764251.93260.027818
160.0946791.03720.150875
170.0678050.74280.229538
18-0.091482-1.00210.159148
19-0.044785-0.49060.312305
20-0.165613-1.81420.036073


Parameters (Session):
par1 = Default ; par2 = 1 ; par3 = 1 ; par4 = 0 ; par5 = 12 ; par6 = White Noise ; par7 = 0.95 ;
Parameters (R input):
par1 = Default ; par2 = 1 ; par3 = 1 ; par4 = 0 ; par5 = 12 ; par6 = White Noise ; par7 = 0.95 ; par8 = ;
R code (references can be found in the software module):
if (par1 == 'Default') {
par1 = 10*log10(length(x))
} else {
par1 <- as.numeric(par1)
}
par2 <- as.numeric(par2)
par3 <- as.numeric(par3)
par4 <- as.numeric(par4)
par5 <- as.numeric(par5)
if (par6 == 'White Noise') par6 <- 'white' else par6 <- 'ma'
par7 <- as.numeric(par7)
if (par8 != '') par8 <- as.numeric(par8)
x <- na.omit(x)
ox <- x
if (par8 == '') {
if (par2 == 0) {
x <- log(x)
} else {
x <- (x ^ par2 - 1) / par2
}
} else {
x <- log(x,base=par8)
}
if (par3 > 0) x <- diff(x,lag=1,difference=par3)
if (par4 > 0) x <- diff(x,lag=par5,difference=par4)
bitmap(file='picts.png')
op <- par(mfrow=c(2,1))
plot(ox,type='l',main='Original Time Series',xlab='time',ylab='value')
if (par8=='') {
mytitle <- paste('Working Time Series (lambda=',par2,', d=',par3,', D=',par4,')',sep='')
mysub <- paste('(lambda=',par2,', d=',par3,', D=',par4,', CI=', par7, ', CI type=',par6,')',sep='')
} else {
mytitle <- paste('Working Time Series (base=',par8,', d=',par3,', D=',par4,')',sep='')
mysub <- paste('(base=',par8,', d=',par3,', D=',par4,', CI=', par7, ', CI type=',par6,')',sep='')
}
plot(x,type='l', main=mytitle,xlab='time',ylab='value')
par(op)
dev.off()
bitmap(file='pic1.png')
racf <- acf(x, par1, main='Autocorrelation', xlab='time lag', ylab='ACF', ci.type=par6, ci=par7, sub=mysub)
dev.off()
bitmap(file='pic2.png')
rpacf <- pacf(x,par1,main='Partial Autocorrelation',xlab='lags',ylab='PACF',sub=mysub)
dev.off()
(myacf <- c(racf$acf))
(mypacf <- c(rpacf$acf))
lengthx <- length(x)
sqrtn <- sqrt(lengthx)
load(file='createtable')
a<-table.start()
a<-table.row.start(a)
a<-table.element(a,'Autocorrelation Function',4,TRUE)
a<-table.row.end(a)
a<-table.row.start(a)
a<-table.element(a,'Time lag k',header=TRUE)
a<-table.element(a,'ACF(k)',header=TRUE)
a<-table.element(a,'T-STAT',header=TRUE)
a<-table.element(a,'P-value',header=TRUE)
a<-table.row.end(a)
for (i in 2:(par1+1)) {
a<-table.row.start(a)
a<-table.element(a,i-1,header=TRUE)
a<-table.element(a,round(myacf[i],6))
mytstat <- myacf[i]*sqrtn
a<-table.element(a,round(mytstat,4))
a<-table.element(a,round(1-pt(abs(mytstat),lengthx),6))
a<-table.row.end(a)
}
a<-table.end(a)
table.save(a,file='mytable.tab')
a<-table.start()
a<-table.row.start(a)
a<-table.element(a,'Partial Autocorrelation Function',4,TRUE)
a<-table.row.end(a)
a<-table.row.start(a)
a<-table.element(a,'Time lag k',header=TRUE)
a<-table.element(a,'PACF(k)',header=TRUE)
a<-table.element(a,'T-STAT',header=TRUE)
a<-table.element(a,'P-value',header=TRUE)
a<-table.row.end(a)
for (i in 1:par1) {
a<-table.row.start(a)
a<-table.element(a,i,header=TRUE)
a<-table.element(a,round(mypacf[i],6))
mytstat <- mypacf[i]*sqrtn
a<-table.element(a,round(mytstat,4))
a<-table.element(a,round(1-pt(abs(mytstat),lengthx),6))
a<-table.row.end(a)
}
a<-table.end(a)
table.save(a,file='mytable1.tab')