Free Statistics

of Irreproducible Research!

Author's title

Author*Unverified author*
R Software Modulerwasp_autocorrelation.wasp
Title produced by software(Partial) Autocorrelation Function
Date of computationSat, 24 Oct 2015 14:46:38 +0100
Cite this page as followsStatistical Computations at FreeStatistics.org, Office for Research Development and Education, URL https://freestatistics.org/blog/index.php?v=date/2015/Oct/24/t1445694447zoaqtccir8ds8b8.htm/, Retrieved Sat, 18 May 2024 17:58:54 +0000
Statistical Computations at FreeStatistics.org, Office for Research Development and Education, URL https://freestatistics.org/blog/index.php?pk=283040, Retrieved Sat, 18 May 2024 17:58:54 +0000
QR Codes:

Original text written by user:
IsPrivate?No (this computation is public)
User-defined keywords
Estimated Impact116
Family? (F = Feedback message, R = changed R code, M = changed R Module, P = changed Parameters, D = changed Data)
-       [(Partial) Autocorrelation Function] [] [2015-10-24 13:46:38] [4b96c7bb02a36edde4d8c72e28fc1c90] [Current]
Feedback Forum

Post a new message
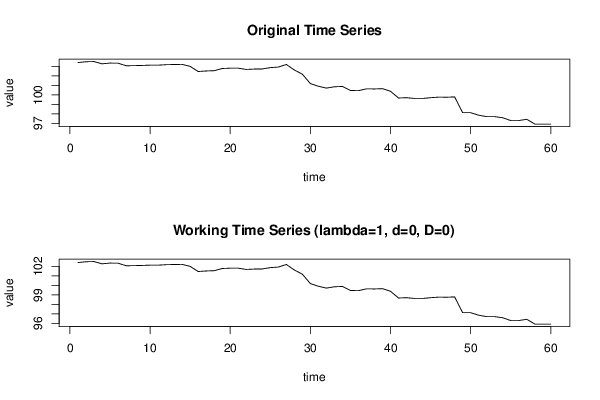
Dataseries X:
103.4
103.49
103.51
103.27
103.35
103.34
103.07
103.08
103.1
103.13
103.13
103.18
103.2
103.21
103
102.46
102.52
102.55
102.78
102.81
102.81
102.68
102.72
102.73
102.87
102.93
103.2
102.62
102.18
101.19
100.91
100.72
100.86
100.89
100.47
100.45
100.64
100.63
100.66
100.38
99.68
99.71
99.63
99.63
99.71
99.77
99.76
99.79
98.13
98.13
97.87
97.72
97.72
97.6
97.31
97.31
97.44
96.94
96.94
96.94


Summary of computational transaction
Raw Inputview raw input (R code)
Raw Outputview raw output of R engine
Computing time2 seconds
R Server'Gertrude Mary Cox' @ cox.wessa.net

\begin{tabular}{lllllllll}
\hline
Summary of computational transaction \tabularnewline
Raw Input & view raw input (R code)  \tabularnewline
Raw Output & view raw output of R engine  \tabularnewline
Computing time & 2 seconds \tabularnewline
R Server & 'Gertrude Mary Cox' @ cox.wessa.net \tabularnewline
\hline
\end{tabular}
%Source: https://freestatistics.org/blog/index.php?pk=283040&T=0

[TABLE]
[ROW][C]Summary of computational transaction[/C][/ROW]
[ROW][C]Raw Input[/C][C]view raw input (R code) [/C][/ROW]
[ROW][C]Raw Output[/C][C]view raw output of R engine [/C][/ROW]
[ROW][C]Computing time[/C][C]2 seconds[/C][/ROW]
[ROW][C]R Server[/C][C]'Gertrude Mary Cox' @ cox.wessa.net[/C][/ROW]
[/TABLE]
Source: https://freestatistics.org/blog/index.php?pk=283040&T=0

Globally Unique Identifier (entire table): ba.freestatistics.org/blog/index.php?pk=283040&T=0

As an alternative you can also use a QR Code:  

The GUIDs for individual cells are displayed in the table below:

Summary of computational transaction
Raw Inputview raw input (R code)
Raw Outputview raw output of R engine
Computing time2 seconds
R Server'Gertrude Mary Cox' @ cox.wessa.net


Autocorrelation Function
Time lag kACF(k)T-STATP-value
10.9487967.34930
20.8930646.91760
30.8336666.45760
40.7835796.06960
50.7320545.67050
60.6798595.26621e-06
70.6301094.88084e-06
80.581764.50631.6e-05
90.5296744.10286.2e-05
100.4748593.67820.000252
110.4227613.27470.00088
120.3682572.85250.002971
130.3363792.60560.005775
140.3014442.3350.011454
150.2638922.04410.02267
160.2291631.77510.040477
170.1942871.50490.068793
180.1573751.2190.113804
190.1183380.91660.181499
200.0715610.55430.290714
210.0316220.24490.403667
22-0.006991-0.05420.478498
23-0.045175-0.34990.36381
24-0.085159-0.65960.256005
25-0.130069-1.00750.158867
26-0.177717-1.37660.086878
27-0.222916-1.72670.044684
28-0.264949-2.05230.022256
29-0.30678-2.37630.010348
30-0.337355-2.61310.005661
31-0.360602-2.79320.003497
32-0.367363-2.84560.003029
33-0.368188-2.8520.002976
34-0.363662-2.81690.003277
35-0.361404-2.79940.003438
36-0.359959-2.78820.003545
37-0.362649-2.80910.003348
38-0.365771-2.83320.003133
39-0.369669-2.86340.002883
40-0.369101-2.8590.002918
41-0.362685-2.80930.003346
42-0.356392-2.76060.003821
43-0.355126-2.75080.003924
44-0.354712-2.74760.003958
45-0.355595-2.75440.003886
46-0.350617-2.71590.004311
47-0.342193-2.65060.00513
48-0.333935-2.58670.006067

\begin{tabular}{lllllllll}
\hline
Autocorrelation Function \tabularnewline
Time lag k & ACF(k) & T-STAT & P-value \tabularnewline
1 & 0.948796 & 7.3493 & 0 \tabularnewline
2 & 0.893064 & 6.9176 & 0 \tabularnewline
3 & 0.833666 & 6.4576 & 0 \tabularnewline
4 & 0.783579 & 6.0696 & 0 \tabularnewline
5 & 0.732054 & 5.6705 & 0 \tabularnewline
6 & 0.679859 & 5.2662 & 1e-06 \tabularnewline
7 & 0.630109 & 4.8808 & 4e-06 \tabularnewline
8 & 0.58176 & 4.5063 & 1.6e-05 \tabularnewline
9 & 0.529674 & 4.1028 & 6.2e-05 \tabularnewline
10 & 0.474859 & 3.6782 & 0.000252 \tabularnewline
11 & 0.422761 & 3.2747 & 0.00088 \tabularnewline
12 & 0.368257 & 2.8525 & 0.002971 \tabularnewline
13 & 0.336379 & 2.6056 & 0.005775 \tabularnewline
14 & 0.301444 & 2.335 & 0.011454 \tabularnewline
15 & 0.263892 & 2.0441 & 0.02267 \tabularnewline
16 & 0.229163 & 1.7751 & 0.040477 \tabularnewline
17 & 0.194287 & 1.5049 & 0.068793 \tabularnewline
18 & 0.157375 & 1.219 & 0.113804 \tabularnewline
19 & 0.118338 & 0.9166 & 0.181499 \tabularnewline
20 & 0.071561 & 0.5543 & 0.290714 \tabularnewline
21 & 0.031622 & 0.2449 & 0.403667 \tabularnewline
22 & -0.006991 & -0.0542 & 0.478498 \tabularnewline
23 & -0.045175 & -0.3499 & 0.36381 \tabularnewline
24 & -0.085159 & -0.6596 & 0.256005 \tabularnewline
25 & -0.130069 & -1.0075 & 0.158867 \tabularnewline
26 & -0.177717 & -1.3766 & 0.086878 \tabularnewline
27 & -0.222916 & -1.7267 & 0.044684 \tabularnewline
28 & -0.264949 & -2.0523 & 0.022256 \tabularnewline
29 & -0.30678 & -2.3763 & 0.010348 \tabularnewline
30 & -0.337355 & -2.6131 & 0.005661 \tabularnewline
31 & -0.360602 & -2.7932 & 0.003497 \tabularnewline
32 & -0.367363 & -2.8456 & 0.003029 \tabularnewline
33 & -0.368188 & -2.852 & 0.002976 \tabularnewline
34 & -0.363662 & -2.8169 & 0.003277 \tabularnewline
35 & -0.361404 & -2.7994 & 0.003438 \tabularnewline
36 & -0.359959 & -2.7882 & 0.003545 \tabularnewline
37 & -0.362649 & -2.8091 & 0.003348 \tabularnewline
38 & -0.365771 & -2.8332 & 0.003133 \tabularnewline
39 & -0.369669 & -2.8634 & 0.002883 \tabularnewline
40 & -0.369101 & -2.859 & 0.002918 \tabularnewline
41 & -0.362685 & -2.8093 & 0.003346 \tabularnewline
42 & -0.356392 & -2.7606 & 0.003821 \tabularnewline
43 & -0.355126 & -2.7508 & 0.003924 \tabularnewline
44 & -0.354712 & -2.7476 & 0.003958 \tabularnewline
45 & -0.355595 & -2.7544 & 0.003886 \tabularnewline
46 & -0.350617 & -2.7159 & 0.004311 \tabularnewline
47 & -0.342193 & -2.6506 & 0.00513 \tabularnewline
48 & -0.333935 & -2.5867 & 0.006067 \tabularnewline
\hline
\end{tabular}
%Source: https://freestatistics.org/blog/index.php?pk=283040&T=1

[TABLE]
[ROW][C]Autocorrelation Function[/C][/ROW]
[ROW][C]Time lag k[/C][C]ACF(k)[/C][C]T-STAT[/C][C]P-value[/C][/ROW]
[ROW][C]1[/C][C]0.948796[/C][C]7.3493[/C][C]0[/C][/ROW]
[ROW][C]2[/C][C]0.893064[/C][C]6.9176[/C][C]0[/C][/ROW]
[ROW][C]3[/C][C]0.833666[/C][C]6.4576[/C][C]0[/C][/ROW]
[ROW][C]4[/C][C]0.783579[/C][C]6.0696[/C][C]0[/C][/ROW]
[ROW][C]5[/C][C]0.732054[/C][C]5.6705[/C][C]0[/C][/ROW]
[ROW][C]6[/C][C]0.679859[/C][C]5.2662[/C][C]1e-06[/C][/ROW]
[ROW][C]7[/C][C]0.630109[/C][C]4.8808[/C][C]4e-06[/C][/ROW]
[ROW][C]8[/C][C]0.58176[/C][C]4.5063[/C][C]1.6e-05[/C][/ROW]
[ROW][C]9[/C][C]0.529674[/C][C]4.1028[/C][C]6.2e-05[/C][/ROW]
[ROW][C]10[/C][C]0.474859[/C][C]3.6782[/C][C]0.000252[/C][/ROW]
[ROW][C]11[/C][C]0.422761[/C][C]3.2747[/C][C]0.00088[/C][/ROW]
[ROW][C]12[/C][C]0.368257[/C][C]2.8525[/C][C]0.002971[/C][/ROW]
[ROW][C]13[/C][C]0.336379[/C][C]2.6056[/C][C]0.005775[/C][/ROW]
[ROW][C]14[/C][C]0.301444[/C][C]2.335[/C][C]0.011454[/C][/ROW]
[ROW][C]15[/C][C]0.263892[/C][C]2.0441[/C][C]0.02267[/C][/ROW]
[ROW][C]16[/C][C]0.229163[/C][C]1.7751[/C][C]0.040477[/C][/ROW]
[ROW][C]17[/C][C]0.194287[/C][C]1.5049[/C][C]0.068793[/C][/ROW]
[ROW][C]18[/C][C]0.157375[/C][C]1.219[/C][C]0.113804[/C][/ROW]
[ROW][C]19[/C][C]0.118338[/C][C]0.9166[/C][C]0.181499[/C][/ROW]
[ROW][C]20[/C][C]0.071561[/C][C]0.5543[/C][C]0.290714[/C][/ROW]
[ROW][C]21[/C][C]0.031622[/C][C]0.2449[/C][C]0.403667[/C][/ROW]
[ROW][C]22[/C][C]-0.006991[/C][C]-0.0542[/C][C]0.478498[/C][/ROW]
[ROW][C]23[/C][C]-0.045175[/C][C]-0.3499[/C][C]0.36381[/C][/ROW]
[ROW][C]24[/C][C]-0.085159[/C][C]-0.6596[/C][C]0.256005[/C][/ROW]
[ROW][C]25[/C][C]-0.130069[/C][C]-1.0075[/C][C]0.158867[/C][/ROW]
[ROW][C]26[/C][C]-0.177717[/C][C]-1.3766[/C][C]0.086878[/C][/ROW]
[ROW][C]27[/C][C]-0.222916[/C][C]-1.7267[/C][C]0.044684[/C][/ROW]
[ROW][C]28[/C][C]-0.264949[/C][C]-2.0523[/C][C]0.022256[/C][/ROW]
[ROW][C]29[/C][C]-0.30678[/C][C]-2.3763[/C][C]0.010348[/C][/ROW]
[ROW][C]30[/C][C]-0.337355[/C][C]-2.6131[/C][C]0.005661[/C][/ROW]
[ROW][C]31[/C][C]-0.360602[/C][C]-2.7932[/C][C]0.003497[/C][/ROW]
[ROW][C]32[/C][C]-0.367363[/C][C]-2.8456[/C][C]0.003029[/C][/ROW]
[ROW][C]33[/C][C]-0.368188[/C][C]-2.852[/C][C]0.002976[/C][/ROW]
[ROW][C]34[/C][C]-0.363662[/C][C]-2.8169[/C][C]0.003277[/C][/ROW]
[ROW][C]35[/C][C]-0.361404[/C][C]-2.7994[/C][C]0.003438[/C][/ROW]
[ROW][C]36[/C][C]-0.359959[/C][C]-2.7882[/C][C]0.003545[/C][/ROW]
[ROW][C]37[/C][C]-0.362649[/C][C]-2.8091[/C][C]0.003348[/C][/ROW]
[ROW][C]38[/C][C]-0.365771[/C][C]-2.8332[/C][C]0.003133[/C][/ROW]
[ROW][C]39[/C][C]-0.369669[/C][C]-2.8634[/C][C]0.002883[/C][/ROW]
[ROW][C]40[/C][C]-0.369101[/C][C]-2.859[/C][C]0.002918[/C][/ROW]
[ROW][C]41[/C][C]-0.362685[/C][C]-2.8093[/C][C]0.003346[/C][/ROW]
[ROW][C]42[/C][C]-0.356392[/C][C]-2.7606[/C][C]0.003821[/C][/ROW]
[ROW][C]43[/C][C]-0.355126[/C][C]-2.7508[/C][C]0.003924[/C][/ROW]
[ROW][C]44[/C][C]-0.354712[/C][C]-2.7476[/C][C]0.003958[/C][/ROW]
[ROW][C]45[/C][C]-0.355595[/C][C]-2.7544[/C][C]0.003886[/C][/ROW]
[ROW][C]46[/C][C]-0.350617[/C][C]-2.7159[/C][C]0.004311[/C][/ROW]
[ROW][C]47[/C][C]-0.342193[/C][C]-2.6506[/C][C]0.00513[/C][/ROW]
[ROW][C]48[/C][C]-0.333935[/C][C]-2.5867[/C][C]0.006067[/C][/ROW]
[/TABLE]
Source: https://freestatistics.org/blog/index.php?pk=283040&T=1

Globally Unique Identifier (entire table): ba.freestatistics.org/blog/index.php?pk=283040&T=1

As an alternative you can also use a QR Code:  

The GUIDs for individual cells are displayed in the table below:

Autocorrelation Function
Time lag kACF(k)T-STATP-value
10.9487967.34930
20.8930646.91760
30.8336666.45760
40.7835796.06960
50.7320545.67050
60.6798595.26621e-06
70.6301094.88084e-06
80.581764.50631.6e-05
90.5296744.10286.2e-05
100.4748593.67820.000252
110.4227613.27470.00088
120.3682572.85250.002971
130.3363792.60560.005775
140.3014442.3350.011454
150.2638922.04410.02267
160.2291631.77510.040477
170.1942871.50490.068793
180.1573751.2190.113804
190.1183380.91660.181499
200.0715610.55430.290714
210.0316220.24490.403667
22-0.006991-0.05420.478498
23-0.045175-0.34990.36381
24-0.085159-0.65960.256005
25-0.130069-1.00750.158867
26-0.177717-1.37660.086878
27-0.222916-1.72670.044684
28-0.264949-2.05230.022256
29-0.30678-2.37630.010348
30-0.337355-2.61310.005661
31-0.360602-2.79320.003497
32-0.367363-2.84560.003029
33-0.368188-2.8520.002976
34-0.363662-2.81690.003277
35-0.361404-2.79940.003438
36-0.359959-2.78820.003545
37-0.362649-2.80910.003348
38-0.365771-2.83320.003133
39-0.369669-2.86340.002883
40-0.369101-2.8590.002918
41-0.362685-2.80930.003346
42-0.356392-2.76060.003821
43-0.355126-2.75080.003924
44-0.354712-2.74760.003958
45-0.355595-2.75440.003886
46-0.350617-2.71590.004311
47-0.342193-2.65060.00513
48-0.333935-2.58670.006067


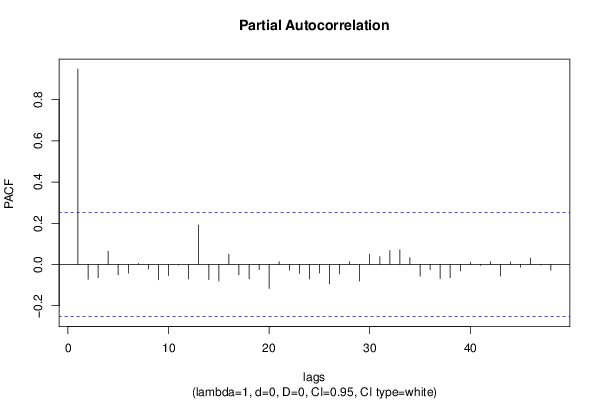
Partial Autocorrelation Function
Time lag kPACF(k)T-STATP-value
10.9487967.34930
2-0.07164-0.55490.290505
3-0.064473-0.49940.30966
40.0646590.50080.309156
5-0.049657-0.38460.350931
6-0.042076-0.32590.372809
70.0046930.03640.485561
8-0.021605-0.16730.433829
9-0.073858-0.57210.284695
10-0.053353-0.41330.340441
11-0.002296-0.01780.492935
12-0.070758-0.54810.292832
130.1915811.4840.071525
14-0.072733-0.56340.287635
15-0.080377-0.62260.267953
160.0500270.38750.349877
17-0.049614-0.38430.351053
18-0.069547-0.53870.29604
19-0.024892-0.19280.42388
20-0.115826-0.89720.186604
210.0132410.10260.459326
22-0.027259-0.21110.416745
23-0.043513-0.33710.368627
24-0.070538-0.54640.293414
25-0.041031-0.31780.375862
26-0.094122-0.72910.234399
27-0.044521-0.34490.365703
280.0129570.10040.460194
29-0.07997-0.61940.268984
300.0493710.38240.351747
310.038150.29550.384314
320.0674860.52270.301539
330.070920.54930.292404
340.032570.25230.400841
35-0.056585-0.43830.33137
36-0.02576-0.19950.42126
37-0.067788-0.52510.300731
38-0.06414-0.49680.310564
39-0.031947-0.24750.402699
400.0113970.08830.464972
41-0.004146-0.03210.487243
420.0135050.10460.458516
43-0.055957-0.43340.333124
440.0122590.0950.462332
45-0.013082-0.10130.459813
460.0310410.24040.405404
47-0.00265-0.02050.491847
48-0.027935-0.21640.414712

\begin{tabular}{lllllllll}
\hline
Partial Autocorrelation Function \tabularnewline
Time lag k & PACF(k) & T-STAT & P-value \tabularnewline
1 & 0.948796 & 7.3493 & 0 \tabularnewline
2 & -0.07164 & -0.5549 & 0.290505 \tabularnewline
3 & -0.064473 & -0.4994 & 0.30966 \tabularnewline
4 & 0.064659 & 0.5008 & 0.309156 \tabularnewline
5 & -0.049657 & -0.3846 & 0.350931 \tabularnewline
6 & -0.042076 & -0.3259 & 0.372809 \tabularnewline
7 & 0.004693 & 0.0364 & 0.485561 \tabularnewline
8 & -0.021605 & -0.1673 & 0.433829 \tabularnewline
9 & -0.073858 & -0.5721 & 0.284695 \tabularnewline
10 & -0.053353 & -0.4133 & 0.340441 \tabularnewline
11 & -0.002296 & -0.0178 & 0.492935 \tabularnewline
12 & -0.070758 & -0.5481 & 0.292832 \tabularnewline
13 & 0.191581 & 1.484 & 0.071525 \tabularnewline
14 & -0.072733 & -0.5634 & 0.287635 \tabularnewline
15 & -0.080377 & -0.6226 & 0.267953 \tabularnewline
16 & 0.050027 & 0.3875 & 0.349877 \tabularnewline
17 & -0.049614 & -0.3843 & 0.351053 \tabularnewline
18 & -0.069547 & -0.5387 & 0.29604 \tabularnewline
19 & -0.024892 & -0.1928 & 0.42388 \tabularnewline
20 & -0.115826 & -0.8972 & 0.186604 \tabularnewline
21 & 0.013241 & 0.1026 & 0.459326 \tabularnewline
22 & -0.027259 & -0.2111 & 0.416745 \tabularnewline
23 & -0.043513 & -0.3371 & 0.368627 \tabularnewline
24 & -0.070538 & -0.5464 & 0.293414 \tabularnewline
25 & -0.041031 & -0.3178 & 0.375862 \tabularnewline
26 & -0.094122 & -0.7291 & 0.234399 \tabularnewline
27 & -0.044521 & -0.3449 & 0.365703 \tabularnewline
28 & 0.012957 & 0.1004 & 0.460194 \tabularnewline
29 & -0.07997 & -0.6194 & 0.268984 \tabularnewline
30 & 0.049371 & 0.3824 & 0.351747 \tabularnewline
31 & 0.03815 & 0.2955 & 0.384314 \tabularnewline
32 & 0.067486 & 0.5227 & 0.301539 \tabularnewline
33 & 0.07092 & 0.5493 & 0.292404 \tabularnewline
34 & 0.03257 & 0.2523 & 0.400841 \tabularnewline
35 & -0.056585 & -0.4383 & 0.33137 \tabularnewline
36 & -0.02576 & -0.1995 & 0.42126 \tabularnewline
37 & -0.067788 & -0.5251 & 0.300731 \tabularnewline
38 & -0.06414 & -0.4968 & 0.310564 \tabularnewline
39 & -0.031947 & -0.2475 & 0.402699 \tabularnewline
40 & 0.011397 & 0.0883 & 0.464972 \tabularnewline
41 & -0.004146 & -0.0321 & 0.487243 \tabularnewline
42 & 0.013505 & 0.1046 & 0.458516 \tabularnewline
43 & -0.055957 & -0.4334 & 0.333124 \tabularnewline
44 & 0.012259 & 0.095 & 0.462332 \tabularnewline
45 & -0.013082 & -0.1013 & 0.459813 \tabularnewline
46 & 0.031041 & 0.2404 & 0.405404 \tabularnewline
47 & -0.00265 & -0.0205 & 0.491847 \tabularnewline
48 & -0.027935 & -0.2164 & 0.414712 \tabularnewline
\hline
\end{tabular}
%Source: https://freestatistics.org/blog/index.php?pk=283040&T=2

[TABLE]
[ROW][C]Partial Autocorrelation Function[/C][/ROW]
[ROW][C]Time lag k[/C][C]PACF(k)[/C][C]T-STAT[/C][C]P-value[/C][/ROW]
[ROW][C]1[/C][C]0.948796[/C][C]7.3493[/C][C]0[/C][/ROW]
[ROW][C]2[/C][C]-0.07164[/C][C]-0.5549[/C][C]0.290505[/C][/ROW]
[ROW][C]3[/C][C]-0.064473[/C][C]-0.4994[/C][C]0.30966[/C][/ROW]
[ROW][C]4[/C][C]0.064659[/C][C]0.5008[/C][C]0.309156[/C][/ROW]
[ROW][C]5[/C][C]-0.049657[/C][C]-0.3846[/C][C]0.350931[/C][/ROW]
[ROW][C]6[/C][C]-0.042076[/C][C]-0.3259[/C][C]0.372809[/C][/ROW]
[ROW][C]7[/C][C]0.004693[/C][C]0.0364[/C][C]0.485561[/C][/ROW]
[ROW][C]8[/C][C]-0.021605[/C][C]-0.1673[/C][C]0.433829[/C][/ROW]
[ROW][C]9[/C][C]-0.073858[/C][C]-0.5721[/C][C]0.284695[/C][/ROW]
[ROW][C]10[/C][C]-0.053353[/C][C]-0.4133[/C][C]0.340441[/C][/ROW]
[ROW][C]11[/C][C]-0.002296[/C][C]-0.0178[/C][C]0.492935[/C][/ROW]
[ROW][C]12[/C][C]-0.070758[/C][C]-0.5481[/C][C]0.292832[/C][/ROW]
[ROW][C]13[/C][C]0.191581[/C][C]1.484[/C][C]0.071525[/C][/ROW]
[ROW][C]14[/C][C]-0.072733[/C][C]-0.5634[/C][C]0.287635[/C][/ROW]
[ROW][C]15[/C][C]-0.080377[/C][C]-0.6226[/C][C]0.267953[/C][/ROW]
[ROW][C]16[/C][C]0.050027[/C][C]0.3875[/C][C]0.349877[/C][/ROW]
[ROW][C]17[/C][C]-0.049614[/C][C]-0.3843[/C][C]0.351053[/C][/ROW]
[ROW][C]18[/C][C]-0.069547[/C][C]-0.5387[/C][C]0.29604[/C][/ROW]
[ROW][C]19[/C][C]-0.024892[/C][C]-0.1928[/C][C]0.42388[/C][/ROW]
[ROW][C]20[/C][C]-0.115826[/C][C]-0.8972[/C][C]0.186604[/C][/ROW]
[ROW][C]21[/C][C]0.013241[/C][C]0.1026[/C][C]0.459326[/C][/ROW]
[ROW][C]22[/C][C]-0.027259[/C][C]-0.2111[/C][C]0.416745[/C][/ROW]
[ROW][C]23[/C][C]-0.043513[/C][C]-0.3371[/C][C]0.368627[/C][/ROW]
[ROW][C]24[/C][C]-0.070538[/C][C]-0.5464[/C][C]0.293414[/C][/ROW]
[ROW][C]25[/C][C]-0.041031[/C][C]-0.3178[/C][C]0.375862[/C][/ROW]
[ROW][C]26[/C][C]-0.094122[/C][C]-0.7291[/C][C]0.234399[/C][/ROW]
[ROW][C]27[/C][C]-0.044521[/C][C]-0.3449[/C][C]0.365703[/C][/ROW]
[ROW][C]28[/C][C]0.012957[/C][C]0.1004[/C][C]0.460194[/C][/ROW]
[ROW][C]29[/C][C]-0.07997[/C][C]-0.6194[/C][C]0.268984[/C][/ROW]
[ROW][C]30[/C][C]0.049371[/C][C]0.3824[/C][C]0.351747[/C][/ROW]
[ROW][C]31[/C][C]0.03815[/C][C]0.2955[/C][C]0.384314[/C][/ROW]
[ROW][C]32[/C][C]0.067486[/C][C]0.5227[/C][C]0.301539[/C][/ROW]
[ROW][C]33[/C][C]0.07092[/C][C]0.5493[/C][C]0.292404[/C][/ROW]
[ROW][C]34[/C][C]0.03257[/C][C]0.2523[/C][C]0.400841[/C][/ROW]
[ROW][C]35[/C][C]-0.056585[/C][C]-0.4383[/C][C]0.33137[/C][/ROW]
[ROW][C]36[/C][C]-0.02576[/C][C]-0.1995[/C][C]0.42126[/C][/ROW]
[ROW][C]37[/C][C]-0.067788[/C][C]-0.5251[/C][C]0.300731[/C][/ROW]
[ROW][C]38[/C][C]-0.06414[/C][C]-0.4968[/C][C]0.310564[/C][/ROW]
[ROW][C]39[/C][C]-0.031947[/C][C]-0.2475[/C][C]0.402699[/C][/ROW]
[ROW][C]40[/C][C]0.011397[/C][C]0.0883[/C][C]0.464972[/C][/ROW]
[ROW][C]41[/C][C]-0.004146[/C][C]-0.0321[/C][C]0.487243[/C][/ROW]
[ROW][C]42[/C][C]0.013505[/C][C]0.1046[/C][C]0.458516[/C][/ROW]
[ROW][C]43[/C][C]-0.055957[/C][C]-0.4334[/C][C]0.333124[/C][/ROW]
[ROW][C]44[/C][C]0.012259[/C][C]0.095[/C][C]0.462332[/C][/ROW]
[ROW][C]45[/C][C]-0.013082[/C][C]-0.1013[/C][C]0.459813[/C][/ROW]
[ROW][C]46[/C][C]0.031041[/C][C]0.2404[/C][C]0.405404[/C][/ROW]
[ROW][C]47[/C][C]-0.00265[/C][C]-0.0205[/C][C]0.491847[/C][/ROW]
[ROW][C]48[/C][C]-0.027935[/C][C]-0.2164[/C][C]0.414712[/C][/ROW]
[/TABLE]
Source: https://freestatistics.org/blog/index.php?pk=283040&T=2

Globally Unique Identifier (entire table): ba.freestatistics.org/blog/index.php?pk=283040&T=2

As an alternative you can also use a QR Code:  

The GUIDs for individual cells are displayed in the table below:

Partial Autocorrelation Function
Time lag kPACF(k)T-STATP-value
10.9487967.34930
2-0.07164-0.55490.290505
3-0.064473-0.49940.30966
40.0646590.50080.309156
5-0.049657-0.38460.350931
6-0.042076-0.32590.372809
70.0046930.03640.485561
8-0.021605-0.16730.433829
9-0.073858-0.57210.284695
10-0.053353-0.41330.340441
11-0.002296-0.01780.492935
12-0.070758-0.54810.292832
130.1915811.4840.071525
14-0.072733-0.56340.287635
15-0.080377-0.62260.267953
160.0500270.38750.349877
17-0.049614-0.38430.351053
18-0.069547-0.53870.29604
19-0.024892-0.19280.42388
20-0.115826-0.89720.186604
210.0132410.10260.459326
22-0.027259-0.21110.416745
23-0.043513-0.33710.368627
24-0.070538-0.54640.293414
25-0.041031-0.31780.375862
26-0.094122-0.72910.234399
27-0.044521-0.34490.365703
280.0129570.10040.460194
29-0.07997-0.61940.268984
300.0493710.38240.351747
310.038150.29550.384314
320.0674860.52270.301539
330.070920.54930.292404
340.032570.25230.400841
35-0.056585-0.43830.33137
36-0.02576-0.19950.42126
37-0.067788-0.52510.300731
38-0.06414-0.49680.310564
39-0.031947-0.24750.402699
400.0113970.08830.464972
41-0.004146-0.03210.487243
420.0135050.10460.458516
43-0.055957-0.43340.333124
440.0122590.0950.462332
45-0.013082-0.10130.459813
460.0310410.24040.405404
47-0.00265-0.02050.491847
48-0.027935-0.21640.414712


Parameters (Session):
par1 = 48 ; par2 = 1 ; par3 = 0 ; par4 = 0 ; par5 = 12 ; par6 = White Noise ; par7 = 0.95 ;
Parameters (R input):
par1 = 48 ; par2 = 1 ; par3 = 0 ; par4 = 0 ; par5 = 12 ; par6 = White Noise ; par7 = 0.95 ; par8 = ;
R code (references can be found in the software module):
par8 <- ''
par7 <- '0.95'
par6 <- 'White Noise'
par5 <- '12'
par4 <- '0'
par3 <- '0'
par2 <- '1'
par1 <- 'Default'
if (par1 == 'Default') {
par1 = 10*log10(length(x))
} else {
par1 <- as.numeric(par1)
}
par2 <- as.numeric(par2)
par3 <- as.numeric(par3)
par4 <- as.numeric(par4)
par5 <- as.numeric(par5)
if (par6 == 'White Noise') par6 <- 'white' else par6 <- 'ma'
par7 <- as.numeric(par7)
if (par8 != '') par8 <- as.numeric(par8)
ox <- x
if (par8 == '') {
if (par2 == 0) {
x <- log(x)
} else {
x <- (x ^ par2 - 1) / par2
}
} else {
x <- log(x,base=par8)
}
if (par3 > 0) x <- diff(x,lag=1,difference=par3)
if (par4 > 0) x <- diff(x,lag=par5,difference=par4)
bitmap(file='picts.png')
op <- par(mfrow=c(2,1))
plot(ox,type='l',main='Original Time Series',xlab='time',ylab='value')
if (par8=='') {
mytitle <- paste('Working Time Series (lambda=',par2,', d=',par3,', D=',par4,')',sep='')
mysub <- paste('(lambda=',par2,', d=',par3,', D=',par4,', CI=', par7, ', CI type=',par6,')',sep='')
} else {
mytitle <- paste('Working Time Series (base=',par8,', d=',par3,', D=',par4,')',sep='')
mysub <- paste('(base=',par8,', d=',par3,', D=',par4,', CI=', par7, ', CI type=',par6,')',sep='')
}
plot(x,type='l', main=mytitle,xlab='time',ylab='value')
par(op)
dev.off()
bitmap(file='pic1.png')
racf <- acf(x, par1, main='Autocorrelation', xlab='time lag', ylab='ACF', ci.type=par6, ci=par7, sub=mysub)
dev.off()
bitmap(file='pic2.png')
rpacf <- pacf(x,par1,main='Partial Autocorrelation',xlab='lags',ylab='PACF',sub=mysub)
dev.off()
(myacf <- c(racf$acf))
(mypacf <- c(rpacf$acf))
lengthx <- length(x)
sqrtn <- sqrt(lengthx)
load(file='createtable')
a<-table.start()
a<-table.row.start(a)
a<-table.element(a,'Autocorrelation Function',4,TRUE)
a<-table.row.end(a)
a<-table.row.start(a)
a<-table.element(a,'Time lag k',header=TRUE)
a<-table.element(a,hyperlink('basics.htm','ACF(k)','click here for more information about the Autocorrelation Function'),header=TRUE)
a<-table.element(a,'T-STAT',header=TRUE)
a<-table.element(a,'P-value',header=TRUE)
a<-table.row.end(a)
for (i in 2:(par1+1)) {
a<-table.row.start(a)
a<-table.element(a,i-1,header=TRUE)
a<-table.element(a,round(myacf[i],6))
mytstat <- myacf[i]*sqrtn
a<-table.element(a,round(mytstat,4))
a<-table.element(a,round(1-pt(abs(mytstat),lengthx),6))
a<-table.row.end(a)
}
a<-table.end(a)
table.save(a,file='mytable.tab')
a<-table.start()
a<-table.row.start(a)
a<-table.element(a,'Partial Autocorrelation Function',4,TRUE)
a<-table.row.end(a)
a<-table.row.start(a)
a<-table.element(a,'Time lag k',header=TRUE)
a<-table.element(a,hyperlink('basics.htm','PACF(k)','click here for more information about the Partial Autocorrelation Function'),header=TRUE)
a<-table.element(a,'T-STAT',header=TRUE)
a<-table.element(a,'P-value',header=TRUE)
a<-table.row.end(a)
for (i in 1:par1) {
a<-table.row.start(a)
a<-table.element(a,i,header=TRUE)
a<-table.element(a,round(mypacf[i],6))
mytstat <- mypacf[i]*sqrtn
a<-table.element(a,round(mytstat,4))
a<-table.element(a,round(1-pt(abs(mytstat),lengthx),6))
a<-table.row.end(a)
}
a<-table.end(a)
table.save(a,file='mytable1.tab')