Free Statistics

of Irreproducible Research!

Author's title

Author*Unverified author*
R Software Modulerwasp_autocorrelation.wasp
Title produced by software(Partial) Autocorrelation Function
Date of computationFri, 23 Oct 2015 21:41:21 +0100
Cite this page as followsStatistical Computations at FreeStatistics.org, Office for Research Development and Education, URL https://freestatistics.org/blog/index.php?v=date/2015/Oct/23/t14456329284w6n8cy8e8jwpxp.htm/, Retrieved Sat, 18 May 2024 19:56:06 +0000
Statistical Computations at FreeStatistics.org, Office for Research Development and Education, URL https://freestatistics.org/blog/index.php?pk=282989, Retrieved Sat, 18 May 2024 19:56:06 +0000
QR Codes:

Original text written by user:
IsPrivate?No (this computation is public)
User-defined keywords
Estimated Impact76
Family? (F = Feedback message, R = changed R code, M = changed R Module, P = changed Parameters, D = changed Data)
-       [(Partial) Autocorrelation Function] [Autocorrelation -...] [2015-10-23 20:41:21] [e4113772e8352caea1c7944bf41cc9e0] [Current]
Feedback Forum

Post a new message
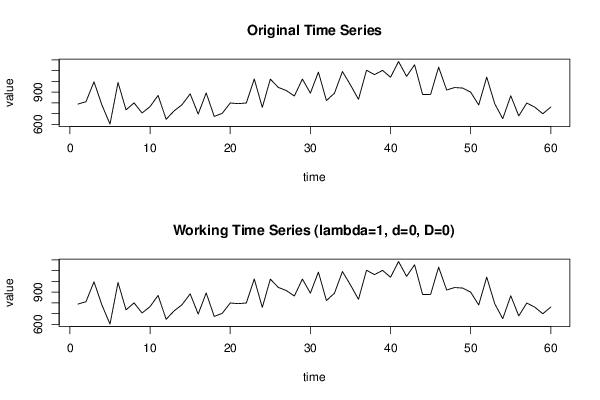
Dataseries X:
789
811
996
778
603
990
735
800
706
766
870
647
726
784
884
696
893
674
703
799
793
799
1022
758
1021
944
915
864
1022
891
1087
822
890
1092
967
833
1104
1063
1103
1039
1185
1047
1155
878
879
1133
920
943
938
900
781
1040
792
653
866
679
799
760
699
762


Summary of computational transaction
Raw Inputview raw input (R code)
Raw Outputview raw output of R engine
Computing time1 seconds
R Server'Gwilym Jenkins' @ jenkins.wessa.net

\begin{tabular}{lllllllll}
\hline
Summary of computational transaction \tabularnewline
Raw Input & view raw input (R code)  \tabularnewline
Raw Output & view raw output of R engine  \tabularnewline
Computing time & 1 seconds \tabularnewline
R Server & 'Gwilym Jenkins' @ jenkins.wessa.net \tabularnewline
\hline
\end{tabular}
%Source: https://freestatistics.org/blog/index.php?pk=282989&T=0

[TABLE]
[ROW][C]Summary of computational transaction[/C][/ROW]
[ROW][C]Raw Input[/C][C]view raw input (R code) [/C][/ROW]
[ROW][C]Raw Output[/C][C]view raw output of R engine [/C][/ROW]
[ROW][C]Computing time[/C][C]1 seconds[/C][/ROW]
[ROW][C]R Server[/C][C]'Gwilym Jenkins' @ jenkins.wessa.net[/C][/ROW]
[/TABLE]
Source: https://freestatistics.org/blog/index.php?pk=282989&T=0

Globally Unique Identifier (entire table): ba.freestatistics.org/blog/index.php?pk=282989&T=0

As an alternative you can also use a QR Code:  

The GUIDs for individual cells are displayed in the table below:

Summary of computational transaction
Raw Inputview raw input (R code)
Raw Outputview raw output of R engine
Computing time1 seconds
R Server'Gwilym Jenkins' @ jenkins.wessa.net


Autocorrelation Function
Time lag kACF(k)T-STATP-value
10.3496342.70830.0044
20.4481673.47150.000483
30.5445454.2184.2e-05
40.4240713.28480.000853
50.3274522.53640.00691
60.3811452.95230.002248
70.1591851.2330.111184
80.2645332.04910.022418
90.2495631.93310.028973
100.0116420.09020.464222
110.0876210.67870.249967
120.1307621.01290.157593
13-0.16587-1.28480.101896
140.0208180.16130.436218
15-0.092054-0.71310.239289
16-0.191776-1.48550.071325
17-0.153551-1.18940.119484
18-0.197048-1.52630.066092
19-0.277716-2.15120.017749
20-0.201561-1.56130.061858
21-0.258332-2.0010.024959
22-0.332408-2.57480.006257
23-0.159539-1.23580.110678
24-0.252036-1.95230.027789
25-0.31945-2.47440.008094
26-0.215395-1.66840.05022
27-0.24642-1.90880.03054
28-0.248468-1.92460.029511
29-0.267962-2.07560.021111
30-0.291151-2.25520.013889
31-0.178164-1.38010.086346
32-0.141996-1.09990.137886
33-0.223844-1.73390.044037
34-0.194376-1.50560.068705
35-0.006822-0.05280.479017
36-0.121624-0.94210.174961
37-0.04496-0.34830.364433
38-0.00347-0.02690.489322
39-0.033282-0.25780.398721
400.0739040.57250.284577
410.0083840.06490.474217
420.0353550.27390.392568
430.0548620.4250.336194
440.0747860.57930.282281
450.0254640.19720.422153
460.1269590.98340.164676
470.0638580.49460.31133
480.0247270.19150.424376

\begin{tabular}{lllllllll}
\hline
Autocorrelation Function \tabularnewline
Time lag k & ACF(k) & T-STAT & P-value \tabularnewline
1 & 0.349634 & 2.7083 & 0.0044 \tabularnewline
2 & 0.448167 & 3.4715 & 0.000483 \tabularnewline
3 & 0.544545 & 4.218 & 4.2e-05 \tabularnewline
4 & 0.424071 & 3.2848 & 0.000853 \tabularnewline
5 & 0.327452 & 2.5364 & 0.00691 \tabularnewline
6 & 0.381145 & 2.9523 & 0.002248 \tabularnewline
7 & 0.159185 & 1.233 & 0.111184 \tabularnewline
8 & 0.264533 & 2.0491 & 0.022418 \tabularnewline
9 & 0.249563 & 1.9331 & 0.028973 \tabularnewline
10 & 0.011642 & 0.0902 & 0.464222 \tabularnewline
11 & 0.087621 & 0.6787 & 0.249967 \tabularnewline
12 & 0.130762 & 1.0129 & 0.157593 \tabularnewline
13 & -0.16587 & -1.2848 & 0.101896 \tabularnewline
14 & 0.020818 & 0.1613 & 0.436218 \tabularnewline
15 & -0.092054 & -0.7131 & 0.239289 \tabularnewline
16 & -0.191776 & -1.4855 & 0.071325 \tabularnewline
17 & -0.153551 & -1.1894 & 0.119484 \tabularnewline
18 & -0.197048 & -1.5263 & 0.066092 \tabularnewline
19 & -0.277716 & -2.1512 & 0.017749 \tabularnewline
20 & -0.201561 & -1.5613 & 0.061858 \tabularnewline
21 & -0.258332 & -2.001 & 0.024959 \tabularnewline
22 & -0.332408 & -2.5748 & 0.006257 \tabularnewline
23 & -0.159539 & -1.2358 & 0.110678 \tabularnewline
24 & -0.252036 & -1.9523 & 0.027789 \tabularnewline
25 & -0.31945 & -2.4744 & 0.008094 \tabularnewline
26 & -0.215395 & -1.6684 & 0.05022 \tabularnewline
27 & -0.24642 & -1.9088 & 0.03054 \tabularnewline
28 & -0.248468 & -1.9246 & 0.029511 \tabularnewline
29 & -0.267962 & -2.0756 & 0.021111 \tabularnewline
30 & -0.291151 & -2.2552 & 0.013889 \tabularnewline
31 & -0.178164 & -1.3801 & 0.086346 \tabularnewline
32 & -0.141996 & -1.0999 & 0.137886 \tabularnewline
33 & -0.223844 & -1.7339 & 0.044037 \tabularnewline
34 & -0.194376 & -1.5056 & 0.068705 \tabularnewline
35 & -0.006822 & -0.0528 & 0.479017 \tabularnewline
36 & -0.121624 & -0.9421 & 0.174961 \tabularnewline
37 & -0.04496 & -0.3483 & 0.364433 \tabularnewline
38 & -0.00347 & -0.0269 & 0.489322 \tabularnewline
39 & -0.033282 & -0.2578 & 0.398721 \tabularnewline
40 & 0.073904 & 0.5725 & 0.284577 \tabularnewline
41 & 0.008384 & 0.0649 & 0.474217 \tabularnewline
42 & 0.035355 & 0.2739 & 0.392568 \tabularnewline
43 & 0.054862 & 0.425 & 0.336194 \tabularnewline
44 & 0.074786 & 0.5793 & 0.282281 \tabularnewline
45 & 0.025464 & 0.1972 & 0.422153 \tabularnewline
46 & 0.126959 & 0.9834 & 0.164676 \tabularnewline
47 & 0.063858 & 0.4946 & 0.31133 \tabularnewline
48 & 0.024727 & 0.1915 & 0.424376 \tabularnewline
\hline
\end{tabular}
%Source: https://freestatistics.org/blog/index.php?pk=282989&T=1

[TABLE]
[ROW][C]Autocorrelation Function[/C][/ROW]
[ROW][C]Time lag k[/C][C]ACF(k)[/C][C]T-STAT[/C][C]P-value[/C][/ROW]
[ROW][C]1[/C][C]0.349634[/C][C]2.7083[/C][C]0.0044[/C][/ROW]
[ROW][C]2[/C][C]0.448167[/C][C]3.4715[/C][C]0.000483[/C][/ROW]
[ROW][C]3[/C][C]0.544545[/C][C]4.218[/C][C]4.2e-05[/C][/ROW]
[ROW][C]4[/C][C]0.424071[/C][C]3.2848[/C][C]0.000853[/C][/ROW]
[ROW][C]5[/C][C]0.327452[/C][C]2.5364[/C][C]0.00691[/C][/ROW]
[ROW][C]6[/C][C]0.381145[/C][C]2.9523[/C][C]0.002248[/C][/ROW]
[ROW][C]7[/C][C]0.159185[/C][C]1.233[/C][C]0.111184[/C][/ROW]
[ROW][C]8[/C][C]0.264533[/C][C]2.0491[/C][C]0.022418[/C][/ROW]
[ROW][C]9[/C][C]0.249563[/C][C]1.9331[/C][C]0.028973[/C][/ROW]
[ROW][C]10[/C][C]0.011642[/C][C]0.0902[/C][C]0.464222[/C][/ROW]
[ROW][C]11[/C][C]0.087621[/C][C]0.6787[/C][C]0.249967[/C][/ROW]
[ROW][C]12[/C][C]0.130762[/C][C]1.0129[/C][C]0.157593[/C][/ROW]
[ROW][C]13[/C][C]-0.16587[/C][C]-1.2848[/C][C]0.101896[/C][/ROW]
[ROW][C]14[/C][C]0.020818[/C][C]0.1613[/C][C]0.436218[/C][/ROW]
[ROW][C]15[/C][C]-0.092054[/C][C]-0.7131[/C][C]0.239289[/C][/ROW]
[ROW][C]16[/C][C]-0.191776[/C][C]-1.4855[/C][C]0.071325[/C][/ROW]
[ROW][C]17[/C][C]-0.153551[/C][C]-1.1894[/C][C]0.119484[/C][/ROW]
[ROW][C]18[/C][C]-0.197048[/C][C]-1.5263[/C][C]0.066092[/C][/ROW]
[ROW][C]19[/C][C]-0.277716[/C][C]-2.1512[/C][C]0.017749[/C][/ROW]
[ROW][C]20[/C][C]-0.201561[/C][C]-1.5613[/C][C]0.061858[/C][/ROW]
[ROW][C]21[/C][C]-0.258332[/C][C]-2.001[/C][C]0.024959[/C][/ROW]
[ROW][C]22[/C][C]-0.332408[/C][C]-2.5748[/C][C]0.006257[/C][/ROW]
[ROW][C]23[/C][C]-0.159539[/C][C]-1.2358[/C][C]0.110678[/C][/ROW]
[ROW][C]24[/C][C]-0.252036[/C][C]-1.9523[/C][C]0.027789[/C][/ROW]
[ROW][C]25[/C][C]-0.31945[/C][C]-2.4744[/C][C]0.008094[/C][/ROW]
[ROW][C]26[/C][C]-0.215395[/C][C]-1.6684[/C][C]0.05022[/C][/ROW]
[ROW][C]27[/C][C]-0.24642[/C][C]-1.9088[/C][C]0.03054[/C][/ROW]
[ROW][C]28[/C][C]-0.248468[/C][C]-1.9246[/C][C]0.029511[/C][/ROW]
[ROW][C]29[/C][C]-0.267962[/C][C]-2.0756[/C][C]0.021111[/C][/ROW]
[ROW][C]30[/C][C]-0.291151[/C][C]-2.2552[/C][C]0.013889[/C][/ROW]
[ROW][C]31[/C][C]-0.178164[/C][C]-1.3801[/C][C]0.086346[/C][/ROW]
[ROW][C]32[/C][C]-0.141996[/C][C]-1.0999[/C][C]0.137886[/C][/ROW]
[ROW][C]33[/C][C]-0.223844[/C][C]-1.7339[/C][C]0.044037[/C][/ROW]
[ROW][C]34[/C][C]-0.194376[/C][C]-1.5056[/C][C]0.068705[/C][/ROW]
[ROW][C]35[/C][C]-0.006822[/C][C]-0.0528[/C][C]0.479017[/C][/ROW]
[ROW][C]36[/C][C]-0.121624[/C][C]-0.9421[/C][C]0.174961[/C][/ROW]
[ROW][C]37[/C][C]-0.04496[/C][C]-0.3483[/C][C]0.364433[/C][/ROW]
[ROW][C]38[/C][C]-0.00347[/C][C]-0.0269[/C][C]0.489322[/C][/ROW]
[ROW][C]39[/C][C]-0.033282[/C][C]-0.2578[/C][C]0.398721[/C][/ROW]
[ROW][C]40[/C][C]0.073904[/C][C]0.5725[/C][C]0.284577[/C][/ROW]
[ROW][C]41[/C][C]0.008384[/C][C]0.0649[/C][C]0.474217[/C][/ROW]
[ROW][C]42[/C][C]0.035355[/C][C]0.2739[/C][C]0.392568[/C][/ROW]
[ROW][C]43[/C][C]0.054862[/C][C]0.425[/C][C]0.336194[/C][/ROW]
[ROW][C]44[/C][C]0.074786[/C][C]0.5793[/C][C]0.282281[/C][/ROW]
[ROW][C]45[/C][C]0.025464[/C][C]0.1972[/C][C]0.422153[/C][/ROW]
[ROW][C]46[/C][C]0.126959[/C][C]0.9834[/C][C]0.164676[/C][/ROW]
[ROW][C]47[/C][C]0.063858[/C][C]0.4946[/C][C]0.31133[/C][/ROW]
[ROW][C]48[/C][C]0.024727[/C][C]0.1915[/C][C]0.424376[/C][/ROW]
[/TABLE]
Source: https://freestatistics.org/blog/index.php?pk=282989&T=1

Globally Unique Identifier (entire table): ba.freestatistics.org/blog/index.php?pk=282989&T=1

As an alternative you can also use a QR Code:  

The GUIDs for individual cells are displayed in the table below:

Autocorrelation Function
Time lag kACF(k)T-STATP-value
10.3496342.70830.0044
20.4481673.47150.000483
30.5445454.2184.2e-05
40.4240713.28480.000853
50.3274522.53640.00691
60.3811452.95230.002248
70.1591851.2330.111184
80.2645332.04910.022418
90.2495631.93310.028973
100.0116420.09020.464222
110.0876210.67870.249967
120.1307621.01290.157593
13-0.16587-1.28480.101896
140.0208180.16130.436218
15-0.092054-0.71310.239289
16-0.191776-1.48550.071325
17-0.153551-1.18940.119484
18-0.197048-1.52630.066092
19-0.277716-2.15120.017749
20-0.201561-1.56130.061858
21-0.258332-2.0010.024959
22-0.332408-2.57480.006257
23-0.159539-1.23580.110678
24-0.252036-1.95230.027789
25-0.31945-2.47440.008094
26-0.215395-1.66840.05022
27-0.24642-1.90880.03054
28-0.248468-1.92460.029511
29-0.267962-2.07560.021111
30-0.291151-2.25520.013889
31-0.178164-1.38010.086346
32-0.141996-1.09990.137886
33-0.223844-1.73390.044037
34-0.194376-1.50560.068705
35-0.006822-0.05280.479017
36-0.121624-0.94210.174961
37-0.04496-0.34830.364433
38-0.00347-0.02690.489322
39-0.033282-0.25780.398721
400.0739040.57250.284577
410.0083840.06490.474217
420.0353550.27390.392568
430.0548620.4250.336194
440.0747860.57930.282281
450.0254640.19720.422153
460.1269590.98340.164676
470.0638580.49460.31133
480.0247270.19150.424376


Partial Autocorrelation Function
Time lag kPACF(k)T-STATP-value
10.3496342.70830.0044
20.3713142.87620.002782
30.4178593.23670.000985
40.188151.45740.075109
5-0.062699-0.48570.314486
6-0.02636-0.20420.41945
7-0.291184-2.25550.013881
8-0.022406-0.17360.431399
90.1171370.90730.183928
10-0.143185-1.10910.135906
11-0.06725-0.52090.30217
120.045690.35390.362322
13-0.255879-1.9820.026031
140.0417170.32310.373856
15-0.037604-0.29130.38592
16-0.04291-0.33240.37038
17-0.06978-0.54050.295421
18-0.096164-0.74490.229625
190.0044120.03420.486425
20-0.045789-0.35470.362036
210.0441340.34190.366825
22-0.025655-0.19870.421575
230.0708320.54870.292638
240.045040.34890.364201
25-0.094005-0.72820.234674
26-0.140119-1.08540.141053
27-0.040854-0.31650.376379
28-0.009944-0.0770.469431
29-0.126075-0.97660.166351
30-0.113818-0.88160.190747
310.1003960.77770.219911
320.1189380.92130.180295
330.0255660.1980.421843
34-0.079501-0.61580.270175
350.0669950.51890.302855
36-0.006332-0.0490.480523
370.0300440.23270.408385
380.0416060.32230.374182
39-0.096748-0.74940.22827
400.0260590.20190.420357
41-0.112185-0.8690.194161
42-0.003133-0.02430.490361
43-0.085578-0.66290.254971
44-0.034257-0.26540.395824
450.0012220.00950.496238
460.0196180.1520.439864
47-0.074311-0.57560.283515
48-0.082963-0.64260.261457

\begin{tabular}{lllllllll}
\hline
Partial Autocorrelation Function \tabularnewline
Time lag k & PACF(k) & T-STAT & P-value \tabularnewline
1 & 0.349634 & 2.7083 & 0.0044 \tabularnewline
2 & 0.371314 & 2.8762 & 0.002782 \tabularnewline
3 & 0.417859 & 3.2367 & 0.000985 \tabularnewline
4 & 0.18815 & 1.4574 & 0.075109 \tabularnewline
5 & -0.062699 & -0.4857 & 0.314486 \tabularnewline
6 & -0.02636 & -0.2042 & 0.41945 \tabularnewline
7 & -0.291184 & -2.2555 & 0.013881 \tabularnewline
8 & -0.022406 & -0.1736 & 0.431399 \tabularnewline
9 & 0.117137 & 0.9073 & 0.183928 \tabularnewline
10 & -0.143185 & -1.1091 & 0.135906 \tabularnewline
11 & -0.06725 & -0.5209 & 0.30217 \tabularnewline
12 & 0.04569 & 0.3539 & 0.362322 \tabularnewline
13 & -0.255879 & -1.982 & 0.026031 \tabularnewline
14 & 0.041717 & 0.3231 & 0.373856 \tabularnewline
15 & -0.037604 & -0.2913 & 0.38592 \tabularnewline
16 & -0.04291 & -0.3324 & 0.37038 \tabularnewline
17 & -0.06978 & -0.5405 & 0.295421 \tabularnewline
18 & -0.096164 & -0.7449 & 0.229625 \tabularnewline
19 & 0.004412 & 0.0342 & 0.486425 \tabularnewline
20 & -0.045789 & -0.3547 & 0.362036 \tabularnewline
21 & 0.044134 & 0.3419 & 0.366825 \tabularnewline
22 & -0.025655 & -0.1987 & 0.421575 \tabularnewline
23 & 0.070832 & 0.5487 & 0.292638 \tabularnewline
24 & 0.04504 & 0.3489 & 0.364201 \tabularnewline
25 & -0.094005 & -0.7282 & 0.234674 \tabularnewline
26 & -0.140119 & -1.0854 & 0.141053 \tabularnewline
27 & -0.040854 & -0.3165 & 0.376379 \tabularnewline
28 & -0.009944 & -0.077 & 0.469431 \tabularnewline
29 & -0.126075 & -0.9766 & 0.166351 \tabularnewline
30 & -0.113818 & -0.8816 & 0.190747 \tabularnewline
31 & 0.100396 & 0.7777 & 0.219911 \tabularnewline
32 & 0.118938 & 0.9213 & 0.180295 \tabularnewline
33 & 0.025566 & 0.198 & 0.421843 \tabularnewline
34 & -0.079501 & -0.6158 & 0.270175 \tabularnewline
35 & 0.066995 & 0.5189 & 0.302855 \tabularnewline
36 & -0.006332 & -0.049 & 0.480523 \tabularnewline
37 & 0.030044 & 0.2327 & 0.408385 \tabularnewline
38 & 0.041606 & 0.3223 & 0.374182 \tabularnewline
39 & -0.096748 & -0.7494 & 0.22827 \tabularnewline
40 & 0.026059 & 0.2019 & 0.420357 \tabularnewline
41 & -0.112185 & -0.869 & 0.194161 \tabularnewline
42 & -0.003133 & -0.0243 & 0.490361 \tabularnewline
43 & -0.085578 & -0.6629 & 0.254971 \tabularnewline
44 & -0.034257 & -0.2654 & 0.395824 \tabularnewline
45 & 0.001222 & 0.0095 & 0.496238 \tabularnewline
46 & 0.019618 & 0.152 & 0.439864 \tabularnewline
47 & -0.074311 & -0.5756 & 0.283515 \tabularnewline
48 & -0.082963 & -0.6426 & 0.261457 \tabularnewline
\hline
\end{tabular}
%Source: https://freestatistics.org/blog/index.php?pk=282989&T=2

[TABLE]
[ROW][C]Partial Autocorrelation Function[/C][/ROW]
[ROW][C]Time lag k[/C][C]PACF(k)[/C][C]T-STAT[/C][C]P-value[/C][/ROW]
[ROW][C]1[/C][C]0.349634[/C][C]2.7083[/C][C]0.0044[/C][/ROW]
[ROW][C]2[/C][C]0.371314[/C][C]2.8762[/C][C]0.002782[/C][/ROW]
[ROW][C]3[/C][C]0.417859[/C][C]3.2367[/C][C]0.000985[/C][/ROW]
[ROW][C]4[/C][C]0.18815[/C][C]1.4574[/C][C]0.075109[/C][/ROW]
[ROW][C]5[/C][C]-0.062699[/C][C]-0.4857[/C][C]0.314486[/C][/ROW]
[ROW][C]6[/C][C]-0.02636[/C][C]-0.2042[/C][C]0.41945[/C][/ROW]
[ROW][C]7[/C][C]-0.291184[/C][C]-2.2555[/C][C]0.013881[/C][/ROW]
[ROW][C]8[/C][C]-0.022406[/C][C]-0.1736[/C][C]0.431399[/C][/ROW]
[ROW][C]9[/C][C]0.117137[/C][C]0.9073[/C][C]0.183928[/C][/ROW]
[ROW][C]10[/C][C]-0.143185[/C][C]-1.1091[/C][C]0.135906[/C][/ROW]
[ROW][C]11[/C][C]-0.06725[/C][C]-0.5209[/C][C]0.30217[/C][/ROW]
[ROW][C]12[/C][C]0.04569[/C][C]0.3539[/C][C]0.362322[/C][/ROW]
[ROW][C]13[/C][C]-0.255879[/C][C]-1.982[/C][C]0.026031[/C][/ROW]
[ROW][C]14[/C][C]0.041717[/C][C]0.3231[/C][C]0.373856[/C][/ROW]
[ROW][C]15[/C][C]-0.037604[/C][C]-0.2913[/C][C]0.38592[/C][/ROW]
[ROW][C]16[/C][C]-0.04291[/C][C]-0.3324[/C][C]0.37038[/C][/ROW]
[ROW][C]17[/C][C]-0.06978[/C][C]-0.5405[/C][C]0.295421[/C][/ROW]
[ROW][C]18[/C][C]-0.096164[/C][C]-0.7449[/C][C]0.229625[/C][/ROW]
[ROW][C]19[/C][C]0.004412[/C][C]0.0342[/C][C]0.486425[/C][/ROW]
[ROW][C]20[/C][C]-0.045789[/C][C]-0.3547[/C][C]0.362036[/C][/ROW]
[ROW][C]21[/C][C]0.044134[/C][C]0.3419[/C][C]0.366825[/C][/ROW]
[ROW][C]22[/C][C]-0.025655[/C][C]-0.1987[/C][C]0.421575[/C][/ROW]
[ROW][C]23[/C][C]0.070832[/C][C]0.5487[/C][C]0.292638[/C][/ROW]
[ROW][C]24[/C][C]0.04504[/C][C]0.3489[/C][C]0.364201[/C][/ROW]
[ROW][C]25[/C][C]-0.094005[/C][C]-0.7282[/C][C]0.234674[/C][/ROW]
[ROW][C]26[/C][C]-0.140119[/C][C]-1.0854[/C][C]0.141053[/C][/ROW]
[ROW][C]27[/C][C]-0.040854[/C][C]-0.3165[/C][C]0.376379[/C][/ROW]
[ROW][C]28[/C][C]-0.009944[/C][C]-0.077[/C][C]0.469431[/C][/ROW]
[ROW][C]29[/C][C]-0.126075[/C][C]-0.9766[/C][C]0.166351[/C][/ROW]
[ROW][C]30[/C][C]-0.113818[/C][C]-0.8816[/C][C]0.190747[/C][/ROW]
[ROW][C]31[/C][C]0.100396[/C][C]0.7777[/C][C]0.219911[/C][/ROW]
[ROW][C]32[/C][C]0.118938[/C][C]0.9213[/C][C]0.180295[/C][/ROW]
[ROW][C]33[/C][C]0.025566[/C][C]0.198[/C][C]0.421843[/C][/ROW]
[ROW][C]34[/C][C]-0.079501[/C][C]-0.6158[/C][C]0.270175[/C][/ROW]
[ROW][C]35[/C][C]0.066995[/C][C]0.5189[/C][C]0.302855[/C][/ROW]
[ROW][C]36[/C][C]-0.006332[/C][C]-0.049[/C][C]0.480523[/C][/ROW]
[ROW][C]37[/C][C]0.030044[/C][C]0.2327[/C][C]0.408385[/C][/ROW]
[ROW][C]38[/C][C]0.041606[/C][C]0.3223[/C][C]0.374182[/C][/ROW]
[ROW][C]39[/C][C]-0.096748[/C][C]-0.7494[/C][C]0.22827[/C][/ROW]
[ROW][C]40[/C][C]0.026059[/C][C]0.2019[/C][C]0.420357[/C][/ROW]
[ROW][C]41[/C][C]-0.112185[/C][C]-0.869[/C][C]0.194161[/C][/ROW]
[ROW][C]42[/C][C]-0.003133[/C][C]-0.0243[/C][C]0.490361[/C][/ROW]
[ROW][C]43[/C][C]-0.085578[/C][C]-0.6629[/C][C]0.254971[/C][/ROW]
[ROW][C]44[/C][C]-0.034257[/C][C]-0.2654[/C][C]0.395824[/C][/ROW]
[ROW][C]45[/C][C]0.001222[/C][C]0.0095[/C][C]0.496238[/C][/ROW]
[ROW][C]46[/C][C]0.019618[/C][C]0.152[/C][C]0.439864[/C][/ROW]
[ROW][C]47[/C][C]-0.074311[/C][C]-0.5756[/C][C]0.283515[/C][/ROW]
[ROW][C]48[/C][C]-0.082963[/C][C]-0.6426[/C][C]0.261457[/C][/ROW]
[/TABLE]
Source: https://freestatistics.org/blog/index.php?pk=282989&T=2

Globally Unique Identifier (entire table): ba.freestatistics.org/blog/index.php?pk=282989&T=2

As an alternative you can also use a QR Code:  

The GUIDs for individual cells are displayed in the table below:

Partial Autocorrelation Function
Time lag kPACF(k)T-STATP-value
10.3496342.70830.0044
20.3713142.87620.002782
30.4178593.23670.000985
40.188151.45740.075109
5-0.062699-0.48570.314486
6-0.02636-0.20420.41945
7-0.291184-2.25550.013881
8-0.022406-0.17360.431399
90.1171370.90730.183928
10-0.143185-1.10910.135906
11-0.06725-0.52090.30217
120.045690.35390.362322
13-0.255879-1.9820.026031
140.0417170.32310.373856
15-0.037604-0.29130.38592
16-0.04291-0.33240.37038
17-0.06978-0.54050.295421
18-0.096164-0.74490.229625
190.0044120.03420.486425
20-0.045789-0.35470.362036
210.0441340.34190.366825
22-0.025655-0.19870.421575
230.0708320.54870.292638
240.045040.34890.364201
25-0.094005-0.72820.234674
26-0.140119-1.08540.141053
27-0.040854-0.31650.376379
28-0.009944-0.0770.469431
29-0.126075-0.97660.166351
30-0.113818-0.88160.190747
310.1003960.77770.219911
320.1189380.92130.180295
330.0255660.1980.421843
34-0.079501-0.61580.270175
350.0669950.51890.302855
36-0.006332-0.0490.480523
370.0300440.23270.408385
380.0416060.32230.374182
39-0.096748-0.74940.22827
400.0260590.20190.420357
41-0.112185-0.8690.194161
42-0.003133-0.02430.490361
43-0.085578-0.66290.254971
44-0.034257-0.26540.395824
450.0012220.00950.496238
460.0196180.1520.439864
47-0.074311-0.57560.283515
48-0.082963-0.64260.261457


Parameters (Session):
par1 = 48 ; par2 = 1 ; par3 = 0 ; par4 = 0 ; par5 = 12 ; par6 = White Noise ; par7 = 0.95 ;
Parameters (R input):
par1 = 48 ; par2 = 1 ; par3 = 0 ; par4 = 0 ; par5 = 12 ; par6 = White Noise ; par7 = 0.95 ; par8 = ;
R code (references can be found in the software module):
if (par1 == 'Default') {
par1 = 10*log10(length(x))
} else {
par1 <- as.numeric(par1)
}
par2 <- as.numeric(par2)
par3 <- as.numeric(par3)
par4 <- as.numeric(par4)
par5 <- as.numeric(par5)
if (par6 == 'White Noise') par6 <- 'white' else par6 <- 'ma'
par7 <- as.numeric(par7)
if (par8 != '') par8 <- as.numeric(par8)
ox <- x
if (par8 == '') {
if (par2 == 0) {
x <- log(x)
} else {
x <- (x ^ par2 - 1) / par2
}
} else {
x <- log(x,base=par8)
}
if (par3 > 0) x <- diff(x,lag=1,difference=par3)
if (par4 > 0) x <- diff(x,lag=par5,difference=par4)
bitmap(file='picts.png')
op <- par(mfrow=c(2,1))
plot(ox,type='l',main='Original Time Series',xlab='time',ylab='value')
if (par8=='') {
mytitle <- paste('Working Time Series (lambda=',par2,', d=',par3,', D=',par4,')',sep='')
mysub <- paste('(lambda=',par2,', d=',par3,', D=',par4,', CI=', par7, ', CI type=',par6,')',sep='')
} else {
mytitle <- paste('Working Time Series (base=',par8,', d=',par3,', D=',par4,')',sep='')
mysub <- paste('(base=',par8,', d=',par3,', D=',par4,', CI=', par7, ', CI type=',par6,')',sep='')
}
plot(x,type='l', main=mytitle,xlab='time',ylab='value')
par(op)
dev.off()
bitmap(file='pic1.png')
racf <- acf(x, par1, main='Autocorrelation', xlab='time lag', ylab='ACF', ci.type=par6, ci=par7, sub=mysub)
dev.off()
bitmap(file='pic2.png')
rpacf <- pacf(x,par1,main='Partial Autocorrelation',xlab='lags',ylab='PACF',sub=mysub)
dev.off()
(myacf <- c(racf$acf))
(mypacf <- c(rpacf$acf))
lengthx <- length(x)
sqrtn <- sqrt(lengthx)
load(file='createtable')
a<-table.start()
a<-table.row.start(a)
a<-table.element(a,'Autocorrelation Function',4,TRUE)
a<-table.row.end(a)
a<-table.row.start(a)
a<-table.element(a,'Time lag k',header=TRUE)
a<-table.element(a,hyperlink('basics.htm','ACF(k)','click here for more information about the Autocorrelation Function'),header=TRUE)
a<-table.element(a,'T-STAT',header=TRUE)
a<-table.element(a,'P-value',header=TRUE)
a<-table.row.end(a)
for (i in 2:(par1+1)) {
a<-table.row.start(a)
a<-table.element(a,i-1,header=TRUE)
a<-table.element(a,round(myacf[i],6))
mytstat <- myacf[i]*sqrtn
a<-table.element(a,round(mytstat,4))
a<-table.element(a,round(1-pt(abs(mytstat),lengthx),6))
a<-table.row.end(a)
}
a<-table.end(a)
table.save(a,file='mytable.tab')
a<-table.start()
a<-table.row.start(a)
a<-table.element(a,'Partial Autocorrelation Function',4,TRUE)
a<-table.row.end(a)
a<-table.row.start(a)
a<-table.element(a,'Time lag k',header=TRUE)
a<-table.element(a,hyperlink('basics.htm','PACF(k)','click here for more information about the Partial Autocorrelation Function'),header=TRUE)
a<-table.element(a,'T-STAT',header=TRUE)
a<-table.element(a,'P-value',header=TRUE)
a<-table.row.end(a)
for (i in 1:par1) {
a<-table.row.start(a)
a<-table.element(a,i,header=TRUE)
a<-table.element(a,round(mypacf[i],6))
mytstat <- mypacf[i]*sqrtn
a<-table.element(a,round(mytstat,4))
a<-table.element(a,round(1-pt(abs(mytstat),lengthx),6))
a<-table.row.end(a)
}
a<-table.end(a)
table.save(a,file='mytable1.tab')