Free Statistics

of Irreproducible Research!

Author's title

Author*Unverified author*
R Software Modulerwasp_autocorrelation.wasp
Title produced by software(Partial) Autocorrelation Function
Date of computationFri, 23 Oct 2015 14:50:30 +0100
Cite this page as followsStatistical Computations at FreeStatistics.org, Office for Research Development and Education, URL https://freestatistics.org/blog/index.php?v=date/2015/Oct/23/t14456082625o5uqt1zup722qf.htm/, Retrieved Sat, 18 May 2024 19:41:53 +0000
Statistical Computations at FreeStatistics.org, Office for Research Development and Education, URL https://freestatistics.org/blog/index.php?pk=282908, Retrieved Sat, 18 May 2024 19:41:53 +0000
QR Codes:

Original text written by user:
IsPrivate?No (this computation is public)
User-defined keywords
Estimated Impact80
Family? (F = Feedback message, R = changed R code, M = changed R Module, P = changed Parameters, D = changed Data)
-       [(Partial) Autocorrelation Function] [Koffie indexprijz...] [2015-10-23 13:50:30] [91f26e786dd8a1c147ebc049dd81fbad] [Current]
Feedback Forum

Post a new message
Dataseries X:
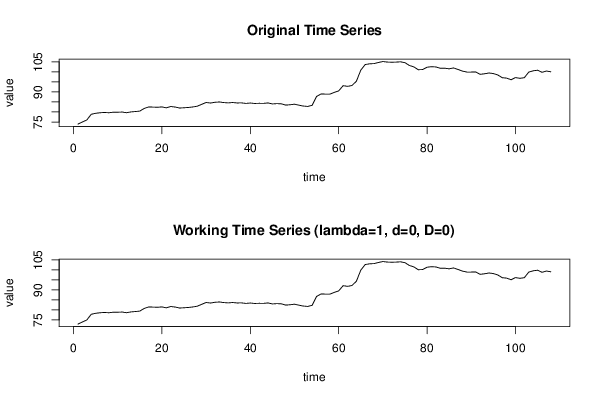
73.97
75.01
75.98
78.85
79.34
79.62
79.76
79.62
79.89
79.88
79.97
79.63
80.04
80.23
80.44
81.78
82.51
82.43
82.35
82.53
82.08
82.73
82.46
81.98
82.11
82.26
82.51
82.89
83.83
84.73
84.48
84.84
84.99
84.7
84.54
84.73
84.51
84.54
84.27
84.47
84.25
84.33
84.29
84.53
84.01
84.18
84.08
83.44
83.61
83.89
83.4
82.96
82.76
83.35
87.78
88.99
88.92
88.91
89.79
90.54
93.15
92.79
93.21
95.35
100.91
103.69
104.04
104.16
104.71
105.18
104.92
104.83
104.9
105.05
104.6
103.21
102.52
101.09
101.19
102.34
102.62
102.47
101.82
101.86
101.54
101.98
101.23
100.4
99.94
99.94
100
98.8
99.07
99.46
99.18
98.47
97.12
96.91
96.09
97.17
96.8
97.13
99.9
100.56
100.84
99.81
100.44
100.07


Summary of computational transaction
Raw Inputview raw input (R code)
Raw Outputview raw output of R engine
Computing time1 seconds
R Server'Gwilym Jenkins' @ jenkins.wessa.net

\begin{tabular}{lllllllll}
\hline
Summary of computational transaction \tabularnewline
Raw Input & view raw input (R code)  \tabularnewline
Raw Output & view raw output of R engine  \tabularnewline
Computing time & 1 seconds \tabularnewline
R Server & 'Gwilym Jenkins' @ jenkins.wessa.net \tabularnewline
\hline
\end{tabular}
%Source: https://freestatistics.org/blog/index.php?pk=282908&T=0

[TABLE]
[ROW][C]Summary of computational transaction[/C][/ROW]
[ROW][C]Raw Input[/C][C]view raw input (R code) [/C][/ROW]
[ROW][C]Raw Output[/C][C]view raw output of R engine [/C][/ROW]
[ROW][C]Computing time[/C][C]1 seconds[/C][/ROW]
[ROW][C]R Server[/C][C]'Gwilym Jenkins' @ jenkins.wessa.net[/C][/ROW]
[/TABLE]
Source: https://freestatistics.org/blog/index.php?pk=282908&T=0

Globally Unique Identifier (entire table): ba.freestatistics.org/blog/index.php?pk=282908&T=0

As an alternative you can also use a QR Code:  

The GUIDs for individual cells are displayed in the table below:

Summary of computational transaction
Raw Inputview raw input (R code)
Raw Outputview raw output of R engine
Computing time1 seconds
R Server'Gwilym Jenkins' @ jenkins.wessa.net


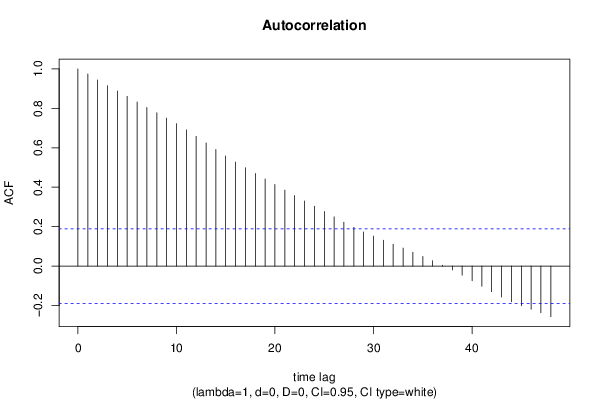
Autocorrelation Function
Time lag kACF(k)T-STATP-value
10.97410.12210
20.944089.81120
30.914549.50420
40.8884039.23260
50.8610478.94830
60.832248.64890
70.8048868.36460
80.7775998.0810
90.7507227.80170
100.7225997.50950
110.6910847.1820
120.6579436.83750
130.6246516.49160
140.5917336.14950
150.5582695.80170
160.5274145.4810
170.4984575.18011e-06
180.469474.87892e-06
190.4414124.58736e-06
200.4136624.29891.9e-05
210.385254.00365.7e-05
220.3577293.71760.00016
230.330513.43480.000421
240.3036543.15570.001038
250.2771022.87970.0024
260.2497892.59590.005374
270.2222052.30920.011417
280.1962532.03950.02192
290.1727911.79570.03767
300.1521021.58070.058437
310.1311311.36280.087897
320.110531.14870.126616
330.0910970.94670.17295
340.0701420.72890.233808
350.0486560.50560.307067
360.026830.27880.390458
370.0041890.04350.48268
38-0.019307-0.20060.420677
39-0.045858-0.47660.317317
40-0.074207-0.77120.221142
41-0.102721-1.06750.144062
42-0.130053-1.35150.089672
43-0.157233-1.6340.052584
44-0.181339-1.88450.031091
45-0.201269-2.09160.019407
46-0.219247-2.27850.012333
47-0.236983-2.46280.007683
48-0.256521-2.66580.004429

\begin{tabular}{lllllllll}
\hline
Autocorrelation Function \tabularnewline
Time lag k & ACF(k) & T-STAT & P-value \tabularnewline
1 & 0.974 & 10.1221 & 0 \tabularnewline
2 & 0.94408 & 9.8112 & 0 \tabularnewline
3 & 0.91454 & 9.5042 & 0 \tabularnewline
4 & 0.888403 & 9.2326 & 0 \tabularnewline
5 & 0.861047 & 8.9483 & 0 \tabularnewline
6 & 0.83224 & 8.6489 & 0 \tabularnewline
7 & 0.804886 & 8.3646 & 0 \tabularnewline
8 & 0.777599 & 8.081 & 0 \tabularnewline
9 & 0.750722 & 7.8017 & 0 \tabularnewline
10 & 0.722599 & 7.5095 & 0 \tabularnewline
11 & 0.691084 & 7.182 & 0 \tabularnewline
12 & 0.657943 & 6.8375 & 0 \tabularnewline
13 & 0.624651 & 6.4916 & 0 \tabularnewline
14 & 0.591733 & 6.1495 & 0 \tabularnewline
15 & 0.558269 & 5.8017 & 0 \tabularnewline
16 & 0.527414 & 5.481 & 0 \tabularnewline
17 & 0.498457 & 5.1801 & 1e-06 \tabularnewline
18 & 0.46947 & 4.8789 & 2e-06 \tabularnewline
19 & 0.441412 & 4.5873 & 6e-06 \tabularnewline
20 & 0.413662 & 4.2989 & 1.9e-05 \tabularnewline
21 & 0.38525 & 4.0036 & 5.7e-05 \tabularnewline
22 & 0.357729 & 3.7176 & 0.00016 \tabularnewline
23 & 0.33051 & 3.4348 & 0.000421 \tabularnewline
24 & 0.303654 & 3.1557 & 0.001038 \tabularnewline
25 & 0.277102 & 2.8797 & 0.0024 \tabularnewline
26 & 0.249789 & 2.5959 & 0.005374 \tabularnewline
27 & 0.222205 & 2.3092 & 0.011417 \tabularnewline
28 & 0.196253 & 2.0395 & 0.02192 \tabularnewline
29 & 0.172791 & 1.7957 & 0.03767 \tabularnewline
30 & 0.152102 & 1.5807 & 0.058437 \tabularnewline
31 & 0.131131 & 1.3628 & 0.087897 \tabularnewline
32 & 0.11053 & 1.1487 & 0.126616 \tabularnewline
33 & 0.091097 & 0.9467 & 0.17295 \tabularnewline
34 & 0.070142 & 0.7289 & 0.233808 \tabularnewline
35 & 0.048656 & 0.5056 & 0.307067 \tabularnewline
36 & 0.02683 & 0.2788 & 0.390458 \tabularnewline
37 & 0.004189 & 0.0435 & 0.48268 \tabularnewline
38 & -0.019307 & -0.2006 & 0.420677 \tabularnewline
39 & -0.045858 & -0.4766 & 0.317317 \tabularnewline
40 & -0.074207 & -0.7712 & 0.221142 \tabularnewline
41 & -0.102721 & -1.0675 & 0.144062 \tabularnewline
42 & -0.130053 & -1.3515 & 0.089672 \tabularnewline
43 & -0.157233 & -1.634 & 0.052584 \tabularnewline
44 & -0.181339 & -1.8845 & 0.031091 \tabularnewline
45 & -0.201269 & -2.0916 & 0.019407 \tabularnewline
46 & -0.219247 & -2.2785 & 0.012333 \tabularnewline
47 & -0.236983 & -2.4628 & 0.007683 \tabularnewline
48 & -0.256521 & -2.6658 & 0.004429 \tabularnewline
\hline
\end{tabular}
%Source: https://freestatistics.org/blog/index.php?pk=282908&T=1

[TABLE]
[ROW][C]Autocorrelation Function[/C][/ROW]
[ROW][C]Time lag k[/C][C]ACF(k)[/C][C]T-STAT[/C][C]P-value[/C][/ROW]
[ROW][C]1[/C][C]0.974[/C][C]10.1221[/C][C]0[/C][/ROW]
[ROW][C]2[/C][C]0.94408[/C][C]9.8112[/C][C]0[/C][/ROW]
[ROW][C]3[/C][C]0.91454[/C][C]9.5042[/C][C]0[/C][/ROW]
[ROW][C]4[/C][C]0.888403[/C][C]9.2326[/C][C]0[/C][/ROW]
[ROW][C]5[/C][C]0.861047[/C][C]8.9483[/C][C]0[/C][/ROW]
[ROW][C]6[/C][C]0.83224[/C][C]8.6489[/C][C]0[/C][/ROW]
[ROW][C]7[/C][C]0.804886[/C][C]8.3646[/C][C]0[/C][/ROW]
[ROW][C]8[/C][C]0.777599[/C][C]8.081[/C][C]0[/C][/ROW]
[ROW][C]9[/C][C]0.750722[/C][C]7.8017[/C][C]0[/C][/ROW]
[ROW][C]10[/C][C]0.722599[/C][C]7.5095[/C][C]0[/C][/ROW]
[ROW][C]11[/C][C]0.691084[/C][C]7.182[/C][C]0[/C][/ROW]
[ROW][C]12[/C][C]0.657943[/C][C]6.8375[/C][C]0[/C][/ROW]
[ROW][C]13[/C][C]0.624651[/C][C]6.4916[/C][C]0[/C][/ROW]
[ROW][C]14[/C][C]0.591733[/C][C]6.1495[/C][C]0[/C][/ROW]
[ROW][C]15[/C][C]0.558269[/C][C]5.8017[/C][C]0[/C][/ROW]
[ROW][C]16[/C][C]0.527414[/C][C]5.481[/C][C]0[/C][/ROW]
[ROW][C]17[/C][C]0.498457[/C][C]5.1801[/C][C]1e-06[/C][/ROW]
[ROW][C]18[/C][C]0.46947[/C][C]4.8789[/C][C]2e-06[/C][/ROW]
[ROW][C]19[/C][C]0.441412[/C][C]4.5873[/C][C]6e-06[/C][/ROW]
[ROW][C]20[/C][C]0.413662[/C][C]4.2989[/C][C]1.9e-05[/C][/ROW]
[ROW][C]21[/C][C]0.38525[/C][C]4.0036[/C][C]5.7e-05[/C][/ROW]
[ROW][C]22[/C][C]0.357729[/C][C]3.7176[/C][C]0.00016[/C][/ROW]
[ROW][C]23[/C][C]0.33051[/C][C]3.4348[/C][C]0.000421[/C][/ROW]
[ROW][C]24[/C][C]0.303654[/C][C]3.1557[/C][C]0.001038[/C][/ROW]
[ROW][C]25[/C][C]0.277102[/C][C]2.8797[/C][C]0.0024[/C][/ROW]
[ROW][C]26[/C][C]0.249789[/C][C]2.5959[/C][C]0.005374[/C][/ROW]
[ROW][C]27[/C][C]0.222205[/C][C]2.3092[/C][C]0.011417[/C][/ROW]
[ROW][C]28[/C][C]0.196253[/C][C]2.0395[/C][C]0.02192[/C][/ROW]
[ROW][C]29[/C][C]0.172791[/C][C]1.7957[/C][C]0.03767[/C][/ROW]
[ROW][C]30[/C][C]0.152102[/C][C]1.5807[/C][C]0.058437[/C][/ROW]
[ROW][C]31[/C][C]0.131131[/C][C]1.3628[/C][C]0.087897[/C][/ROW]
[ROW][C]32[/C][C]0.11053[/C][C]1.1487[/C][C]0.126616[/C][/ROW]
[ROW][C]33[/C][C]0.091097[/C][C]0.9467[/C][C]0.17295[/C][/ROW]
[ROW][C]34[/C][C]0.070142[/C][C]0.7289[/C][C]0.233808[/C][/ROW]
[ROW][C]35[/C][C]0.048656[/C][C]0.5056[/C][C]0.307067[/C][/ROW]
[ROW][C]36[/C][C]0.02683[/C][C]0.2788[/C][C]0.390458[/C][/ROW]
[ROW][C]37[/C][C]0.004189[/C][C]0.0435[/C][C]0.48268[/C][/ROW]
[ROW][C]38[/C][C]-0.019307[/C][C]-0.2006[/C][C]0.420677[/C][/ROW]
[ROW][C]39[/C][C]-0.045858[/C][C]-0.4766[/C][C]0.317317[/C][/ROW]
[ROW][C]40[/C][C]-0.074207[/C][C]-0.7712[/C][C]0.221142[/C][/ROW]
[ROW][C]41[/C][C]-0.102721[/C][C]-1.0675[/C][C]0.144062[/C][/ROW]
[ROW][C]42[/C][C]-0.130053[/C][C]-1.3515[/C][C]0.089672[/C][/ROW]
[ROW][C]43[/C][C]-0.157233[/C][C]-1.634[/C][C]0.052584[/C][/ROW]
[ROW][C]44[/C][C]-0.181339[/C][C]-1.8845[/C][C]0.031091[/C][/ROW]
[ROW][C]45[/C][C]-0.201269[/C][C]-2.0916[/C][C]0.019407[/C][/ROW]
[ROW][C]46[/C][C]-0.219247[/C][C]-2.2785[/C][C]0.012333[/C][/ROW]
[ROW][C]47[/C][C]-0.236983[/C][C]-2.4628[/C][C]0.007683[/C][/ROW]
[ROW][C]48[/C][C]-0.256521[/C][C]-2.6658[/C][C]0.004429[/C][/ROW]
[/TABLE]
Source: https://freestatistics.org/blog/index.php?pk=282908&T=1

Globally Unique Identifier (entire table): ba.freestatistics.org/blog/index.php?pk=282908&T=1

As an alternative you can also use a QR Code:  

The GUIDs for individual cells are displayed in the table below:

Autocorrelation Function
Time lag kACF(k)T-STATP-value
10.97410.12210
20.944089.81120
30.914549.50420
40.8884039.23260
50.8610478.94830
60.832248.64890
70.8048868.36460
80.7775998.0810
90.7507227.80170
100.7225997.50950
110.6910847.1820
120.6579436.83750
130.6246516.49160
140.5917336.14950
150.5582695.80170
160.5274145.4810
170.4984575.18011e-06
180.469474.87892e-06
190.4414124.58736e-06
200.4136624.29891.9e-05
210.385254.00365.7e-05
220.3577293.71760.00016
230.330513.43480.000421
240.3036543.15570.001038
250.2771022.87970.0024
260.2497892.59590.005374
270.2222052.30920.011417
280.1962532.03950.02192
290.1727911.79570.03767
300.1521021.58070.058437
310.1311311.36280.087897
320.110531.14870.126616
330.0910970.94670.17295
340.0701420.72890.233808
350.0486560.50560.307067
360.026830.27880.390458
370.0041890.04350.48268
38-0.019307-0.20060.420677
39-0.045858-0.47660.317317
40-0.074207-0.77120.221142
41-0.102721-1.06750.144062
42-0.130053-1.35150.089672
43-0.157233-1.6340.052584
44-0.181339-1.88450.031091
45-0.201269-2.09160.019407
46-0.219247-2.27850.012333
47-0.236983-2.46280.007683
48-0.256521-2.66580.004429


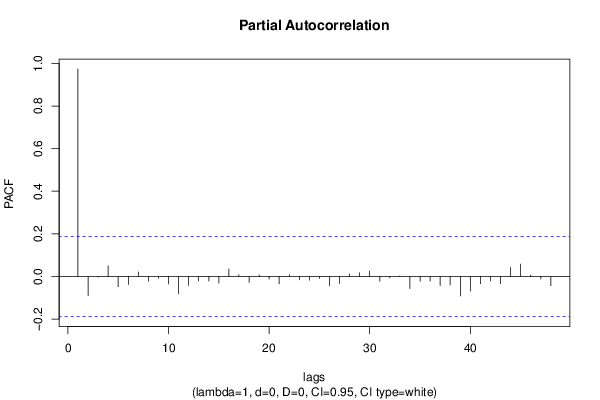
Partial Autocorrelation Function
Time lag kPACF(k)T-STATP-value
10.97410.12210
2-0.089532-0.93040.177109
3-0.002312-0.0240.49044
40.0498880.51840.302603
5-0.047692-0.49560.310583
6-0.038009-0.3950.346811
70.0209190.21740.414155
8-0.022747-0.23640.406787
9-0.009324-0.09690.461494
10-0.035268-0.36650.357348
11-0.0815-0.8470.19944
12-0.041835-0.43480.3323
13-0.021536-0.22380.411664
14-0.021596-0.22440.411421
15-0.031047-0.32270.373792
160.0351130.36490.357948
170.0075250.07820.468907
18-0.027645-0.28730.387217
190.0070880.07370.470709
20-0.012205-0.12680.449651
21-0.034939-0.36310.358621
220.0084920.08830.46492
23-0.015187-0.15780.437444
24-0.017358-0.18040.428592
25-0.009953-0.10340.458906
26-0.043794-0.45510.324968
27-0.033203-0.34510.365363
280.0113590.1180.453124
290.0176110.1830.427565
300.0258090.26820.394524
31-0.022601-0.23490.407376
32-0.005867-0.0610.475747
330.0025080.02610.489626
34-0.056858-0.59090.277915
35-0.022901-0.2380.406168
36-0.021301-0.22140.412613
37-0.042598-0.44270.329435
38-0.039342-0.40890.341727
39-0.091038-0.94610.173107
40-0.067905-0.70570.240952
41-0.03433-0.35680.360981
42-0.021578-0.22420.411494
43-0.033863-0.35190.362794
440.0419640.43610.331817
450.0578660.60140.27443
460.0064370.06690.473393
47-0.011815-0.12280.451252
48-0.043149-0.44840.327376

\begin{tabular}{lllllllll}
\hline
Partial Autocorrelation Function \tabularnewline
Time lag k & PACF(k) & T-STAT & P-value \tabularnewline
1 & 0.974 & 10.1221 & 0 \tabularnewline
2 & -0.089532 & -0.9304 & 0.177109 \tabularnewline
3 & -0.002312 & -0.024 & 0.49044 \tabularnewline
4 & 0.049888 & 0.5184 & 0.302603 \tabularnewline
5 & -0.047692 & -0.4956 & 0.310583 \tabularnewline
6 & -0.038009 & -0.395 & 0.346811 \tabularnewline
7 & 0.020919 & 0.2174 & 0.414155 \tabularnewline
8 & -0.022747 & -0.2364 & 0.406787 \tabularnewline
9 & -0.009324 & -0.0969 & 0.461494 \tabularnewline
10 & -0.035268 & -0.3665 & 0.357348 \tabularnewline
11 & -0.0815 & -0.847 & 0.19944 \tabularnewline
12 & -0.041835 & -0.4348 & 0.3323 \tabularnewline
13 & -0.021536 & -0.2238 & 0.411664 \tabularnewline
14 & -0.021596 & -0.2244 & 0.411421 \tabularnewline
15 & -0.031047 & -0.3227 & 0.373792 \tabularnewline
16 & 0.035113 & 0.3649 & 0.357948 \tabularnewline
17 & 0.007525 & 0.0782 & 0.468907 \tabularnewline
18 & -0.027645 & -0.2873 & 0.387217 \tabularnewline
19 & 0.007088 & 0.0737 & 0.470709 \tabularnewline
20 & -0.012205 & -0.1268 & 0.449651 \tabularnewline
21 & -0.034939 & -0.3631 & 0.358621 \tabularnewline
22 & 0.008492 & 0.0883 & 0.46492 \tabularnewline
23 & -0.015187 & -0.1578 & 0.437444 \tabularnewline
24 & -0.017358 & -0.1804 & 0.428592 \tabularnewline
25 & -0.009953 & -0.1034 & 0.458906 \tabularnewline
26 & -0.043794 & -0.4551 & 0.324968 \tabularnewline
27 & -0.033203 & -0.3451 & 0.365363 \tabularnewline
28 & 0.011359 & 0.118 & 0.453124 \tabularnewline
29 & 0.017611 & 0.183 & 0.427565 \tabularnewline
30 & 0.025809 & 0.2682 & 0.394524 \tabularnewline
31 & -0.022601 & -0.2349 & 0.407376 \tabularnewline
32 & -0.005867 & -0.061 & 0.475747 \tabularnewline
33 & 0.002508 & 0.0261 & 0.489626 \tabularnewline
34 & -0.056858 & -0.5909 & 0.277915 \tabularnewline
35 & -0.022901 & -0.238 & 0.406168 \tabularnewline
36 & -0.021301 & -0.2214 & 0.412613 \tabularnewline
37 & -0.042598 & -0.4427 & 0.329435 \tabularnewline
38 & -0.039342 & -0.4089 & 0.341727 \tabularnewline
39 & -0.091038 & -0.9461 & 0.173107 \tabularnewline
40 & -0.067905 & -0.7057 & 0.240952 \tabularnewline
41 & -0.03433 & -0.3568 & 0.360981 \tabularnewline
42 & -0.021578 & -0.2242 & 0.411494 \tabularnewline
43 & -0.033863 & -0.3519 & 0.362794 \tabularnewline
44 & 0.041964 & 0.4361 & 0.331817 \tabularnewline
45 & 0.057866 & 0.6014 & 0.27443 \tabularnewline
46 & 0.006437 & 0.0669 & 0.473393 \tabularnewline
47 & -0.011815 & -0.1228 & 0.451252 \tabularnewline
48 & -0.043149 & -0.4484 & 0.327376 \tabularnewline
\hline
\end{tabular}
%Source: https://freestatistics.org/blog/index.php?pk=282908&T=2

[TABLE]
[ROW][C]Partial Autocorrelation Function[/C][/ROW]
[ROW][C]Time lag k[/C][C]PACF(k)[/C][C]T-STAT[/C][C]P-value[/C][/ROW]
[ROW][C]1[/C][C]0.974[/C][C]10.1221[/C][C]0[/C][/ROW]
[ROW][C]2[/C][C]-0.089532[/C][C]-0.9304[/C][C]0.177109[/C][/ROW]
[ROW][C]3[/C][C]-0.002312[/C][C]-0.024[/C][C]0.49044[/C][/ROW]
[ROW][C]4[/C][C]0.049888[/C][C]0.5184[/C][C]0.302603[/C][/ROW]
[ROW][C]5[/C][C]-0.047692[/C][C]-0.4956[/C][C]0.310583[/C][/ROW]
[ROW][C]6[/C][C]-0.038009[/C][C]-0.395[/C][C]0.346811[/C][/ROW]
[ROW][C]7[/C][C]0.020919[/C][C]0.2174[/C][C]0.414155[/C][/ROW]
[ROW][C]8[/C][C]-0.022747[/C][C]-0.2364[/C][C]0.406787[/C][/ROW]
[ROW][C]9[/C][C]-0.009324[/C][C]-0.0969[/C][C]0.461494[/C][/ROW]
[ROW][C]10[/C][C]-0.035268[/C][C]-0.3665[/C][C]0.357348[/C][/ROW]
[ROW][C]11[/C][C]-0.0815[/C][C]-0.847[/C][C]0.19944[/C][/ROW]
[ROW][C]12[/C][C]-0.041835[/C][C]-0.4348[/C][C]0.3323[/C][/ROW]
[ROW][C]13[/C][C]-0.021536[/C][C]-0.2238[/C][C]0.411664[/C][/ROW]
[ROW][C]14[/C][C]-0.021596[/C][C]-0.2244[/C][C]0.411421[/C][/ROW]
[ROW][C]15[/C][C]-0.031047[/C][C]-0.3227[/C][C]0.373792[/C][/ROW]
[ROW][C]16[/C][C]0.035113[/C][C]0.3649[/C][C]0.357948[/C][/ROW]
[ROW][C]17[/C][C]0.007525[/C][C]0.0782[/C][C]0.468907[/C][/ROW]
[ROW][C]18[/C][C]-0.027645[/C][C]-0.2873[/C][C]0.387217[/C][/ROW]
[ROW][C]19[/C][C]0.007088[/C][C]0.0737[/C][C]0.470709[/C][/ROW]
[ROW][C]20[/C][C]-0.012205[/C][C]-0.1268[/C][C]0.449651[/C][/ROW]
[ROW][C]21[/C][C]-0.034939[/C][C]-0.3631[/C][C]0.358621[/C][/ROW]
[ROW][C]22[/C][C]0.008492[/C][C]0.0883[/C][C]0.46492[/C][/ROW]
[ROW][C]23[/C][C]-0.015187[/C][C]-0.1578[/C][C]0.437444[/C][/ROW]
[ROW][C]24[/C][C]-0.017358[/C][C]-0.1804[/C][C]0.428592[/C][/ROW]
[ROW][C]25[/C][C]-0.009953[/C][C]-0.1034[/C][C]0.458906[/C][/ROW]
[ROW][C]26[/C][C]-0.043794[/C][C]-0.4551[/C][C]0.324968[/C][/ROW]
[ROW][C]27[/C][C]-0.033203[/C][C]-0.3451[/C][C]0.365363[/C][/ROW]
[ROW][C]28[/C][C]0.011359[/C][C]0.118[/C][C]0.453124[/C][/ROW]
[ROW][C]29[/C][C]0.017611[/C][C]0.183[/C][C]0.427565[/C][/ROW]
[ROW][C]30[/C][C]0.025809[/C][C]0.2682[/C][C]0.394524[/C][/ROW]
[ROW][C]31[/C][C]-0.022601[/C][C]-0.2349[/C][C]0.407376[/C][/ROW]
[ROW][C]32[/C][C]-0.005867[/C][C]-0.061[/C][C]0.475747[/C][/ROW]
[ROW][C]33[/C][C]0.002508[/C][C]0.0261[/C][C]0.489626[/C][/ROW]
[ROW][C]34[/C][C]-0.056858[/C][C]-0.5909[/C][C]0.277915[/C][/ROW]
[ROW][C]35[/C][C]-0.022901[/C][C]-0.238[/C][C]0.406168[/C][/ROW]
[ROW][C]36[/C][C]-0.021301[/C][C]-0.2214[/C][C]0.412613[/C][/ROW]
[ROW][C]37[/C][C]-0.042598[/C][C]-0.4427[/C][C]0.329435[/C][/ROW]
[ROW][C]38[/C][C]-0.039342[/C][C]-0.4089[/C][C]0.341727[/C][/ROW]
[ROW][C]39[/C][C]-0.091038[/C][C]-0.9461[/C][C]0.173107[/C][/ROW]
[ROW][C]40[/C][C]-0.067905[/C][C]-0.7057[/C][C]0.240952[/C][/ROW]
[ROW][C]41[/C][C]-0.03433[/C][C]-0.3568[/C][C]0.360981[/C][/ROW]
[ROW][C]42[/C][C]-0.021578[/C][C]-0.2242[/C][C]0.411494[/C][/ROW]
[ROW][C]43[/C][C]-0.033863[/C][C]-0.3519[/C][C]0.362794[/C][/ROW]
[ROW][C]44[/C][C]0.041964[/C][C]0.4361[/C][C]0.331817[/C][/ROW]
[ROW][C]45[/C][C]0.057866[/C][C]0.6014[/C][C]0.27443[/C][/ROW]
[ROW][C]46[/C][C]0.006437[/C][C]0.0669[/C][C]0.473393[/C][/ROW]
[ROW][C]47[/C][C]-0.011815[/C][C]-0.1228[/C][C]0.451252[/C][/ROW]
[ROW][C]48[/C][C]-0.043149[/C][C]-0.4484[/C][C]0.327376[/C][/ROW]
[/TABLE]
Source: https://freestatistics.org/blog/index.php?pk=282908&T=2

Globally Unique Identifier (entire table): ba.freestatistics.org/blog/index.php?pk=282908&T=2

As an alternative you can also use a QR Code:  

The GUIDs for individual cells are displayed in the table below:

Partial Autocorrelation Function
Time lag kPACF(k)T-STATP-value
10.97410.12210
2-0.089532-0.93040.177109
3-0.002312-0.0240.49044
40.0498880.51840.302603
5-0.047692-0.49560.310583
6-0.038009-0.3950.346811
70.0209190.21740.414155
8-0.022747-0.23640.406787
9-0.009324-0.09690.461494
10-0.035268-0.36650.357348
11-0.0815-0.8470.19944
12-0.041835-0.43480.3323
13-0.021536-0.22380.411664
14-0.021596-0.22440.411421
15-0.031047-0.32270.373792
160.0351130.36490.357948
170.0075250.07820.468907
18-0.027645-0.28730.387217
190.0070880.07370.470709
20-0.012205-0.12680.449651
21-0.034939-0.36310.358621
220.0084920.08830.46492
23-0.015187-0.15780.437444
24-0.017358-0.18040.428592
25-0.009953-0.10340.458906
26-0.043794-0.45510.324968
27-0.033203-0.34510.365363
280.0113590.1180.453124
290.0176110.1830.427565
300.0258090.26820.394524
31-0.022601-0.23490.407376
32-0.005867-0.0610.475747
330.0025080.02610.489626
34-0.056858-0.59090.277915
35-0.022901-0.2380.406168
36-0.021301-0.22140.412613
37-0.042598-0.44270.329435
38-0.039342-0.40890.341727
39-0.091038-0.94610.173107
40-0.067905-0.70570.240952
41-0.03433-0.35680.360981
42-0.021578-0.22420.411494
43-0.033863-0.35190.362794
440.0419640.43610.331817
450.0578660.60140.27443
460.0064370.06690.473393
47-0.011815-0.12280.451252
48-0.043149-0.44840.327376


Parameters (Session):
par1 = 48 ; par2 = 1 ; par3 = 0 ; par4 = 0 ; par5 = 12 ; par6 = White Noise ; par7 = 0.95 ;
Parameters (R input):
par1 = 48 ; par2 = 1 ; par3 = 0 ; par4 = 0 ; par5 = 12 ; par6 = White Noise ; par7 = 0.95 ; par8 = ;
R code (references can be found in the software module):
par8 <- ''
par7 <- '0.95'
par6 <- 'White Noise'
par5 <- '12'
par4 <- '0'
par3 <- '0'
par2 <- '1'
par1 <- 'Default'
if (par1 == 'Default') {
par1 = 10*log10(length(x))
} else {
par1 <- as.numeric(par1)
}
par2 <- as.numeric(par2)
par3 <- as.numeric(par3)
par4 <- as.numeric(par4)
par5 <- as.numeric(par5)
if (par6 == 'White Noise') par6 <- 'white' else par6 <- 'ma'
par7 <- as.numeric(par7)
if (par8 != '') par8 <- as.numeric(par8)
ox <- x
if (par8 == '') {
if (par2 == 0) {
x <- log(x)
} else {
x <- (x ^ par2 - 1) / par2
}
} else {
x <- log(x,base=par8)
}
if (par3 > 0) x <- diff(x,lag=1,difference=par3)
if (par4 > 0) x <- diff(x,lag=par5,difference=par4)
bitmap(file='picts.png')
op <- par(mfrow=c(2,1))
plot(ox,type='l',main='Original Time Series',xlab='time',ylab='value')
if (par8=='') {
mytitle <- paste('Working Time Series (lambda=',par2,', d=',par3,', D=',par4,')',sep='')
mysub <- paste('(lambda=',par2,', d=',par3,', D=',par4,', CI=', par7, ', CI type=',par6,')',sep='')
} else {
mytitle <- paste('Working Time Series (base=',par8,', d=',par3,', D=',par4,')',sep='')
mysub <- paste('(base=',par8,', d=',par3,', D=',par4,', CI=', par7, ', CI type=',par6,')',sep='')
}
plot(x,type='l', main=mytitle,xlab='time',ylab='value')
par(op)
dev.off()
bitmap(file='pic1.png')
racf <- acf(x, par1, main='Autocorrelation', xlab='time lag', ylab='ACF', ci.type=par6, ci=par7, sub=mysub)
dev.off()
bitmap(file='pic2.png')
rpacf <- pacf(x,par1,main='Partial Autocorrelation',xlab='lags',ylab='PACF',sub=mysub)
dev.off()
(myacf <- c(racf$acf))
(mypacf <- c(rpacf$acf))
lengthx <- length(x)
sqrtn <- sqrt(lengthx)
load(file='createtable')
a<-table.start()
a<-table.row.start(a)
a<-table.element(a,'Autocorrelation Function',4,TRUE)
a<-table.row.end(a)
a<-table.row.start(a)
a<-table.element(a,'Time lag k',header=TRUE)
a<-table.element(a,hyperlink('basics.htm','ACF(k)','click here for more information about the Autocorrelation Function'),header=TRUE)
a<-table.element(a,'T-STAT',header=TRUE)
a<-table.element(a,'P-value',header=TRUE)
a<-table.row.end(a)
for (i in 2:(par1+1)) {
a<-table.row.start(a)
a<-table.element(a,i-1,header=TRUE)
a<-table.element(a,round(myacf[i],6))
mytstat <- myacf[i]*sqrtn
a<-table.element(a,round(mytstat,4))
a<-table.element(a,round(1-pt(abs(mytstat),lengthx),6))
a<-table.row.end(a)
}
a<-table.end(a)
table.save(a,file='mytable.tab')
a<-table.start()
a<-table.row.start(a)
a<-table.element(a,'Partial Autocorrelation Function',4,TRUE)
a<-table.row.end(a)
a<-table.row.start(a)
a<-table.element(a,'Time lag k',header=TRUE)
a<-table.element(a,hyperlink('basics.htm','PACF(k)','click here for more information about the Partial Autocorrelation Function'),header=TRUE)
a<-table.element(a,'T-STAT',header=TRUE)
a<-table.element(a,'P-value',header=TRUE)
a<-table.row.end(a)
for (i in 1:par1) {
a<-table.row.start(a)
a<-table.element(a,i,header=TRUE)
a<-table.element(a,round(mypacf[i],6))
mytstat <- mypacf[i]*sqrtn
a<-table.element(a,round(mytstat,4))
a<-table.element(a,round(1-pt(abs(mytstat),lengthx),6))
a<-table.row.end(a)
}
a<-table.end(a)
table.save(a,file='mytable1.tab')