Free Statistics

of Irreproducible Research!

Author's title

Author*Unverified author*
R Software Modulerwasp_autocorrelation.wasp
Title produced by software(Partial) Autocorrelation Function
Date of computationFri, 23 Oct 2015 11:19:32 +0100
Cite this page as followsStatistical Computations at FreeStatistics.org, Office for Research Development and Education, URL https://freestatistics.org/blog/index.php?v=date/2015/Oct/23/t14455956111u19cu8sf62gkm4.htm/, Retrieved Sat, 18 May 2024 21:54:08 +0000
Statistical Computations at FreeStatistics.org, Office for Research Development and Education, URL https://freestatistics.org/blog/index.php?pk=282873, Retrieved Sat, 18 May 2024 21:54:08 +0000
QR Codes:

Original text written by user:
IsPrivate?No (this computation is public)
User-defined keywords
Estimated Impact65
Family? (F = Feedback message, R = changed R code, M = changed R Module, P = changed Parameters, D = changed Data)
-       [(Partial) Autocorrelation Function] [] [2015-10-23 10:19:32] [6e9c8a19a65400226bf8d1f1815bc708] [Current]
Feedback Forum

Post a new message
Dataseries X:
71.59
71.65
71.47
71.82
71.76
71.88
73.31
73.22
72.74
72.95
73.71
74.45
76.54
77.41
76.87
76.51
75.66
75.09
75.16
75
75.05
74.78
75.43
75.61
77.12
83.09
86.09
87.64
88.29
89.3
89.99
90.43
91.03
91.4
92.19
92.45
92.42
90.2
88.23
84.91
82.92
81.8
81.7
83.22
82.7
82.83
83.66
84.28
84.37
86.49
87.62
88.59
89.74
89.73
89.14
88.37
88.65
89.16
89.56
89.37
89.67
93.04
94.4
95.5
101.66
102.86
102.48
102.02
101.83
101.3
101.29
100.53
100.45
101.88
101.95
102.18
100.95
100.52
100.39
99.61
99.43
99.34
100.73
102.14
102.22
101.14
100.91
101.62
100
99.92
100.07
98.48
98.3
98.86
98.96
99.52
99.06
100.47
100.24
86.43
85.14
85.41
86.13
86.19
86.29
87.55
87.87
88.37


Summary of computational transaction
Raw Inputview raw input (R code)
Raw Outputview raw output of R engine
Computing time1 seconds
R Server'Herman Ole Andreas Wold' @ wold.wessa.net

\begin{tabular}{lllllllll}
\hline
Summary of computational transaction \tabularnewline
Raw Input & view raw input (R code)  \tabularnewline
Raw Output & view raw output of R engine  \tabularnewline
Computing time & 1 seconds \tabularnewline
R Server & 'Herman Ole Andreas Wold' @ wold.wessa.net \tabularnewline
\hline
\end{tabular}
%Source: https://freestatistics.org/blog/index.php?pk=282873&T=0

[TABLE]
[ROW][C]Summary of computational transaction[/C][/ROW]
[ROW][C]Raw Input[/C][C]view raw input (R code) [/C][/ROW]
[ROW][C]Raw Output[/C][C]view raw output of R engine [/C][/ROW]
[ROW][C]Computing time[/C][C]1 seconds[/C][/ROW]
[ROW][C]R Server[/C][C]'Herman Ole Andreas Wold' @ wold.wessa.net[/C][/ROW]
[/TABLE]
Source: https://freestatistics.org/blog/index.php?pk=282873&T=0

Globally Unique Identifier (entire table): ba.freestatistics.org/blog/index.php?pk=282873&T=0

As an alternative you can also use a QR Code:  

The GUIDs for individual cells are displayed in the table below:

Summary of computational transaction
Raw Inputview raw input (R code)
Raw Outputview raw output of R engine
Computing time1 seconds
R Server'Herman Ole Andreas Wold' @ wold.wessa.net


Autocorrelation Function
Time lag kACF(k)T-STATP-value
10.96944510.07480
20.9290929.65540
30.8862389.21010
40.8403778.73340
50.7942968.25460
60.7493067.7870
70.7096227.37460
80.6706736.96980
90.6305516.55290
100.5920236.15250
110.556425.78250
120.5219375.42410
130.4930295.12371e-06
140.4664644.84762e-06
150.4385944.5587e-06
160.4101414.26232.2e-05
170.3822143.97216.4e-05
180.354923.68840.000178
190.3255533.38330.000499
200.2938033.05330.001425
210.2603182.70530.003966
220.2246312.33440.010711
230.1882921.95680.026477
240.1504441.56350.060435
250.1163111.20870.114701
260.0932430.9690.167353
270.0782420.81310.208971
280.0687090.7140.238369
290.0606340.63010.264971
300.0545150.56650.286103
310.0485150.50420.307581
320.0415790.43210.333266
330.0335010.34820.364201
340.0242030.25150.400944
350.0169620.17630.430206
360.0166210.17270.431595

\begin{tabular}{lllllllll}
\hline
Autocorrelation Function \tabularnewline
Time lag k & ACF(k) & T-STAT & P-value \tabularnewline
1 & 0.969445 & 10.0748 & 0 \tabularnewline
2 & 0.929092 & 9.6554 & 0 \tabularnewline
3 & 0.886238 & 9.2101 & 0 \tabularnewline
4 & 0.840377 & 8.7334 & 0 \tabularnewline
5 & 0.794296 & 8.2546 & 0 \tabularnewline
6 & 0.749306 & 7.787 & 0 \tabularnewline
7 & 0.709622 & 7.3746 & 0 \tabularnewline
8 & 0.670673 & 6.9698 & 0 \tabularnewline
9 & 0.630551 & 6.5529 & 0 \tabularnewline
10 & 0.592023 & 6.1525 & 0 \tabularnewline
11 & 0.55642 & 5.7825 & 0 \tabularnewline
12 & 0.521937 & 5.4241 & 0 \tabularnewline
13 & 0.493029 & 5.1237 & 1e-06 \tabularnewline
14 & 0.466464 & 4.8476 & 2e-06 \tabularnewline
15 & 0.438594 & 4.558 & 7e-06 \tabularnewline
16 & 0.410141 & 4.2623 & 2.2e-05 \tabularnewline
17 & 0.382214 & 3.9721 & 6.4e-05 \tabularnewline
18 & 0.35492 & 3.6884 & 0.000178 \tabularnewline
19 & 0.325553 & 3.3833 & 0.000499 \tabularnewline
20 & 0.293803 & 3.0533 & 0.001425 \tabularnewline
21 & 0.260318 & 2.7053 & 0.003966 \tabularnewline
22 & 0.224631 & 2.3344 & 0.010711 \tabularnewline
23 & 0.188292 & 1.9568 & 0.026477 \tabularnewline
24 & 0.150444 & 1.5635 & 0.060435 \tabularnewline
25 & 0.116311 & 1.2087 & 0.114701 \tabularnewline
26 & 0.093243 & 0.969 & 0.167353 \tabularnewline
27 & 0.078242 & 0.8131 & 0.208971 \tabularnewline
28 & 0.068709 & 0.714 & 0.238369 \tabularnewline
29 & 0.060634 & 0.6301 & 0.264971 \tabularnewline
30 & 0.054515 & 0.5665 & 0.286103 \tabularnewline
31 & 0.048515 & 0.5042 & 0.307581 \tabularnewline
32 & 0.041579 & 0.4321 & 0.333266 \tabularnewline
33 & 0.033501 & 0.3482 & 0.364201 \tabularnewline
34 & 0.024203 & 0.2515 & 0.400944 \tabularnewline
35 & 0.016962 & 0.1763 & 0.430206 \tabularnewline
36 & 0.016621 & 0.1727 & 0.431595 \tabularnewline
\hline
\end{tabular}
%Source: https://freestatistics.org/blog/index.php?pk=282873&T=1

[TABLE]
[ROW][C]Autocorrelation Function[/C][/ROW]
[ROW][C]Time lag k[/C][C]ACF(k)[/C][C]T-STAT[/C][C]P-value[/C][/ROW]
[ROW][C]1[/C][C]0.969445[/C][C]10.0748[/C][C]0[/C][/ROW]
[ROW][C]2[/C][C]0.929092[/C][C]9.6554[/C][C]0[/C][/ROW]
[ROW][C]3[/C][C]0.886238[/C][C]9.2101[/C][C]0[/C][/ROW]
[ROW][C]4[/C][C]0.840377[/C][C]8.7334[/C][C]0[/C][/ROW]
[ROW][C]5[/C][C]0.794296[/C][C]8.2546[/C][C]0[/C][/ROW]
[ROW][C]6[/C][C]0.749306[/C][C]7.787[/C][C]0[/C][/ROW]
[ROW][C]7[/C][C]0.709622[/C][C]7.3746[/C][C]0[/C][/ROW]
[ROW][C]8[/C][C]0.670673[/C][C]6.9698[/C][C]0[/C][/ROW]
[ROW][C]9[/C][C]0.630551[/C][C]6.5529[/C][C]0[/C][/ROW]
[ROW][C]10[/C][C]0.592023[/C][C]6.1525[/C][C]0[/C][/ROW]
[ROW][C]11[/C][C]0.55642[/C][C]5.7825[/C][C]0[/C][/ROW]
[ROW][C]12[/C][C]0.521937[/C][C]5.4241[/C][C]0[/C][/ROW]
[ROW][C]13[/C][C]0.493029[/C][C]5.1237[/C][C]1e-06[/C][/ROW]
[ROW][C]14[/C][C]0.466464[/C][C]4.8476[/C][C]2e-06[/C][/ROW]
[ROW][C]15[/C][C]0.438594[/C][C]4.558[/C][C]7e-06[/C][/ROW]
[ROW][C]16[/C][C]0.410141[/C][C]4.2623[/C][C]2.2e-05[/C][/ROW]
[ROW][C]17[/C][C]0.382214[/C][C]3.9721[/C][C]6.4e-05[/C][/ROW]
[ROW][C]18[/C][C]0.35492[/C][C]3.6884[/C][C]0.000178[/C][/ROW]
[ROW][C]19[/C][C]0.325553[/C][C]3.3833[/C][C]0.000499[/C][/ROW]
[ROW][C]20[/C][C]0.293803[/C][C]3.0533[/C][C]0.001425[/C][/ROW]
[ROW][C]21[/C][C]0.260318[/C][C]2.7053[/C][C]0.003966[/C][/ROW]
[ROW][C]22[/C][C]0.224631[/C][C]2.3344[/C][C]0.010711[/C][/ROW]
[ROW][C]23[/C][C]0.188292[/C][C]1.9568[/C][C]0.026477[/C][/ROW]
[ROW][C]24[/C][C]0.150444[/C][C]1.5635[/C][C]0.060435[/C][/ROW]
[ROW][C]25[/C][C]0.116311[/C][C]1.2087[/C][C]0.114701[/C][/ROW]
[ROW][C]26[/C][C]0.093243[/C][C]0.969[/C][C]0.167353[/C][/ROW]
[ROW][C]27[/C][C]0.078242[/C][C]0.8131[/C][C]0.208971[/C][/ROW]
[ROW][C]28[/C][C]0.068709[/C][C]0.714[/C][C]0.238369[/C][/ROW]
[ROW][C]29[/C][C]0.060634[/C][C]0.6301[/C][C]0.264971[/C][/ROW]
[ROW][C]30[/C][C]0.054515[/C][C]0.5665[/C][C]0.286103[/C][/ROW]
[ROW][C]31[/C][C]0.048515[/C][C]0.5042[/C][C]0.307581[/C][/ROW]
[ROW][C]32[/C][C]0.041579[/C][C]0.4321[/C][C]0.333266[/C][/ROW]
[ROW][C]33[/C][C]0.033501[/C][C]0.3482[/C][C]0.364201[/C][/ROW]
[ROW][C]34[/C][C]0.024203[/C][C]0.2515[/C][C]0.400944[/C][/ROW]
[ROW][C]35[/C][C]0.016962[/C][C]0.1763[/C][C]0.430206[/C][/ROW]
[ROW][C]36[/C][C]0.016621[/C][C]0.1727[/C][C]0.431595[/C][/ROW]
[/TABLE]
Source: https://freestatistics.org/blog/index.php?pk=282873&T=1

Globally Unique Identifier (entire table): ba.freestatistics.org/blog/index.php?pk=282873&T=1

As an alternative you can also use a QR Code:  

The GUIDs for individual cells are displayed in the table below:

Autocorrelation Function
Time lag kACF(k)T-STATP-value
10.96944510.07480
20.9290929.65540
30.8862389.21010
40.8403778.73340
50.7942968.25460
60.7493067.7870
70.7096227.37460
80.6706736.96980
90.6305516.55290
100.5920236.15250
110.556425.78250
120.5219375.42410
130.4930295.12371e-06
140.4664644.84762e-06
150.4385944.5587e-06
160.4101414.26232.2e-05
170.3822143.97216.4e-05
180.354923.68840.000178
190.3255533.38330.000499
200.2938033.05330.001425
210.2603182.70530.003966
220.2246312.33440.010711
230.1882921.95680.026477
240.1504441.56350.060435
250.1163111.20870.114701
260.0932430.9690.167353
270.0782420.81310.208971
280.0687090.7140.238369
290.0606340.63010.264971
300.0545150.56650.286103
310.0485150.50420.307581
320.0415790.43210.333266
330.0335010.34820.364201
340.0242030.25150.400944
350.0169620.17630.430206
360.0166210.17270.431595


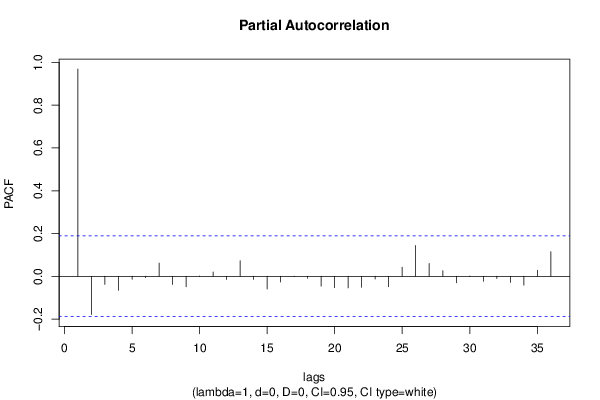
Partial Autocorrelation Function
Time lag kPACF(k)T-STATP-value
10.96944510.07480
2-0.178325-1.85320.033291
3-0.037884-0.39370.347289
4-0.065403-0.67970.249077
5-0.014-0.14550.442295
6-0.006025-0.06260.475095
70.0618290.64260.260939
8-0.03866-0.40180.344325
9-0.048726-0.50640.306814
100.0017280.0180.492852
110.0199350.20720.418132
12-0.014792-0.15370.439058
130.0726830.75530.225843
14-0.014403-0.14970.440649
15-0.059108-0.61430.270166
16-0.026681-0.27730.391049
17-0.001456-0.01510.493977
18-0.009354-0.09720.461371
19-0.045974-0.47780.316889
20-0.052822-0.54890.29209
21-0.054058-0.56180.287713
22-0.051429-0.53450.29706
23-0.012716-0.13210.447556
24-0.04846-0.50360.30778
250.0426090.44280.329397
260.1438891.49530.068871
270.060230.62590.26634
280.0264650.2750.391909
29-0.030384-0.31580.376398
300.0016640.01730.493116
31-0.023128-0.24040.405255
32-0.010148-0.10550.458101
33-0.028815-0.29950.382585
34-0.041353-0.42980.334115
350.0287070.29830.383011
360.1146511.19150.118037

\begin{tabular}{lllllllll}
\hline
Partial Autocorrelation Function \tabularnewline
Time lag k & PACF(k) & T-STAT & P-value \tabularnewline
1 & 0.969445 & 10.0748 & 0 \tabularnewline
2 & -0.178325 & -1.8532 & 0.033291 \tabularnewline
3 & -0.037884 & -0.3937 & 0.347289 \tabularnewline
4 & -0.065403 & -0.6797 & 0.249077 \tabularnewline
5 & -0.014 & -0.1455 & 0.442295 \tabularnewline
6 & -0.006025 & -0.0626 & 0.475095 \tabularnewline
7 & 0.061829 & 0.6426 & 0.260939 \tabularnewline
8 & -0.03866 & -0.4018 & 0.344325 \tabularnewline
9 & -0.048726 & -0.5064 & 0.306814 \tabularnewline
10 & 0.001728 & 0.018 & 0.492852 \tabularnewline
11 & 0.019935 & 0.2072 & 0.418132 \tabularnewline
12 & -0.014792 & -0.1537 & 0.439058 \tabularnewline
13 & 0.072683 & 0.7553 & 0.225843 \tabularnewline
14 & -0.014403 & -0.1497 & 0.440649 \tabularnewline
15 & -0.059108 & -0.6143 & 0.270166 \tabularnewline
16 & -0.026681 & -0.2773 & 0.391049 \tabularnewline
17 & -0.001456 & -0.0151 & 0.493977 \tabularnewline
18 & -0.009354 & -0.0972 & 0.461371 \tabularnewline
19 & -0.045974 & -0.4778 & 0.316889 \tabularnewline
20 & -0.052822 & -0.5489 & 0.29209 \tabularnewline
21 & -0.054058 & -0.5618 & 0.287713 \tabularnewline
22 & -0.051429 & -0.5345 & 0.29706 \tabularnewline
23 & -0.012716 & -0.1321 & 0.447556 \tabularnewline
24 & -0.04846 & -0.5036 & 0.30778 \tabularnewline
25 & 0.042609 & 0.4428 & 0.329397 \tabularnewline
26 & 0.143889 & 1.4953 & 0.068871 \tabularnewline
27 & 0.06023 & 0.6259 & 0.26634 \tabularnewline
28 & 0.026465 & 0.275 & 0.391909 \tabularnewline
29 & -0.030384 & -0.3158 & 0.376398 \tabularnewline
30 & 0.001664 & 0.0173 & 0.493116 \tabularnewline
31 & -0.023128 & -0.2404 & 0.405255 \tabularnewline
32 & -0.010148 & -0.1055 & 0.458101 \tabularnewline
33 & -0.028815 & -0.2995 & 0.382585 \tabularnewline
34 & -0.041353 & -0.4298 & 0.334115 \tabularnewline
35 & 0.028707 & 0.2983 & 0.383011 \tabularnewline
36 & 0.114651 & 1.1915 & 0.118037 \tabularnewline
\hline
\end{tabular}
%Source: https://freestatistics.org/blog/index.php?pk=282873&T=2

[TABLE]
[ROW][C]Partial Autocorrelation Function[/C][/ROW]
[ROW][C]Time lag k[/C][C]PACF(k)[/C][C]T-STAT[/C][C]P-value[/C][/ROW]
[ROW][C]1[/C][C]0.969445[/C][C]10.0748[/C][C]0[/C][/ROW]
[ROW][C]2[/C][C]-0.178325[/C][C]-1.8532[/C][C]0.033291[/C][/ROW]
[ROW][C]3[/C][C]-0.037884[/C][C]-0.3937[/C][C]0.347289[/C][/ROW]
[ROW][C]4[/C][C]-0.065403[/C][C]-0.6797[/C][C]0.249077[/C][/ROW]
[ROW][C]5[/C][C]-0.014[/C][C]-0.1455[/C][C]0.442295[/C][/ROW]
[ROW][C]6[/C][C]-0.006025[/C][C]-0.0626[/C][C]0.475095[/C][/ROW]
[ROW][C]7[/C][C]0.061829[/C][C]0.6426[/C][C]0.260939[/C][/ROW]
[ROW][C]8[/C][C]-0.03866[/C][C]-0.4018[/C][C]0.344325[/C][/ROW]
[ROW][C]9[/C][C]-0.048726[/C][C]-0.5064[/C][C]0.306814[/C][/ROW]
[ROW][C]10[/C][C]0.001728[/C][C]0.018[/C][C]0.492852[/C][/ROW]
[ROW][C]11[/C][C]0.019935[/C][C]0.2072[/C][C]0.418132[/C][/ROW]
[ROW][C]12[/C][C]-0.014792[/C][C]-0.1537[/C][C]0.439058[/C][/ROW]
[ROW][C]13[/C][C]0.072683[/C][C]0.7553[/C][C]0.225843[/C][/ROW]
[ROW][C]14[/C][C]-0.014403[/C][C]-0.1497[/C][C]0.440649[/C][/ROW]
[ROW][C]15[/C][C]-0.059108[/C][C]-0.6143[/C][C]0.270166[/C][/ROW]
[ROW][C]16[/C][C]-0.026681[/C][C]-0.2773[/C][C]0.391049[/C][/ROW]
[ROW][C]17[/C][C]-0.001456[/C][C]-0.0151[/C][C]0.493977[/C][/ROW]
[ROW][C]18[/C][C]-0.009354[/C][C]-0.0972[/C][C]0.461371[/C][/ROW]
[ROW][C]19[/C][C]-0.045974[/C][C]-0.4778[/C][C]0.316889[/C][/ROW]
[ROW][C]20[/C][C]-0.052822[/C][C]-0.5489[/C][C]0.29209[/C][/ROW]
[ROW][C]21[/C][C]-0.054058[/C][C]-0.5618[/C][C]0.287713[/C][/ROW]
[ROW][C]22[/C][C]-0.051429[/C][C]-0.5345[/C][C]0.29706[/C][/ROW]
[ROW][C]23[/C][C]-0.012716[/C][C]-0.1321[/C][C]0.447556[/C][/ROW]
[ROW][C]24[/C][C]-0.04846[/C][C]-0.5036[/C][C]0.30778[/C][/ROW]
[ROW][C]25[/C][C]0.042609[/C][C]0.4428[/C][C]0.329397[/C][/ROW]
[ROW][C]26[/C][C]0.143889[/C][C]1.4953[/C][C]0.068871[/C][/ROW]
[ROW][C]27[/C][C]0.06023[/C][C]0.6259[/C][C]0.26634[/C][/ROW]
[ROW][C]28[/C][C]0.026465[/C][C]0.275[/C][C]0.391909[/C][/ROW]
[ROW][C]29[/C][C]-0.030384[/C][C]-0.3158[/C][C]0.376398[/C][/ROW]
[ROW][C]30[/C][C]0.001664[/C][C]0.0173[/C][C]0.493116[/C][/ROW]
[ROW][C]31[/C][C]-0.023128[/C][C]-0.2404[/C][C]0.405255[/C][/ROW]
[ROW][C]32[/C][C]-0.010148[/C][C]-0.1055[/C][C]0.458101[/C][/ROW]
[ROW][C]33[/C][C]-0.028815[/C][C]-0.2995[/C][C]0.382585[/C][/ROW]
[ROW][C]34[/C][C]-0.041353[/C][C]-0.4298[/C][C]0.334115[/C][/ROW]
[ROW][C]35[/C][C]0.028707[/C][C]0.2983[/C][C]0.383011[/C][/ROW]
[ROW][C]36[/C][C]0.114651[/C][C]1.1915[/C][C]0.118037[/C][/ROW]
[/TABLE]
Source: https://freestatistics.org/blog/index.php?pk=282873&T=2

Globally Unique Identifier (entire table): ba.freestatistics.org/blog/index.php?pk=282873&T=2

As an alternative you can also use a QR Code:  

The GUIDs for individual cells are displayed in the table below:

Partial Autocorrelation Function
Time lag kPACF(k)T-STATP-value
10.96944510.07480
2-0.178325-1.85320.033291
3-0.037884-0.39370.347289
4-0.065403-0.67970.249077
5-0.014-0.14550.442295
6-0.006025-0.06260.475095
70.0618290.64260.260939
8-0.03866-0.40180.344325
9-0.048726-0.50640.306814
100.0017280.0180.492852
110.0199350.20720.418132
12-0.014792-0.15370.439058
130.0726830.75530.225843
14-0.014403-0.14970.440649
15-0.059108-0.61430.270166
16-0.026681-0.27730.391049
17-0.001456-0.01510.493977
18-0.009354-0.09720.461371
19-0.045974-0.47780.316889
20-0.052822-0.54890.29209
21-0.054058-0.56180.287713
22-0.051429-0.53450.29706
23-0.012716-0.13210.447556
24-0.04846-0.50360.30778
250.0426090.44280.329397
260.1438891.49530.068871
270.060230.62590.26634
280.0264650.2750.391909
29-0.030384-0.31580.376398
300.0016640.01730.493116
31-0.023128-0.24040.405255
32-0.010148-0.10550.458101
33-0.028815-0.29950.382585
34-0.041353-0.42980.334115
350.0287070.29830.383011
360.1146511.19150.118037


Parameters (Session):
par1 = 36 ; par2 = 1 ; par3 = 0 ; par4 = 0 ; par5 = 12 ; par6 = White Noise ; par7 = 0.95 ;
Parameters (R input):
par1 = 36 ; par2 = 1 ; par3 = 0 ; par4 = 0 ; par5 = 12 ; par6 = White Noise ; par7 = 0.95 ; par8 = ;
R code (references can be found in the software module):
par8 <- ''
par7 <- '0.95'
par6 <- 'White Noise'
par5 <- '12'
par4 <- '0'
par3 <- '1'
par2 <- '1'
par1 <- '36'
if (par1 == 'Default') {
par1 = 10*log10(length(x))
} else {
par1 <- as.numeric(par1)
}
par2 <- as.numeric(par2)
par3 <- as.numeric(par3)
par4 <- as.numeric(par4)
par5 <- as.numeric(par5)
if (par6 == 'White Noise') par6 <- 'white' else par6 <- 'ma'
par7 <- as.numeric(par7)
if (par8 != '') par8 <- as.numeric(par8)
ox <- x
if (par8 == '') {
if (par2 == 0) {
x <- log(x)
} else {
x <- (x ^ par2 - 1) / par2
}
} else {
x <- log(x,base=par8)
}
if (par3 > 0) x <- diff(x,lag=1,difference=par3)
if (par4 > 0) x <- diff(x,lag=par5,difference=par4)
bitmap(file='picts.png')
op <- par(mfrow=c(2,1))
plot(ox,type='l',main='Original Time Series',xlab='time',ylab='value')
if (par8=='') {
mytitle <- paste('Working Time Series (lambda=',par2,', d=',par3,', D=',par4,')',sep='')
mysub <- paste('(lambda=',par2,', d=',par3,', D=',par4,', CI=', par7, ', CI type=',par6,')',sep='')
} else {
mytitle <- paste('Working Time Series (base=',par8,', d=',par3,', D=',par4,')',sep='')
mysub <- paste('(base=',par8,', d=',par3,', D=',par4,', CI=', par7, ', CI type=',par6,')',sep='')
}
plot(x,type='l', main=mytitle,xlab='time',ylab='value')
par(op)
dev.off()
bitmap(file='pic1.png')
racf <- acf(x, par1, main='Autocorrelation', xlab='time lag', ylab='ACF', ci.type=par6, ci=par7, sub=mysub)
dev.off()
bitmap(file='pic2.png')
rpacf <- pacf(x,par1,main='Partial Autocorrelation',xlab='lags',ylab='PACF',sub=mysub)
dev.off()
(myacf <- c(racf$acf))
(mypacf <- c(rpacf$acf))
lengthx <- length(x)
sqrtn <- sqrt(lengthx)
load(file='createtable')
a<-table.start()
a<-table.row.start(a)
a<-table.element(a,'Autocorrelation Function',4,TRUE)
a<-table.row.end(a)
a<-table.row.start(a)
a<-table.element(a,'Time lag k',header=TRUE)
a<-table.element(a,hyperlink('basics.htm','ACF(k)','click here for more information about the Autocorrelation Function'),header=TRUE)
a<-table.element(a,'T-STAT',header=TRUE)
a<-table.element(a,'P-value',header=TRUE)
a<-table.row.end(a)
for (i in 2:(par1+1)) {
a<-table.row.start(a)
a<-table.element(a,i-1,header=TRUE)
a<-table.element(a,round(myacf[i],6))
mytstat <- myacf[i]*sqrtn
a<-table.element(a,round(mytstat,4))
a<-table.element(a,round(1-pt(abs(mytstat),lengthx),6))
a<-table.row.end(a)
}
a<-table.end(a)
table.save(a,file='mytable.tab')
a<-table.start()
a<-table.row.start(a)
a<-table.element(a,'Partial Autocorrelation Function',4,TRUE)
a<-table.row.end(a)
a<-table.row.start(a)
a<-table.element(a,'Time lag k',header=TRUE)
a<-table.element(a,hyperlink('basics.htm','PACF(k)','click here for more information about the Partial Autocorrelation Function'),header=TRUE)
a<-table.element(a,'T-STAT',header=TRUE)
a<-table.element(a,'P-value',header=TRUE)
a<-table.row.end(a)
for (i in 1:par1) {
a<-table.row.start(a)
a<-table.element(a,i,header=TRUE)
a<-table.element(a,round(mypacf[i],6))
mytstat <- mypacf[i]*sqrtn
a<-table.element(a,round(mytstat,4))
a<-table.element(a,round(1-pt(abs(mytstat),lengthx),6))
a<-table.row.end(a)
}
a<-table.end(a)
table.save(a,file='mytable1.tab')