Free Statistics

of Irreproducible Research!

Author's title

Author*Unverified author*
R Software Modulerwasp_autocorrelation.wasp
Title produced by software(Partial) Autocorrelation Function
Date of computationFri, 23 Oct 2015 09:11:59 +0100
Cite this page as followsStatistical Computations at FreeStatistics.org, Office for Research Development and Education, URL https://freestatistics.org/blog/index.php?v=date/2015/Oct/23/t1445587959mynitqsklempyk1.htm/, Retrieved Sat, 18 May 2024 20:38:03 +0000
Statistical Computations at FreeStatistics.org, Office for Research Development and Education, URL https://freestatistics.org/blog/index.php?pk=282824, Retrieved Sat, 18 May 2024 20:38:03 +0000
QR Codes:

Original text written by user:
IsPrivate?No (this computation is public)
User-defined keywords
Estimated Impact128
Family? (F = Feedback message, R = changed R code, M = changed R Module, P = changed Parameters, D = changed Data)
-       [(Partial) Autocorrelation Function] [] [2015-10-23 08:11:59] [e7bd1b63287b3004f428c98394187272] [Current]
Feedback Forum

Post a new message
Dataseries X:
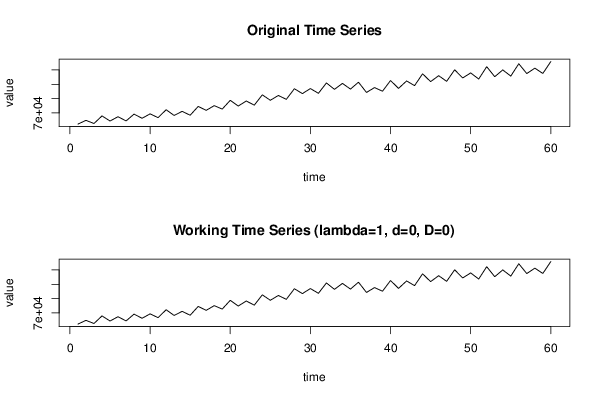
62239,3
64816,6
62625,3
67923
64363,7
67342
64411,2
69174,5
66290,2
69336,8
66712,2
72225,9
68229,5
71096,3
68407,9
74522,4
71798,4
75074,3
72694,6
78789,4
74814,5
78303,2
75431,6
82600,7
78830,5
82168,1
79493,2
86876,6
83478,5
87003,2
83672,7
90914,2
86448
90577,7
86621,1
91418,5
84275,4
87677,9
85149,6
92600
87111,3
92293,9
89060
97281,6
91812
95980,4
92043,7
100079,2
94384,8
97900,5
93630,8
102255,2
95251,8
100001,8
95689,8
104298
97435,1
101220,2
97537
105834,9


Summary of computational transaction
Raw Inputview raw input (R code)
Raw Outputview raw output of R engine
Computing time1 seconds
R Server'Gwilym Jenkins' @ jenkins.wessa.net

\begin{tabular}{lllllllll}
\hline
Summary of computational transaction \tabularnewline
Raw Input & view raw input (R code)  \tabularnewline
Raw Output & view raw output of R engine  \tabularnewline
Computing time & 1 seconds \tabularnewline
R Server & 'Gwilym Jenkins' @ jenkins.wessa.net \tabularnewline
\hline
\end{tabular}
%Source: https://freestatistics.org/blog/index.php?pk=282824&T=0

[TABLE]
[ROW][C]Summary of computational transaction[/C][/ROW]
[ROW][C]Raw Input[/C][C]view raw input (R code) [/C][/ROW]
[ROW][C]Raw Output[/C][C]view raw output of R engine [/C][/ROW]
[ROW][C]Computing time[/C][C]1 seconds[/C][/ROW]
[ROW][C]R Server[/C][C]'Gwilym Jenkins' @ jenkins.wessa.net[/C][/ROW]
[/TABLE]
Source: https://freestatistics.org/blog/index.php?pk=282824&T=0

Globally Unique Identifier (entire table): ba.freestatistics.org/blog/index.php?pk=282824&T=0

As an alternative you can also use a QR Code:  

The GUIDs for individual cells are displayed in the table below:

Summary of computational transaction
Raw Inputview raw input (R code)
Raw Outputview raw output of R engine
Computing time1 seconds
R Server'Gwilym Jenkins' @ jenkins.wessa.net


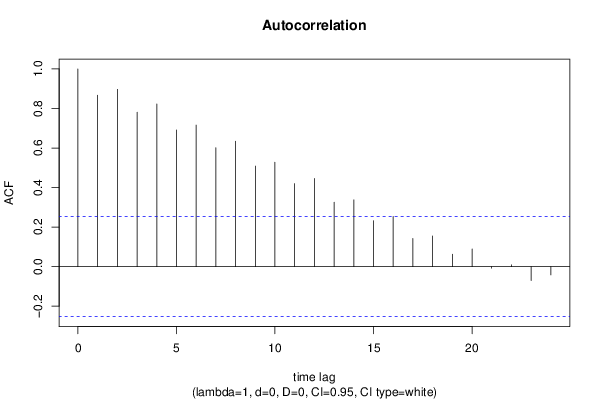
Autocorrelation Function
Time lag kACF(k)T-STATP-value
10.8667876.71410
20.8968746.94720
30.7812876.05180
40.8226146.37190
50.6912485.35441e-06
60.7158125.54470
70.6018074.66169e-06
80.6345884.91554e-06
90.5084483.93840.000108
100.5280094.08996.5e-05
110.4198953.25250.00094
120.4461853.45610.000506
130.3254632.5210.007188
140.337892.61730.0056
150.2324261.80040.038415
160.2535551.9640.027082
170.1421221.10090.137674
180.1552411.20250.116948
190.0625390.48440.314923
200.0891760.69080.246192
21-0.007608-0.05890.4766
220.0088290.06840.472853
23-0.070155-0.54340.294428
24-0.041944-0.32490.373196

\begin{tabular}{lllllllll}
\hline
Autocorrelation Function \tabularnewline
Time lag k & ACF(k) & T-STAT & P-value \tabularnewline
1 & 0.866787 & 6.7141 & 0 \tabularnewline
2 & 0.896874 & 6.9472 & 0 \tabularnewline
3 & 0.781287 & 6.0518 & 0 \tabularnewline
4 & 0.822614 & 6.3719 & 0 \tabularnewline
5 & 0.691248 & 5.3544 & 1e-06 \tabularnewline
6 & 0.715812 & 5.5447 & 0 \tabularnewline
7 & 0.601807 & 4.6616 & 9e-06 \tabularnewline
8 & 0.634588 & 4.9155 & 4e-06 \tabularnewline
9 & 0.508448 & 3.9384 & 0.000108 \tabularnewline
10 & 0.528009 & 4.0899 & 6.5e-05 \tabularnewline
11 & 0.419895 & 3.2525 & 0.00094 \tabularnewline
12 & 0.446185 & 3.4561 & 0.000506 \tabularnewline
13 & 0.325463 & 2.521 & 0.007188 \tabularnewline
14 & 0.33789 & 2.6173 & 0.0056 \tabularnewline
15 & 0.232426 & 1.8004 & 0.038415 \tabularnewline
16 & 0.253555 & 1.964 & 0.027082 \tabularnewline
17 & 0.142122 & 1.1009 & 0.137674 \tabularnewline
18 & 0.155241 & 1.2025 & 0.116948 \tabularnewline
19 & 0.062539 & 0.4844 & 0.314923 \tabularnewline
20 & 0.089176 & 0.6908 & 0.246192 \tabularnewline
21 & -0.007608 & -0.0589 & 0.4766 \tabularnewline
22 & 0.008829 & 0.0684 & 0.472853 \tabularnewline
23 & -0.070155 & -0.5434 & 0.294428 \tabularnewline
24 & -0.041944 & -0.3249 & 0.373196 \tabularnewline
\hline
\end{tabular}
%Source: https://freestatistics.org/blog/index.php?pk=282824&T=1

[TABLE]
[ROW][C]Autocorrelation Function[/C][/ROW]
[ROW][C]Time lag k[/C][C]ACF(k)[/C][C]T-STAT[/C][C]P-value[/C][/ROW]
[ROW][C]1[/C][C]0.866787[/C][C]6.7141[/C][C]0[/C][/ROW]
[ROW][C]2[/C][C]0.896874[/C][C]6.9472[/C][C]0[/C][/ROW]
[ROW][C]3[/C][C]0.781287[/C][C]6.0518[/C][C]0[/C][/ROW]
[ROW][C]4[/C][C]0.822614[/C][C]6.3719[/C][C]0[/C][/ROW]
[ROW][C]5[/C][C]0.691248[/C][C]5.3544[/C][C]1e-06[/C][/ROW]
[ROW][C]6[/C][C]0.715812[/C][C]5.5447[/C][C]0[/C][/ROW]
[ROW][C]7[/C][C]0.601807[/C][C]4.6616[/C][C]9e-06[/C][/ROW]
[ROW][C]8[/C][C]0.634588[/C][C]4.9155[/C][C]4e-06[/C][/ROW]
[ROW][C]9[/C][C]0.508448[/C][C]3.9384[/C][C]0.000108[/C][/ROW]
[ROW][C]10[/C][C]0.528009[/C][C]4.0899[/C][C]6.5e-05[/C][/ROW]
[ROW][C]11[/C][C]0.419895[/C][C]3.2525[/C][C]0.00094[/C][/ROW]
[ROW][C]12[/C][C]0.446185[/C][C]3.4561[/C][C]0.000506[/C][/ROW]
[ROW][C]13[/C][C]0.325463[/C][C]2.521[/C][C]0.007188[/C][/ROW]
[ROW][C]14[/C][C]0.33789[/C][C]2.6173[/C][C]0.0056[/C][/ROW]
[ROW][C]15[/C][C]0.232426[/C][C]1.8004[/C][C]0.038415[/C][/ROW]
[ROW][C]16[/C][C]0.253555[/C][C]1.964[/C][C]0.027082[/C][/ROW]
[ROW][C]17[/C][C]0.142122[/C][C]1.1009[/C][C]0.137674[/C][/ROW]
[ROW][C]18[/C][C]0.155241[/C][C]1.2025[/C][C]0.116948[/C][/ROW]
[ROW][C]19[/C][C]0.062539[/C][C]0.4844[/C][C]0.314923[/C][/ROW]
[ROW][C]20[/C][C]0.089176[/C][C]0.6908[/C][C]0.246192[/C][/ROW]
[ROW][C]21[/C][C]-0.007608[/C][C]-0.0589[/C][C]0.4766[/C][/ROW]
[ROW][C]22[/C][C]0.008829[/C][C]0.0684[/C][C]0.472853[/C][/ROW]
[ROW][C]23[/C][C]-0.070155[/C][C]-0.5434[/C][C]0.294428[/C][/ROW]
[ROW][C]24[/C][C]-0.041944[/C][C]-0.3249[/C][C]0.373196[/C][/ROW]
[/TABLE]
Source: https://freestatistics.org/blog/index.php?pk=282824&T=1

Globally Unique Identifier (entire table): ba.freestatistics.org/blog/index.php?pk=282824&T=1

As an alternative you can also use a QR Code:  

The GUIDs for individual cells are displayed in the table below:

Autocorrelation Function
Time lag kACF(k)T-STATP-value
10.8667876.71410
20.8968746.94720
30.7812876.05180
40.8226146.37190
50.6912485.35441e-06
60.7158125.54470
70.6018074.66169e-06
80.6345884.91554e-06
90.5084483.93840.000108
100.5280094.08996.5e-05
110.4198953.25250.00094
120.4461853.45610.000506
130.3254632.5210.007188
140.337892.61730.0056
150.2324261.80040.038415
160.2535551.9640.027082
170.1421221.10090.137674
180.1552411.20250.116948
190.0625390.48440.314923
200.0891760.69080.246192
21-0.007608-0.05890.4766
220.0088290.06840.472853
23-0.070155-0.54340.294428
24-0.041944-0.32490.373196


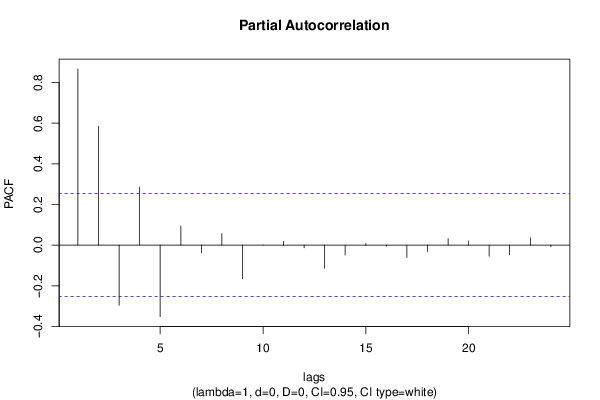
Partial Autocorrelation Function
Time lag kPACF(k)T-STATP-value
10.8667876.71410
20.5853084.53381.4e-05
3-0.296244-2.29470.012632
40.2859052.21460.015298
5-0.351983-2.72650.00419
60.0936320.72530.235552
7-0.038534-0.29850.383182
80.0565140.43780.331567
9-0.165285-1.28030.102685
10-0.000481-0.00370.498519
110.0194450.15060.44039
12-0.013163-0.1020.459564
13-0.114045-0.88340.190276
14-0.048947-0.37910.352959
150.0074430.05770.477108
16-0.005852-0.04530.481999
17-0.060522-0.46880.320456
18-0.031051-0.24050.405373
190.0311940.24160.404948
200.0204860.15870.437224
21-0.05449-0.42210.337238
22-0.047575-0.36850.356893
230.0349880.2710.393654
24-0.008173-0.06330.474867

\begin{tabular}{lllllllll}
\hline
Partial Autocorrelation Function \tabularnewline
Time lag k & PACF(k) & T-STAT & P-value \tabularnewline
1 & 0.866787 & 6.7141 & 0 \tabularnewline
2 & 0.585308 & 4.5338 & 1.4e-05 \tabularnewline
3 & -0.296244 & -2.2947 & 0.012632 \tabularnewline
4 & 0.285905 & 2.2146 & 0.015298 \tabularnewline
5 & -0.351983 & -2.7265 & 0.00419 \tabularnewline
6 & 0.093632 & 0.7253 & 0.235552 \tabularnewline
7 & -0.038534 & -0.2985 & 0.383182 \tabularnewline
8 & 0.056514 & 0.4378 & 0.331567 \tabularnewline
9 & -0.165285 & -1.2803 & 0.102685 \tabularnewline
10 & -0.000481 & -0.0037 & 0.498519 \tabularnewline
11 & 0.019445 & 0.1506 & 0.44039 \tabularnewline
12 & -0.013163 & -0.102 & 0.459564 \tabularnewline
13 & -0.114045 & -0.8834 & 0.190276 \tabularnewline
14 & -0.048947 & -0.3791 & 0.352959 \tabularnewline
15 & 0.007443 & 0.0577 & 0.477108 \tabularnewline
16 & -0.005852 & -0.0453 & 0.481999 \tabularnewline
17 & -0.060522 & -0.4688 & 0.320456 \tabularnewline
18 & -0.031051 & -0.2405 & 0.405373 \tabularnewline
19 & 0.031194 & 0.2416 & 0.404948 \tabularnewline
20 & 0.020486 & 0.1587 & 0.437224 \tabularnewline
21 & -0.05449 & -0.4221 & 0.337238 \tabularnewline
22 & -0.047575 & -0.3685 & 0.356893 \tabularnewline
23 & 0.034988 & 0.271 & 0.393654 \tabularnewline
24 & -0.008173 & -0.0633 & 0.474867 \tabularnewline
\hline
\end{tabular}
%Source: https://freestatistics.org/blog/index.php?pk=282824&T=2

[TABLE]
[ROW][C]Partial Autocorrelation Function[/C][/ROW]
[ROW][C]Time lag k[/C][C]PACF(k)[/C][C]T-STAT[/C][C]P-value[/C][/ROW]
[ROW][C]1[/C][C]0.866787[/C][C]6.7141[/C][C]0[/C][/ROW]
[ROW][C]2[/C][C]0.585308[/C][C]4.5338[/C][C]1.4e-05[/C][/ROW]
[ROW][C]3[/C][C]-0.296244[/C][C]-2.2947[/C][C]0.012632[/C][/ROW]
[ROW][C]4[/C][C]0.285905[/C][C]2.2146[/C][C]0.015298[/C][/ROW]
[ROW][C]5[/C][C]-0.351983[/C][C]-2.7265[/C][C]0.00419[/C][/ROW]
[ROW][C]6[/C][C]0.093632[/C][C]0.7253[/C][C]0.235552[/C][/ROW]
[ROW][C]7[/C][C]-0.038534[/C][C]-0.2985[/C][C]0.383182[/C][/ROW]
[ROW][C]8[/C][C]0.056514[/C][C]0.4378[/C][C]0.331567[/C][/ROW]
[ROW][C]9[/C][C]-0.165285[/C][C]-1.2803[/C][C]0.102685[/C][/ROW]
[ROW][C]10[/C][C]-0.000481[/C][C]-0.0037[/C][C]0.498519[/C][/ROW]
[ROW][C]11[/C][C]0.019445[/C][C]0.1506[/C][C]0.44039[/C][/ROW]
[ROW][C]12[/C][C]-0.013163[/C][C]-0.102[/C][C]0.459564[/C][/ROW]
[ROW][C]13[/C][C]-0.114045[/C][C]-0.8834[/C][C]0.190276[/C][/ROW]
[ROW][C]14[/C][C]-0.048947[/C][C]-0.3791[/C][C]0.352959[/C][/ROW]
[ROW][C]15[/C][C]0.007443[/C][C]0.0577[/C][C]0.477108[/C][/ROW]
[ROW][C]16[/C][C]-0.005852[/C][C]-0.0453[/C][C]0.481999[/C][/ROW]
[ROW][C]17[/C][C]-0.060522[/C][C]-0.4688[/C][C]0.320456[/C][/ROW]
[ROW][C]18[/C][C]-0.031051[/C][C]-0.2405[/C][C]0.405373[/C][/ROW]
[ROW][C]19[/C][C]0.031194[/C][C]0.2416[/C][C]0.404948[/C][/ROW]
[ROW][C]20[/C][C]0.020486[/C][C]0.1587[/C][C]0.437224[/C][/ROW]
[ROW][C]21[/C][C]-0.05449[/C][C]-0.4221[/C][C]0.337238[/C][/ROW]
[ROW][C]22[/C][C]-0.047575[/C][C]-0.3685[/C][C]0.356893[/C][/ROW]
[ROW][C]23[/C][C]0.034988[/C][C]0.271[/C][C]0.393654[/C][/ROW]
[ROW][C]24[/C][C]-0.008173[/C][C]-0.0633[/C][C]0.474867[/C][/ROW]
[/TABLE]
Source: https://freestatistics.org/blog/index.php?pk=282824&T=2

Globally Unique Identifier (entire table): ba.freestatistics.org/blog/index.php?pk=282824&T=2

As an alternative you can also use a QR Code:  

The GUIDs for individual cells are displayed in the table below:

Partial Autocorrelation Function
Time lag kPACF(k)T-STATP-value
10.8667876.71410
20.5853084.53381.4e-05
3-0.296244-2.29470.012632
40.2859052.21460.015298
5-0.351983-2.72650.00419
60.0936320.72530.235552
7-0.038534-0.29850.383182
80.0565140.43780.331567
9-0.165285-1.28030.102685
10-0.000481-0.00370.498519
110.0194450.15060.44039
12-0.013163-0.1020.459564
13-0.114045-0.88340.190276
14-0.048947-0.37910.352959
150.0074430.05770.477108
16-0.005852-0.04530.481999
17-0.060522-0.46880.320456
18-0.031051-0.24050.405373
190.0311940.24160.404948
200.0204860.15870.437224
21-0.05449-0.42210.337238
22-0.047575-0.36850.356893
230.0349880.2710.393654
24-0.008173-0.06330.474867


Parameters (Session):
par1 = 24 ; par2 = 1 ; par3 = 0 ; par4 = 0 ; par5 = 12 ; par6 = White Noise ; par7 = 0.95 ;
Parameters (R input):
par1 = 24 ; par2 = 1 ; par3 = 0 ; par4 = 0 ; par5 = 12 ; par6 = White Noise ; par7 = 0.95 ; par8 = ;
R code (references can be found in the software module):
if (par1 == 'Default') {
par1 = 10*log10(length(x))
} else {
par1 <- as.numeric(par1)
}
par2 <- as.numeric(par2)
par3 <- as.numeric(par3)
par4 <- as.numeric(par4)
par5 <- as.numeric(par5)
if (par6 == 'White Noise') par6 <- 'white' else par6 <- 'ma'
par7 <- as.numeric(par7)
if (par8 != '') par8 <- as.numeric(par8)
ox <- x
if (par8 == '') {
if (par2 == 0) {
x <- log(x)
} else {
x <- (x ^ par2 - 1) / par2
}
} else {
x <- log(x,base=par8)
}
if (par3 > 0) x <- diff(x,lag=1,difference=par3)
if (par4 > 0) x <- diff(x,lag=par5,difference=par4)
bitmap(file='picts.png')
op <- par(mfrow=c(2,1))
plot(ox,type='l',main='Original Time Series',xlab='time',ylab='value')
if (par8=='') {
mytitle <- paste('Working Time Series (lambda=',par2,', d=',par3,', D=',par4,')',sep='')
mysub <- paste('(lambda=',par2,', d=',par3,', D=',par4,', CI=', par7, ', CI type=',par6,')',sep='')
} else {
mytitle <- paste('Working Time Series (base=',par8,', d=',par3,', D=',par4,')',sep='')
mysub <- paste('(base=',par8,', d=',par3,', D=',par4,', CI=', par7, ', CI type=',par6,')',sep='')
}
plot(x,type='l', main=mytitle,xlab='time',ylab='value')
par(op)
dev.off()
bitmap(file='pic1.png')
racf <- acf(x, par1, main='Autocorrelation', xlab='time lag', ylab='ACF', ci.type=par6, ci=par7, sub=mysub)
dev.off()
bitmap(file='pic2.png')
rpacf <- pacf(x,par1,main='Partial Autocorrelation',xlab='lags',ylab='PACF',sub=mysub)
dev.off()
(myacf <- c(racf$acf))
(mypacf <- c(rpacf$acf))
lengthx <- length(x)
sqrtn <- sqrt(lengthx)
load(file='createtable')
a<-table.start()
a<-table.row.start(a)
a<-table.element(a,'Autocorrelation Function',4,TRUE)
a<-table.row.end(a)
a<-table.row.start(a)
a<-table.element(a,'Time lag k',header=TRUE)
a<-table.element(a,hyperlink('basics.htm','ACF(k)','click here for more information about the Autocorrelation Function'),header=TRUE)
a<-table.element(a,'T-STAT',header=TRUE)
a<-table.element(a,'P-value',header=TRUE)
a<-table.row.end(a)
for (i in 2:(par1+1)) {
a<-table.row.start(a)
a<-table.element(a,i-1,header=TRUE)
a<-table.element(a,round(myacf[i],6))
mytstat <- myacf[i]*sqrtn
a<-table.element(a,round(mytstat,4))
a<-table.element(a,round(1-pt(abs(mytstat),lengthx),6))
a<-table.row.end(a)
}
a<-table.end(a)
table.save(a,file='mytable.tab')
a<-table.start()
a<-table.row.start(a)
a<-table.element(a,'Partial Autocorrelation Function',4,TRUE)
a<-table.row.end(a)
a<-table.row.start(a)
a<-table.element(a,'Time lag k',header=TRUE)
a<-table.element(a,hyperlink('basics.htm','PACF(k)','click here for more information about the Partial Autocorrelation Function'),header=TRUE)
a<-table.element(a,'T-STAT',header=TRUE)
a<-table.element(a,'P-value',header=TRUE)
a<-table.row.end(a)
for (i in 1:par1) {
a<-table.row.start(a)
a<-table.element(a,i,header=TRUE)
a<-table.element(a,round(mypacf[i],6))
mytstat <- mypacf[i]*sqrtn
a<-table.element(a,round(mytstat,4))
a<-table.element(a,round(1-pt(abs(mytstat),lengthx),6))
a<-table.row.end(a)
}
a<-table.end(a)
table.save(a,file='mytable1.tab')