Free Statistics

of Irreproducible Research!

Author's title

Author*Unverified author*
R Software Modulerwasp_autocorrelation.wasp
Title produced by software(Partial) Autocorrelation Function
Date of computationThu, 22 Oct 2015 21:21:28 +0100
Cite this page as followsStatistical Computations at FreeStatistics.org, Office for Research Development and Education, URL https://freestatistics.org/blog/index.php?v=date/2015/Oct/22/t1445545346zq8soprumx18xvz.htm/, Retrieved Sat, 18 May 2024 20:58:19 +0000
Statistical Computations at FreeStatistics.org, Office for Research Development and Education, URL https://freestatistics.org/blog/index.php?pk=282800, Retrieved Sat, 18 May 2024 20:58:19 +0000
QR Codes:

Original text written by user:
IsPrivate?No (this computation is public)
User-defined keywords
Estimated Impact90
Family? (F = Feedback message, R = changed R code, M = changed R Module, P = changed Parameters, D = changed Data)
-       [(Partial) Autocorrelation Function] [] [2015-10-22 20:21:28] [e9dd6d750d12fbfd669e11323be8eb07] [Current]
Feedback Forum

Post a new message
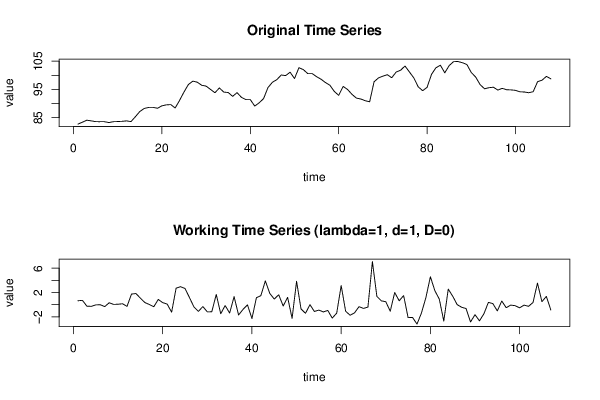
Dataseries X:
82.75
83.4
84.12
83.88
83.61
83.58
83.58
83.27
83.59
83.64
83.72
83.88
83.61
85.36
87.2
88.28
88.64
88.67
88.34
89.21
89.55
89.65
88.43
91.15
94.11
96.78
97.94
97.57
96.48
96.18
95
93.84
95.54
94.06
93.92
92.55
93.88
92.19
91.42
91.39
89.12
90.27
91.76
95.68
97.54
98.47
100.11
99.9
101.11
98.86
102.71
102.02
100.61
100.62
99.51
98.63
97.44
96.5
94.3
92.92
96.07
95
93.27
91.94
91.62
91.01
90.62
97.72
99.09
99.72
100.22
99.15
101.16
101.8
103.31
101.19
99.09
95.91
94.56
95.76
100.36
102.67
103.58
100.89
103.46
104.86
104.88
104.46
103.83
101
99.36
96.71
95.23
95.62
95.8
94.79
95.39
94.9
94.84
94.68
94.17
94.1
93.84
94.2
97.76
98.26
99.63
98.75


Summary of computational transaction
Raw Inputview raw input (R code)
Raw Outputview raw output of R engine
Computing time2 seconds
R Server'Sir Ronald Aylmer Fisher' @ fisher.wessa.net

\begin{tabular}{lllllllll}
\hline
Summary of computational transaction \tabularnewline
Raw Input & view raw input (R code)  \tabularnewline
Raw Output & view raw output of R engine  \tabularnewline
Computing time & 2 seconds \tabularnewline
R Server & 'Sir Ronald Aylmer Fisher' @ fisher.wessa.net \tabularnewline
\hline
\end{tabular}
%Source: https://freestatistics.org/blog/index.php?pk=282800&T=0

[TABLE]
[ROW][C]Summary of computational transaction[/C][/ROW]
[ROW][C]Raw Input[/C][C]view raw input (R code) [/C][/ROW]
[ROW][C]Raw Output[/C][C]view raw output of R engine [/C][/ROW]
[ROW][C]Computing time[/C][C]2 seconds[/C][/ROW]
[ROW][C]R Server[/C][C]'Sir Ronald Aylmer Fisher' @ fisher.wessa.net[/C][/ROW]
[/TABLE]
Source: https://freestatistics.org/blog/index.php?pk=282800&T=0

Globally Unique Identifier (entire table): ba.freestatistics.org/blog/index.php?pk=282800&T=0

As an alternative you can also use a QR Code:  

The GUIDs for individual cells are displayed in the table below:

Summary of computational transaction
Raw Inputview raw input (R code)
Raw Outputview raw output of R engine
Computing time2 seconds
R Server'Sir Ronald Aylmer Fisher' @ fisher.wessa.net


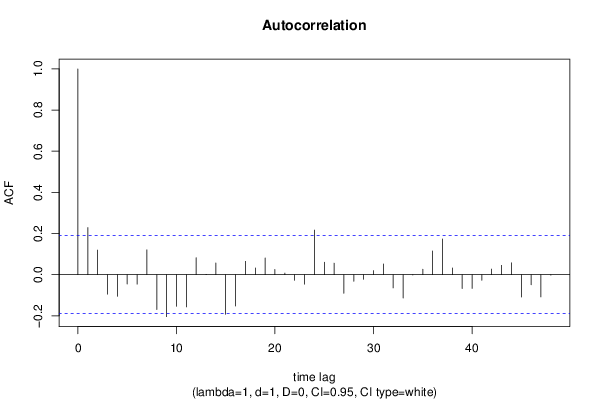
Autocorrelation Function
Time lag kACF(k)T-STATP-value
10.2287392.36610.009888
20.1195241.23640.109515
3-0.094752-0.98010.164619
4-0.104766-1.08370.140465
5-0.045115-0.46670.32084
6-0.046087-0.47670.317263
70.1204291.24570.107792
8-0.169259-1.75080.041421
9-0.204089-2.11110.018546
10-0.153495-1.58780.057645
11-0.156756-1.62150.053927
120.0818960.84710.199404
130.000650.00670.497324
140.056590.58540.279766
15-0.192415-1.99040.024551
16-0.152088-1.57320.059311
170.0647420.66970.252247
180.0321490.33260.370062
190.0814750.84280.200614
200.0252850.26150.397086
210.0076420.0790.468571
22-0.026927-0.27850.390569
23-0.046047-0.47630.317409
240.2167422.2420.013512
250.060370.62450.266824
260.0559680.57890.281925
27-0.090076-0.93180.176781
28-0.032062-0.33160.370402
29-0.022272-0.23040.409116
300.0196750.20350.41956
310.0516620.53440.297087
32-0.064294-0.66510.253719
33-0.113128-1.17020.12226
34-0.001665-0.01720.493145
350.0266230.27540.391772
360.1149571.18910.118512
370.1731431.7910.03806
380.032820.33950.367451
39-0.066888-0.69190.24525
40-0.066826-0.69130.245453
41-0.027422-0.28370.388611
420.0271710.28110.389605
430.0453110.46870.320119
440.0573560.59330.277117
45-0.108568-1.1230.131967
46-0.049139-0.50830.306147
47-0.108042-1.11760.13312
48-0.002378-0.02460.49021

\begin{tabular}{lllllllll}
\hline
Autocorrelation Function \tabularnewline
Time lag k & ACF(k) & T-STAT & P-value \tabularnewline
1 & 0.228739 & 2.3661 & 0.009888 \tabularnewline
2 & 0.119524 & 1.2364 & 0.109515 \tabularnewline
3 & -0.094752 & -0.9801 & 0.164619 \tabularnewline
4 & -0.104766 & -1.0837 & 0.140465 \tabularnewline
5 & -0.045115 & -0.4667 & 0.32084 \tabularnewline
6 & -0.046087 & -0.4767 & 0.317263 \tabularnewline
7 & 0.120429 & 1.2457 & 0.107792 \tabularnewline
8 & -0.169259 & -1.7508 & 0.041421 \tabularnewline
9 & -0.204089 & -2.1111 & 0.018546 \tabularnewline
10 & -0.153495 & -1.5878 & 0.057645 \tabularnewline
11 & -0.156756 & -1.6215 & 0.053927 \tabularnewline
12 & 0.081896 & 0.8471 & 0.199404 \tabularnewline
13 & 0.00065 & 0.0067 & 0.497324 \tabularnewline
14 & 0.05659 & 0.5854 & 0.279766 \tabularnewline
15 & -0.192415 & -1.9904 & 0.024551 \tabularnewline
16 & -0.152088 & -1.5732 & 0.059311 \tabularnewline
17 & 0.064742 & 0.6697 & 0.252247 \tabularnewline
18 & 0.032149 & 0.3326 & 0.370062 \tabularnewline
19 & 0.081475 & 0.8428 & 0.200614 \tabularnewline
20 & 0.025285 & 0.2615 & 0.397086 \tabularnewline
21 & 0.007642 & 0.079 & 0.468571 \tabularnewline
22 & -0.026927 & -0.2785 & 0.390569 \tabularnewline
23 & -0.046047 & -0.4763 & 0.317409 \tabularnewline
24 & 0.216742 & 2.242 & 0.013512 \tabularnewline
25 & 0.06037 & 0.6245 & 0.266824 \tabularnewline
26 & 0.055968 & 0.5789 & 0.281925 \tabularnewline
27 & -0.090076 & -0.9318 & 0.176781 \tabularnewline
28 & -0.032062 & -0.3316 & 0.370402 \tabularnewline
29 & -0.022272 & -0.2304 & 0.409116 \tabularnewline
30 & 0.019675 & 0.2035 & 0.41956 \tabularnewline
31 & 0.051662 & 0.5344 & 0.297087 \tabularnewline
32 & -0.064294 & -0.6651 & 0.253719 \tabularnewline
33 & -0.113128 & -1.1702 & 0.12226 \tabularnewline
34 & -0.001665 & -0.0172 & 0.493145 \tabularnewline
35 & 0.026623 & 0.2754 & 0.391772 \tabularnewline
36 & 0.114957 & 1.1891 & 0.118512 \tabularnewline
37 & 0.173143 & 1.791 & 0.03806 \tabularnewline
38 & 0.03282 & 0.3395 & 0.367451 \tabularnewline
39 & -0.066888 & -0.6919 & 0.24525 \tabularnewline
40 & -0.066826 & -0.6913 & 0.245453 \tabularnewline
41 & -0.027422 & -0.2837 & 0.388611 \tabularnewline
42 & 0.027171 & 0.2811 & 0.389605 \tabularnewline
43 & 0.045311 & 0.4687 & 0.320119 \tabularnewline
44 & 0.057356 & 0.5933 & 0.277117 \tabularnewline
45 & -0.108568 & -1.123 & 0.131967 \tabularnewline
46 & -0.049139 & -0.5083 & 0.306147 \tabularnewline
47 & -0.108042 & -1.1176 & 0.13312 \tabularnewline
48 & -0.002378 & -0.0246 & 0.49021 \tabularnewline
\hline
\end{tabular}
%Source: https://freestatistics.org/blog/index.php?pk=282800&T=1

[TABLE]
[ROW][C]Autocorrelation Function[/C][/ROW]
[ROW][C]Time lag k[/C][C]ACF(k)[/C][C]T-STAT[/C][C]P-value[/C][/ROW]
[ROW][C]1[/C][C]0.228739[/C][C]2.3661[/C][C]0.009888[/C][/ROW]
[ROW][C]2[/C][C]0.119524[/C][C]1.2364[/C][C]0.109515[/C][/ROW]
[ROW][C]3[/C][C]-0.094752[/C][C]-0.9801[/C][C]0.164619[/C][/ROW]
[ROW][C]4[/C][C]-0.104766[/C][C]-1.0837[/C][C]0.140465[/C][/ROW]
[ROW][C]5[/C][C]-0.045115[/C][C]-0.4667[/C][C]0.32084[/C][/ROW]
[ROW][C]6[/C][C]-0.046087[/C][C]-0.4767[/C][C]0.317263[/C][/ROW]
[ROW][C]7[/C][C]0.120429[/C][C]1.2457[/C][C]0.107792[/C][/ROW]
[ROW][C]8[/C][C]-0.169259[/C][C]-1.7508[/C][C]0.041421[/C][/ROW]
[ROW][C]9[/C][C]-0.204089[/C][C]-2.1111[/C][C]0.018546[/C][/ROW]
[ROW][C]10[/C][C]-0.153495[/C][C]-1.5878[/C][C]0.057645[/C][/ROW]
[ROW][C]11[/C][C]-0.156756[/C][C]-1.6215[/C][C]0.053927[/C][/ROW]
[ROW][C]12[/C][C]0.081896[/C][C]0.8471[/C][C]0.199404[/C][/ROW]
[ROW][C]13[/C][C]0.00065[/C][C]0.0067[/C][C]0.497324[/C][/ROW]
[ROW][C]14[/C][C]0.05659[/C][C]0.5854[/C][C]0.279766[/C][/ROW]
[ROW][C]15[/C][C]-0.192415[/C][C]-1.9904[/C][C]0.024551[/C][/ROW]
[ROW][C]16[/C][C]-0.152088[/C][C]-1.5732[/C][C]0.059311[/C][/ROW]
[ROW][C]17[/C][C]0.064742[/C][C]0.6697[/C][C]0.252247[/C][/ROW]
[ROW][C]18[/C][C]0.032149[/C][C]0.3326[/C][C]0.370062[/C][/ROW]
[ROW][C]19[/C][C]0.081475[/C][C]0.8428[/C][C]0.200614[/C][/ROW]
[ROW][C]20[/C][C]0.025285[/C][C]0.2615[/C][C]0.397086[/C][/ROW]
[ROW][C]21[/C][C]0.007642[/C][C]0.079[/C][C]0.468571[/C][/ROW]
[ROW][C]22[/C][C]-0.026927[/C][C]-0.2785[/C][C]0.390569[/C][/ROW]
[ROW][C]23[/C][C]-0.046047[/C][C]-0.4763[/C][C]0.317409[/C][/ROW]
[ROW][C]24[/C][C]0.216742[/C][C]2.242[/C][C]0.013512[/C][/ROW]
[ROW][C]25[/C][C]0.06037[/C][C]0.6245[/C][C]0.266824[/C][/ROW]
[ROW][C]26[/C][C]0.055968[/C][C]0.5789[/C][C]0.281925[/C][/ROW]
[ROW][C]27[/C][C]-0.090076[/C][C]-0.9318[/C][C]0.176781[/C][/ROW]
[ROW][C]28[/C][C]-0.032062[/C][C]-0.3316[/C][C]0.370402[/C][/ROW]
[ROW][C]29[/C][C]-0.022272[/C][C]-0.2304[/C][C]0.409116[/C][/ROW]
[ROW][C]30[/C][C]0.019675[/C][C]0.2035[/C][C]0.41956[/C][/ROW]
[ROW][C]31[/C][C]0.051662[/C][C]0.5344[/C][C]0.297087[/C][/ROW]
[ROW][C]32[/C][C]-0.064294[/C][C]-0.6651[/C][C]0.253719[/C][/ROW]
[ROW][C]33[/C][C]-0.113128[/C][C]-1.1702[/C][C]0.12226[/C][/ROW]
[ROW][C]34[/C][C]-0.001665[/C][C]-0.0172[/C][C]0.493145[/C][/ROW]
[ROW][C]35[/C][C]0.026623[/C][C]0.2754[/C][C]0.391772[/C][/ROW]
[ROW][C]36[/C][C]0.114957[/C][C]1.1891[/C][C]0.118512[/C][/ROW]
[ROW][C]37[/C][C]0.173143[/C][C]1.791[/C][C]0.03806[/C][/ROW]
[ROW][C]38[/C][C]0.03282[/C][C]0.3395[/C][C]0.367451[/C][/ROW]
[ROW][C]39[/C][C]-0.066888[/C][C]-0.6919[/C][C]0.24525[/C][/ROW]
[ROW][C]40[/C][C]-0.066826[/C][C]-0.6913[/C][C]0.245453[/C][/ROW]
[ROW][C]41[/C][C]-0.027422[/C][C]-0.2837[/C][C]0.388611[/C][/ROW]
[ROW][C]42[/C][C]0.027171[/C][C]0.2811[/C][C]0.389605[/C][/ROW]
[ROW][C]43[/C][C]0.045311[/C][C]0.4687[/C][C]0.320119[/C][/ROW]
[ROW][C]44[/C][C]0.057356[/C][C]0.5933[/C][C]0.277117[/C][/ROW]
[ROW][C]45[/C][C]-0.108568[/C][C]-1.123[/C][C]0.131967[/C][/ROW]
[ROW][C]46[/C][C]-0.049139[/C][C]-0.5083[/C][C]0.306147[/C][/ROW]
[ROW][C]47[/C][C]-0.108042[/C][C]-1.1176[/C][C]0.13312[/C][/ROW]
[ROW][C]48[/C][C]-0.002378[/C][C]-0.0246[/C][C]0.49021[/C][/ROW]
[/TABLE]
Source: https://freestatistics.org/blog/index.php?pk=282800&T=1

Globally Unique Identifier (entire table): ba.freestatistics.org/blog/index.php?pk=282800&T=1

As an alternative you can also use a QR Code:  

The GUIDs for individual cells are displayed in the table below:

Autocorrelation Function
Time lag kACF(k)T-STATP-value
10.2287392.36610.009888
20.1195241.23640.109515
3-0.094752-0.98010.164619
4-0.104766-1.08370.140465
5-0.045115-0.46670.32084
6-0.046087-0.47670.317263
70.1204291.24570.107792
8-0.169259-1.75080.041421
9-0.204089-2.11110.018546
10-0.153495-1.58780.057645
11-0.156756-1.62150.053927
120.0818960.84710.199404
130.000650.00670.497324
140.056590.58540.279766
15-0.192415-1.99040.024551
16-0.152088-1.57320.059311
170.0647420.66970.252247
180.0321490.33260.370062
190.0814750.84280.200614
200.0252850.26150.397086
210.0076420.0790.468571
22-0.026927-0.27850.390569
23-0.046047-0.47630.317409
240.2167422.2420.013512
250.060370.62450.266824
260.0559680.57890.281925
27-0.090076-0.93180.176781
28-0.032062-0.33160.370402
29-0.022272-0.23040.409116
300.0196750.20350.41956
310.0516620.53440.297087
32-0.064294-0.66510.253719
33-0.113128-1.17020.12226
34-0.001665-0.01720.493145
350.0266230.27540.391772
360.1149571.18910.118512
370.1731431.7910.03806
380.032820.33950.367451
39-0.066888-0.69190.24525
40-0.066826-0.69130.245453
41-0.027422-0.28370.388611
420.0271710.28110.389605
430.0453110.46870.320119
440.0573560.59330.277117
45-0.108568-1.1230.131967
46-0.049139-0.50830.306147
47-0.108042-1.11760.13312
48-0.002378-0.02460.49021


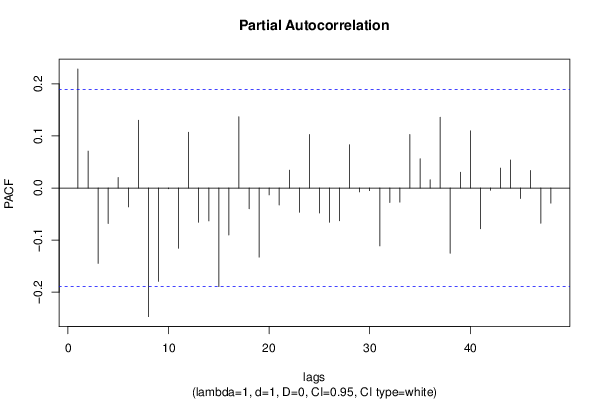
Partial Autocorrelation Function
Time lag kPACF(k)T-STATP-value
10.2287392.36610.009888
20.0709130.73350.232421
3-0.14463-1.49610.06879
4-0.067943-0.70280.24185
50.0201310.20820.417719
6-0.036166-0.37410.354533
70.1301791.34660.090481
8-0.246985-2.55480.006015
9-0.179235-1.8540.033245
10-0.001524-0.01580.493725
11-0.115532-1.19510.117351
120.1071971.10890.13499
13-0.065757-0.68020.248926
14-0.063022-0.65190.257929
15-0.189304-1.95820.026406
16-0.090337-0.93450.176086
170.1370341.41750.079623
18-0.039761-0.41130.34084
19-0.132699-1.37260.086367
20-0.013085-0.13540.446293
21-0.032687-0.33810.367969
220.0343710.35550.361444
23-0.046604-0.48210.315367
240.1027511.06290.145119
25-0.047968-0.49620.31039
26-0.065554-0.67810.249588
27-0.062967-0.65130.258112
280.0831690.86030.195771
29-0.007398-0.07650.469571
30-0.004914-0.05080.479777
31-0.111051-1.14870.126617
32-0.027627-0.28580.387801
33-0.027063-0.27990.390033
340.1028431.06380.144904
350.0562670.5820.280886
360.0159670.16520.434565
370.1360021.40680.08119
38-0.125249-1.29560.098953
390.0302780.31320.377371
400.1098831.13660.129115
41-0.078163-0.80850.210291
42-0.004086-0.04230.483182
430.0383560.39680.346167
440.0540350.55890.288686
45-0.02022-0.20920.417363
460.0337330.34890.363912
47-0.067646-0.69970.242806
48-0.029014-0.30010.382333

\begin{tabular}{lllllllll}
\hline
Partial Autocorrelation Function \tabularnewline
Time lag k & PACF(k) & T-STAT & P-value \tabularnewline
1 & 0.228739 & 2.3661 & 0.009888 \tabularnewline
2 & 0.070913 & 0.7335 & 0.232421 \tabularnewline
3 & -0.14463 & -1.4961 & 0.06879 \tabularnewline
4 & -0.067943 & -0.7028 & 0.24185 \tabularnewline
5 & 0.020131 & 0.2082 & 0.417719 \tabularnewline
6 & -0.036166 & -0.3741 & 0.354533 \tabularnewline
7 & 0.130179 & 1.3466 & 0.090481 \tabularnewline
8 & -0.246985 & -2.5548 & 0.006015 \tabularnewline
9 & -0.179235 & -1.854 & 0.033245 \tabularnewline
10 & -0.001524 & -0.0158 & 0.493725 \tabularnewline
11 & -0.115532 & -1.1951 & 0.117351 \tabularnewline
12 & 0.107197 & 1.1089 & 0.13499 \tabularnewline
13 & -0.065757 & -0.6802 & 0.248926 \tabularnewline
14 & -0.063022 & -0.6519 & 0.257929 \tabularnewline
15 & -0.189304 & -1.9582 & 0.026406 \tabularnewline
16 & -0.090337 & -0.9345 & 0.176086 \tabularnewline
17 & 0.137034 & 1.4175 & 0.079623 \tabularnewline
18 & -0.039761 & -0.4113 & 0.34084 \tabularnewline
19 & -0.132699 & -1.3726 & 0.086367 \tabularnewline
20 & -0.013085 & -0.1354 & 0.446293 \tabularnewline
21 & -0.032687 & -0.3381 & 0.367969 \tabularnewline
22 & 0.034371 & 0.3555 & 0.361444 \tabularnewline
23 & -0.046604 & -0.4821 & 0.315367 \tabularnewline
24 & 0.102751 & 1.0629 & 0.145119 \tabularnewline
25 & -0.047968 & -0.4962 & 0.31039 \tabularnewline
26 & -0.065554 & -0.6781 & 0.249588 \tabularnewline
27 & -0.062967 & -0.6513 & 0.258112 \tabularnewline
28 & 0.083169 & 0.8603 & 0.195771 \tabularnewline
29 & -0.007398 & -0.0765 & 0.469571 \tabularnewline
30 & -0.004914 & -0.0508 & 0.479777 \tabularnewline
31 & -0.111051 & -1.1487 & 0.126617 \tabularnewline
32 & -0.027627 & -0.2858 & 0.387801 \tabularnewline
33 & -0.027063 & -0.2799 & 0.390033 \tabularnewline
34 & 0.102843 & 1.0638 & 0.144904 \tabularnewline
35 & 0.056267 & 0.582 & 0.280886 \tabularnewline
36 & 0.015967 & 0.1652 & 0.434565 \tabularnewline
37 & 0.136002 & 1.4068 & 0.08119 \tabularnewline
38 & -0.125249 & -1.2956 & 0.098953 \tabularnewline
39 & 0.030278 & 0.3132 & 0.377371 \tabularnewline
40 & 0.109883 & 1.1366 & 0.129115 \tabularnewline
41 & -0.078163 & -0.8085 & 0.210291 \tabularnewline
42 & -0.004086 & -0.0423 & 0.483182 \tabularnewline
43 & 0.038356 & 0.3968 & 0.346167 \tabularnewline
44 & 0.054035 & 0.5589 & 0.288686 \tabularnewline
45 & -0.02022 & -0.2092 & 0.417363 \tabularnewline
46 & 0.033733 & 0.3489 & 0.363912 \tabularnewline
47 & -0.067646 & -0.6997 & 0.242806 \tabularnewline
48 & -0.029014 & -0.3001 & 0.382333 \tabularnewline
\hline
\end{tabular}
%Source: https://freestatistics.org/blog/index.php?pk=282800&T=2

[TABLE]
[ROW][C]Partial Autocorrelation Function[/C][/ROW]
[ROW][C]Time lag k[/C][C]PACF(k)[/C][C]T-STAT[/C][C]P-value[/C][/ROW]
[ROW][C]1[/C][C]0.228739[/C][C]2.3661[/C][C]0.009888[/C][/ROW]
[ROW][C]2[/C][C]0.070913[/C][C]0.7335[/C][C]0.232421[/C][/ROW]
[ROW][C]3[/C][C]-0.14463[/C][C]-1.4961[/C][C]0.06879[/C][/ROW]
[ROW][C]4[/C][C]-0.067943[/C][C]-0.7028[/C][C]0.24185[/C][/ROW]
[ROW][C]5[/C][C]0.020131[/C][C]0.2082[/C][C]0.417719[/C][/ROW]
[ROW][C]6[/C][C]-0.036166[/C][C]-0.3741[/C][C]0.354533[/C][/ROW]
[ROW][C]7[/C][C]0.130179[/C][C]1.3466[/C][C]0.090481[/C][/ROW]
[ROW][C]8[/C][C]-0.246985[/C][C]-2.5548[/C][C]0.006015[/C][/ROW]
[ROW][C]9[/C][C]-0.179235[/C][C]-1.854[/C][C]0.033245[/C][/ROW]
[ROW][C]10[/C][C]-0.001524[/C][C]-0.0158[/C][C]0.493725[/C][/ROW]
[ROW][C]11[/C][C]-0.115532[/C][C]-1.1951[/C][C]0.117351[/C][/ROW]
[ROW][C]12[/C][C]0.107197[/C][C]1.1089[/C][C]0.13499[/C][/ROW]
[ROW][C]13[/C][C]-0.065757[/C][C]-0.6802[/C][C]0.248926[/C][/ROW]
[ROW][C]14[/C][C]-0.063022[/C][C]-0.6519[/C][C]0.257929[/C][/ROW]
[ROW][C]15[/C][C]-0.189304[/C][C]-1.9582[/C][C]0.026406[/C][/ROW]
[ROW][C]16[/C][C]-0.090337[/C][C]-0.9345[/C][C]0.176086[/C][/ROW]
[ROW][C]17[/C][C]0.137034[/C][C]1.4175[/C][C]0.079623[/C][/ROW]
[ROW][C]18[/C][C]-0.039761[/C][C]-0.4113[/C][C]0.34084[/C][/ROW]
[ROW][C]19[/C][C]-0.132699[/C][C]-1.3726[/C][C]0.086367[/C][/ROW]
[ROW][C]20[/C][C]-0.013085[/C][C]-0.1354[/C][C]0.446293[/C][/ROW]
[ROW][C]21[/C][C]-0.032687[/C][C]-0.3381[/C][C]0.367969[/C][/ROW]
[ROW][C]22[/C][C]0.034371[/C][C]0.3555[/C][C]0.361444[/C][/ROW]
[ROW][C]23[/C][C]-0.046604[/C][C]-0.4821[/C][C]0.315367[/C][/ROW]
[ROW][C]24[/C][C]0.102751[/C][C]1.0629[/C][C]0.145119[/C][/ROW]
[ROW][C]25[/C][C]-0.047968[/C][C]-0.4962[/C][C]0.31039[/C][/ROW]
[ROW][C]26[/C][C]-0.065554[/C][C]-0.6781[/C][C]0.249588[/C][/ROW]
[ROW][C]27[/C][C]-0.062967[/C][C]-0.6513[/C][C]0.258112[/C][/ROW]
[ROW][C]28[/C][C]0.083169[/C][C]0.8603[/C][C]0.195771[/C][/ROW]
[ROW][C]29[/C][C]-0.007398[/C][C]-0.0765[/C][C]0.469571[/C][/ROW]
[ROW][C]30[/C][C]-0.004914[/C][C]-0.0508[/C][C]0.479777[/C][/ROW]
[ROW][C]31[/C][C]-0.111051[/C][C]-1.1487[/C][C]0.126617[/C][/ROW]
[ROW][C]32[/C][C]-0.027627[/C][C]-0.2858[/C][C]0.387801[/C][/ROW]
[ROW][C]33[/C][C]-0.027063[/C][C]-0.2799[/C][C]0.390033[/C][/ROW]
[ROW][C]34[/C][C]0.102843[/C][C]1.0638[/C][C]0.144904[/C][/ROW]
[ROW][C]35[/C][C]0.056267[/C][C]0.582[/C][C]0.280886[/C][/ROW]
[ROW][C]36[/C][C]0.015967[/C][C]0.1652[/C][C]0.434565[/C][/ROW]
[ROW][C]37[/C][C]0.136002[/C][C]1.4068[/C][C]0.08119[/C][/ROW]
[ROW][C]38[/C][C]-0.125249[/C][C]-1.2956[/C][C]0.098953[/C][/ROW]
[ROW][C]39[/C][C]0.030278[/C][C]0.3132[/C][C]0.377371[/C][/ROW]
[ROW][C]40[/C][C]0.109883[/C][C]1.1366[/C][C]0.129115[/C][/ROW]
[ROW][C]41[/C][C]-0.078163[/C][C]-0.8085[/C][C]0.210291[/C][/ROW]
[ROW][C]42[/C][C]-0.004086[/C][C]-0.0423[/C][C]0.483182[/C][/ROW]
[ROW][C]43[/C][C]0.038356[/C][C]0.3968[/C][C]0.346167[/C][/ROW]
[ROW][C]44[/C][C]0.054035[/C][C]0.5589[/C][C]0.288686[/C][/ROW]
[ROW][C]45[/C][C]-0.02022[/C][C]-0.2092[/C][C]0.417363[/C][/ROW]
[ROW][C]46[/C][C]0.033733[/C][C]0.3489[/C][C]0.363912[/C][/ROW]
[ROW][C]47[/C][C]-0.067646[/C][C]-0.6997[/C][C]0.242806[/C][/ROW]
[ROW][C]48[/C][C]-0.029014[/C][C]-0.3001[/C][C]0.382333[/C][/ROW]
[/TABLE]
Source: https://freestatistics.org/blog/index.php?pk=282800&T=2

Globally Unique Identifier (entire table): ba.freestatistics.org/blog/index.php?pk=282800&T=2

As an alternative you can also use a QR Code:  

The GUIDs for individual cells are displayed in the table below:

Partial Autocorrelation Function
Time lag kPACF(k)T-STATP-value
10.2287392.36610.009888
20.0709130.73350.232421
3-0.14463-1.49610.06879
4-0.067943-0.70280.24185
50.0201310.20820.417719
6-0.036166-0.37410.354533
70.1301791.34660.090481
8-0.246985-2.55480.006015
9-0.179235-1.8540.033245
10-0.001524-0.01580.493725
11-0.115532-1.19510.117351
120.1071971.10890.13499
13-0.065757-0.68020.248926
14-0.063022-0.65190.257929
15-0.189304-1.95820.026406
16-0.090337-0.93450.176086
170.1370341.41750.079623
18-0.039761-0.41130.34084
19-0.132699-1.37260.086367
20-0.013085-0.13540.446293
21-0.032687-0.33810.367969
220.0343710.35550.361444
23-0.046604-0.48210.315367
240.1027511.06290.145119
25-0.047968-0.49620.31039
26-0.065554-0.67810.249588
27-0.062967-0.65130.258112
280.0831690.86030.195771
29-0.007398-0.07650.469571
30-0.004914-0.05080.479777
31-0.111051-1.14870.126617
32-0.027627-0.28580.387801
33-0.027063-0.27990.390033
340.1028431.06380.144904
350.0562670.5820.280886
360.0159670.16520.434565
370.1360021.40680.08119
38-0.125249-1.29560.098953
390.0302780.31320.377371
400.1098831.13660.129115
41-0.078163-0.80850.210291
42-0.004086-0.04230.483182
430.0383560.39680.346167
440.0540350.55890.288686
45-0.02022-0.20920.417363
460.0337330.34890.363912
47-0.067646-0.69970.242806
48-0.029014-0.30010.382333


Parameters (Session):
par1 = 48 ; par2 = 1 ; par3 = 1 ; par4 = 0 ; par5 = 12 ; par6 = White Noise ; par7 = 0.95 ;
Parameters (R input):
par1 = 48 ; par2 = 1 ; par3 = 1 ; par4 = 0 ; par5 = 12 ; par6 = White Noise ; par7 = 0.95 ; par8 = ;
R code (references can be found in the software module):
par8 <- ''
par7 <- '0.95'
par6 <- 'White Noise'
par5 <- '12'
par4 <- '0'
par3 <- '0'
par2 <- '1'
par1 <- '48'
if (par1 == 'Default') {
par1 = 10*log10(length(x))
} else {
par1 <- as.numeric(par1)
}
par2 <- as.numeric(par2)
par3 <- as.numeric(par3)
par4 <- as.numeric(par4)
par5 <- as.numeric(par5)
if (par6 == 'White Noise') par6 <- 'white' else par6 <- 'ma'
par7 <- as.numeric(par7)
if (par8 != '') par8 <- as.numeric(par8)
ox <- x
if (par8 == '') {
if (par2 == 0) {
x <- log(x)
} else {
x <- (x ^ par2 - 1) / par2
}
} else {
x <- log(x,base=par8)
}
if (par3 > 0) x <- diff(x,lag=1,difference=par3)
if (par4 > 0) x <- diff(x,lag=par5,difference=par4)
bitmap(file='picts.png')
op <- par(mfrow=c(2,1))
plot(ox,type='l',main='Original Time Series',xlab='time',ylab='value')
if (par8=='') {
mytitle <- paste('Working Time Series (lambda=',par2,', d=',par3,', D=',par4,')',sep='')
mysub <- paste('(lambda=',par2,', d=',par3,', D=',par4,', CI=', par7, ', CI type=',par6,')',sep='')
} else {
mytitle <- paste('Working Time Series (base=',par8,', d=',par3,', D=',par4,')',sep='')
mysub <- paste('(base=',par8,', d=',par3,', D=',par4,', CI=', par7, ', CI type=',par6,')',sep='')
}
plot(x,type='l', main=mytitle,xlab='time',ylab='value')
par(op)
dev.off()
bitmap(file='pic1.png')
racf <- acf(x, par1, main='Autocorrelation', xlab='time lag', ylab='ACF', ci.type=par6, ci=par7, sub=mysub)
dev.off()
bitmap(file='pic2.png')
rpacf <- pacf(x,par1,main='Partial Autocorrelation',xlab='lags',ylab='PACF',sub=mysub)
dev.off()
(myacf <- c(racf$acf))
(mypacf <- c(rpacf$acf))
lengthx <- length(x)
sqrtn <- sqrt(lengthx)
load(file='createtable')
a<-table.start()
a<-table.row.start(a)
a<-table.element(a,'Autocorrelation Function',4,TRUE)
a<-table.row.end(a)
a<-table.row.start(a)
a<-table.element(a,'Time lag k',header=TRUE)
a<-table.element(a,hyperlink('basics.htm','ACF(k)','click here for more information about the Autocorrelation Function'),header=TRUE)
a<-table.element(a,'T-STAT',header=TRUE)
a<-table.element(a,'P-value',header=TRUE)
a<-table.row.end(a)
for (i in 2:(par1+1)) {
a<-table.row.start(a)
a<-table.element(a,i-1,header=TRUE)
a<-table.element(a,round(myacf[i],6))
mytstat <- myacf[i]*sqrtn
a<-table.element(a,round(mytstat,4))
a<-table.element(a,round(1-pt(abs(mytstat),lengthx),6))
a<-table.row.end(a)
}
a<-table.end(a)
table.save(a,file='mytable.tab')
a<-table.start()
a<-table.row.start(a)
a<-table.element(a,'Partial Autocorrelation Function',4,TRUE)
a<-table.row.end(a)
a<-table.row.start(a)
a<-table.element(a,'Time lag k',header=TRUE)
a<-table.element(a,hyperlink('basics.htm','PACF(k)','click here for more information about the Partial Autocorrelation Function'),header=TRUE)
a<-table.element(a,'T-STAT',header=TRUE)
a<-table.element(a,'P-value',header=TRUE)
a<-table.row.end(a)
for (i in 1:par1) {
a<-table.row.start(a)
a<-table.element(a,i,header=TRUE)
a<-table.element(a,round(mypacf[i],6))
mytstat <- mypacf[i]*sqrtn
a<-table.element(a,round(mytstat,4))
a<-table.element(a,round(1-pt(abs(mytstat),lengthx),6))
a<-table.row.end(a)
}
a<-table.end(a)
table.save(a,file='mytable1.tab')