Free Statistics

of Irreproducible Research!

Author's title

Author*Unverified author*
R Software Modulerwasp_autocorrelation.wasp
Title produced by software(Partial) Autocorrelation Function
Date of computationThu, 22 Oct 2015 21:17:48 +0100
Cite this page as followsStatistical Computations at FreeStatistics.org, Office for Research Development and Education, URL https://freestatistics.org/blog/index.php?v=date/2015/Oct/22/t14455451400njoh9pu8xt1g75.htm/, Retrieved Sat, 18 May 2024 20:20:27 +0000
Statistical Computations at FreeStatistics.org, Office for Research Development and Education, URL https://freestatistics.org/blog/index.php?pk=282799, Retrieved Sat, 18 May 2024 20:20:27 +0000
QR Codes:

Original text written by user:
IsPrivate?No (this computation is public)
User-defined keywords
Estimated Impact97
Family? (F = Feedback message, R = changed R code, M = changed R Module, P = changed Parameters, D = changed Data)
-       [(Partial) Autocorrelation Function] [] [2015-10-22 20:17:48] [e9dd6d750d12fbfd669e11323be8eb07] [Current]
Feedback Forum

Post a new message
Dataseries X:
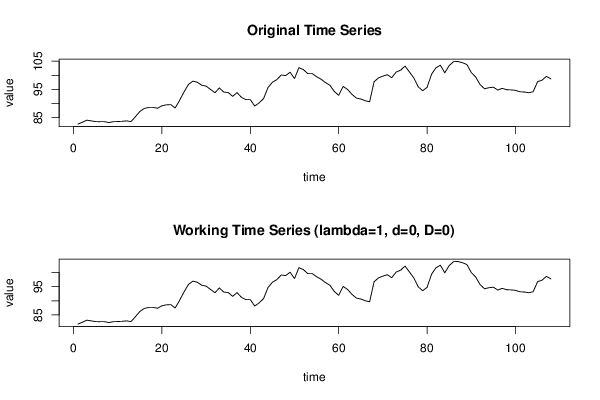
82,75
83,4
84,12
83,88
83,61
83,58
83,58
83,27
83,59
83,64
83,72
83,88
83,61
85,36
87,2
88,28
88,64
88,67
88,34
89,21
89,55
89,65
88,43
91,15
94,11
96,78
97,94
97,57
96,48
96,18
95
93,84
95,54
94,06
93,92
92,55
93,88
92,19
91,42
91,39
89,12
90,27
91,76
95,68
97,54
98,47
100,11
99,9
101,11
98,86
102,71
102,02
100,61
100,62
99,51
98,63
97,44
96,5
94,3
92,92
96,07
95
93,27
91,94
91,62
91,01
90,62
97,72
99,09
99,72
100,22
99,15
101,16
101,8
103,31
101,19
99,09
95,91
94,56
95,76
100,36
102,67
103,58
100,89
103,46
104,86
104,88
104,46
103,83
101
99,36
96,71
95,23
95,62
95,8
94,79
95,39
94,9
94,84
94,68
94,17
94,1
93,84
94,2
97,76
98,26
99,63
98,75


Summary of computational transaction
Raw Inputview raw input (R code)
Raw Outputview raw output of R engine
Computing time1 seconds
R Server'Herman Ole Andreas Wold' @ wold.wessa.net

\begin{tabular}{lllllllll}
\hline
Summary of computational transaction \tabularnewline
Raw Input & view raw input (R code)  \tabularnewline
Raw Output & view raw output of R engine  \tabularnewline
Computing time & 1 seconds \tabularnewline
R Server & 'Herman Ole Andreas Wold' @ wold.wessa.net \tabularnewline
\hline
\end{tabular}
%Source: https://freestatistics.org/blog/index.php?pk=282799&T=0

[TABLE]
[ROW][C]Summary of computational transaction[/C][/ROW]
[ROW][C]Raw Input[/C][C]view raw input (R code) [/C][/ROW]
[ROW][C]Raw Output[/C][C]view raw output of R engine [/C][/ROW]
[ROW][C]Computing time[/C][C]1 seconds[/C][/ROW]
[ROW][C]R Server[/C][C]'Herman Ole Andreas Wold' @ wold.wessa.net[/C][/ROW]
[/TABLE]
Source: https://freestatistics.org/blog/index.php?pk=282799&T=0

Globally Unique Identifier (entire table): ba.freestatistics.org/blog/index.php?pk=282799&T=0

As an alternative you can also use a QR Code:  

The GUIDs for individual cells are displayed in the table below:

Summary of computational transaction
Raw Inputview raw input (R code)
Raw Outputview raw output of R engine
Computing time1 seconds
R Server'Herman Ole Andreas Wold' @ wold.wessa.net


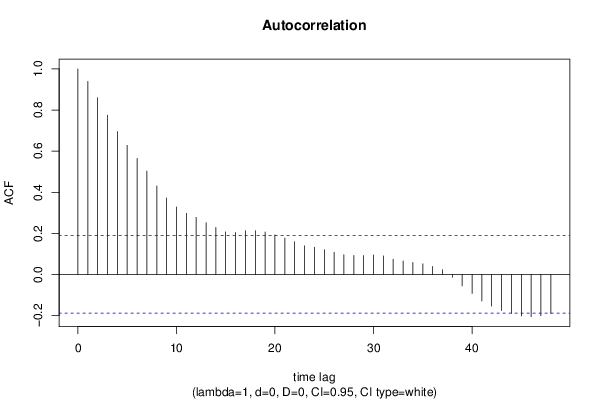
Autocorrelation Function
Time lag kACF(k)T-STATP-value
10.9387439.75570
20.8597138.93440
30.7743968.04780
40.6958397.23140
50.6282596.52910
60.5641325.86260
70.5029295.22660
80.4305994.47491e-05
90.3717013.86289.6e-05
100.3285273.41420.000451
110.2972513.08910.001276
120.2778912.88790.002343
130.25132.61160.005147
140.2286022.37570.009639
150.2070252.15150.016834
160.2042592.12270.018031
170.2126842.21030.014598
180.2125852.20920.014634
190.2064472.14550.017078
200.1927542.00320.023833
210.1767141.83650.03452
220.1591821.65430.050489
230.1391491.44610.075525
240.1323451.37540.085932
250.1201251.24840.107297
260.1081811.12420.1317
270.0961310.9990.160008
280.0923610.95980.16964
290.0926360.96270.168923
300.0949520.98680.16298
310.0902410.93780.175217
320.0738130.76710.222351
330.065160.67720.249874
340.0578930.60160.274336
350.0514670.53490.296923
360.0387240.40240.344083
370.0228560.23750.40635
38-0.013892-0.14440.442739
39-0.055705-0.57890.281931
40-0.092133-0.95750.170234
41-0.12952-1.3460.090559
42-0.153465-1.59490.056833
43-0.175492-1.82380.035476
44-0.189441-1.96870.025773
45-0.20244-2.10380.018858
46-0.205376-2.13430.017539
47-0.201178-2.09070.019451
48-0.190361-1.97830.025222

\begin{tabular}{lllllllll}
\hline
Autocorrelation Function \tabularnewline
Time lag k & ACF(k) & T-STAT & P-value \tabularnewline
1 & 0.938743 & 9.7557 & 0 \tabularnewline
2 & 0.859713 & 8.9344 & 0 \tabularnewline
3 & 0.774396 & 8.0478 & 0 \tabularnewline
4 & 0.695839 & 7.2314 & 0 \tabularnewline
5 & 0.628259 & 6.5291 & 0 \tabularnewline
6 & 0.564132 & 5.8626 & 0 \tabularnewline
7 & 0.502929 & 5.2266 & 0 \tabularnewline
8 & 0.430599 & 4.4749 & 1e-05 \tabularnewline
9 & 0.371701 & 3.8628 & 9.6e-05 \tabularnewline
10 & 0.328527 & 3.4142 & 0.000451 \tabularnewline
11 & 0.297251 & 3.0891 & 0.001276 \tabularnewline
12 & 0.277891 & 2.8879 & 0.002343 \tabularnewline
13 & 0.2513 & 2.6116 & 0.005147 \tabularnewline
14 & 0.228602 & 2.3757 & 0.009639 \tabularnewline
15 & 0.207025 & 2.1515 & 0.016834 \tabularnewline
16 & 0.204259 & 2.1227 & 0.018031 \tabularnewline
17 & 0.212684 & 2.2103 & 0.014598 \tabularnewline
18 & 0.212585 & 2.2092 & 0.014634 \tabularnewline
19 & 0.206447 & 2.1455 & 0.017078 \tabularnewline
20 & 0.192754 & 2.0032 & 0.023833 \tabularnewline
21 & 0.176714 & 1.8365 & 0.03452 \tabularnewline
22 & 0.159182 & 1.6543 & 0.050489 \tabularnewline
23 & 0.139149 & 1.4461 & 0.075525 \tabularnewline
24 & 0.132345 & 1.3754 & 0.085932 \tabularnewline
25 & 0.120125 & 1.2484 & 0.107297 \tabularnewline
26 & 0.108181 & 1.1242 & 0.1317 \tabularnewline
27 & 0.096131 & 0.999 & 0.160008 \tabularnewline
28 & 0.092361 & 0.9598 & 0.16964 \tabularnewline
29 & 0.092636 & 0.9627 & 0.168923 \tabularnewline
30 & 0.094952 & 0.9868 & 0.16298 \tabularnewline
31 & 0.090241 & 0.9378 & 0.175217 \tabularnewline
32 & 0.073813 & 0.7671 & 0.222351 \tabularnewline
33 & 0.06516 & 0.6772 & 0.249874 \tabularnewline
34 & 0.057893 & 0.6016 & 0.274336 \tabularnewline
35 & 0.051467 & 0.5349 & 0.296923 \tabularnewline
36 & 0.038724 & 0.4024 & 0.344083 \tabularnewline
37 & 0.022856 & 0.2375 & 0.40635 \tabularnewline
38 & -0.013892 & -0.1444 & 0.442739 \tabularnewline
39 & -0.055705 & -0.5789 & 0.281931 \tabularnewline
40 & -0.092133 & -0.9575 & 0.170234 \tabularnewline
41 & -0.12952 & -1.346 & 0.090559 \tabularnewline
42 & -0.153465 & -1.5949 & 0.056833 \tabularnewline
43 & -0.175492 & -1.8238 & 0.035476 \tabularnewline
44 & -0.189441 & -1.9687 & 0.025773 \tabularnewline
45 & -0.20244 & -2.1038 & 0.018858 \tabularnewline
46 & -0.205376 & -2.1343 & 0.017539 \tabularnewline
47 & -0.201178 & -2.0907 & 0.019451 \tabularnewline
48 & -0.190361 & -1.9783 & 0.025222 \tabularnewline
\hline
\end{tabular}
%Source: https://freestatistics.org/blog/index.php?pk=282799&T=1

[TABLE]
[ROW][C]Autocorrelation Function[/C][/ROW]
[ROW][C]Time lag k[/C][C]ACF(k)[/C][C]T-STAT[/C][C]P-value[/C][/ROW]
[ROW][C]1[/C][C]0.938743[/C][C]9.7557[/C][C]0[/C][/ROW]
[ROW][C]2[/C][C]0.859713[/C][C]8.9344[/C][C]0[/C][/ROW]
[ROW][C]3[/C][C]0.774396[/C][C]8.0478[/C][C]0[/C][/ROW]
[ROW][C]4[/C][C]0.695839[/C][C]7.2314[/C][C]0[/C][/ROW]
[ROW][C]5[/C][C]0.628259[/C][C]6.5291[/C][C]0[/C][/ROW]
[ROW][C]6[/C][C]0.564132[/C][C]5.8626[/C][C]0[/C][/ROW]
[ROW][C]7[/C][C]0.502929[/C][C]5.2266[/C][C]0[/C][/ROW]
[ROW][C]8[/C][C]0.430599[/C][C]4.4749[/C][C]1e-05[/C][/ROW]
[ROW][C]9[/C][C]0.371701[/C][C]3.8628[/C][C]9.6e-05[/C][/ROW]
[ROW][C]10[/C][C]0.328527[/C][C]3.4142[/C][C]0.000451[/C][/ROW]
[ROW][C]11[/C][C]0.297251[/C][C]3.0891[/C][C]0.001276[/C][/ROW]
[ROW][C]12[/C][C]0.277891[/C][C]2.8879[/C][C]0.002343[/C][/ROW]
[ROW][C]13[/C][C]0.2513[/C][C]2.6116[/C][C]0.005147[/C][/ROW]
[ROW][C]14[/C][C]0.228602[/C][C]2.3757[/C][C]0.009639[/C][/ROW]
[ROW][C]15[/C][C]0.207025[/C][C]2.1515[/C][C]0.016834[/C][/ROW]
[ROW][C]16[/C][C]0.204259[/C][C]2.1227[/C][C]0.018031[/C][/ROW]
[ROW][C]17[/C][C]0.212684[/C][C]2.2103[/C][C]0.014598[/C][/ROW]
[ROW][C]18[/C][C]0.212585[/C][C]2.2092[/C][C]0.014634[/C][/ROW]
[ROW][C]19[/C][C]0.206447[/C][C]2.1455[/C][C]0.017078[/C][/ROW]
[ROW][C]20[/C][C]0.192754[/C][C]2.0032[/C][C]0.023833[/C][/ROW]
[ROW][C]21[/C][C]0.176714[/C][C]1.8365[/C][C]0.03452[/C][/ROW]
[ROW][C]22[/C][C]0.159182[/C][C]1.6543[/C][C]0.050489[/C][/ROW]
[ROW][C]23[/C][C]0.139149[/C][C]1.4461[/C][C]0.075525[/C][/ROW]
[ROW][C]24[/C][C]0.132345[/C][C]1.3754[/C][C]0.085932[/C][/ROW]
[ROW][C]25[/C][C]0.120125[/C][C]1.2484[/C][C]0.107297[/C][/ROW]
[ROW][C]26[/C][C]0.108181[/C][C]1.1242[/C][C]0.1317[/C][/ROW]
[ROW][C]27[/C][C]0.096131[/C][C]0.999[/C][C]0.160008[/C][/ROW]
[ROW][C]28[/C][C]0.092361[/C][C]0.9598[/C][C]0.16964[/C][/ROW]
[ROW][C]29[/C][C]0.092636[/C][C]0.9627[/C][C]0.168923[/C][/ROW]
[ROW][C]30[/C][C]0.094952[/C][C]0.9868[/C][C]0.16298[/C][/ROW]
[ROW][C]31[/C][C]0.090241[/C][C]0.9378[/C][C]0.175217[/C][/ROW]
[ROW][C]32[/C][C]0.073813[/C][C]0.7671[/C][C]0.222351[/C][/ROW]
[ROW][C]33[/C][C]0.06516[/C][C]0.6772[/C][C]0.249874[/C][/ROW]
[ROW][C]34[/C][C]0.057893[/C][C]0.6016[/C][C]0.274336[/C][/ROW]
[ROW][C]35[/C][C]0.051467[/C][C]0.5349[/C][C]0.296923[/C][/ROW]
[ROW][C]36[/C][C]0.038724[/C][C]0.4024[/C][C]0.344083[/C][/ROW]
[ROW][C]37[/C][C]0.022856[/C][C]0.2375[/C][C]0.40635[/C][/ROW]
[ROW][C]38[/C][C]-0.013892[/C][C]-0.1444[/C][C]0.442739[/C][/ROW]
[ROW][C]39[/C][C]-0.055705[/C][C]-0.5789[/C][C]0.281931[/C][/ROW]
[ROW][C]40[/C][C]-0.092133[/C][C]-0.9575[/C][C]0.170234[/C][/ROW]
[ROW][C]41[/C][C]-0.12952[/C][C]-1.346[/C][C]0.090559[/C][/ROW]
[ROW][C]42[/C][C]-0.153465[/C][C]-1.5949[/C][C]0.056833[/C][/ROW]
[ROW][C]43[/C][C]-0.175492[/C][C]-1.8238[/C][C]0.035476[/C][/ROW]
[ROW][C]44[/C][C]-0.189441[/C][C]-1.9687[/C][C]0.025773[/C][/ROW]
[ROW][C]45[/C][C]-0.20244[/C][C]-2.1038[/C][C]0.018858[/C][/ROW]
[ROW][C]46[/C][C]-0.205376[/C][C]-2.1343[/C][C]0.017539[/C][/ROW]
[ROW][C]47[/C][C]-0.201178[/C][C]-2.0907[/C][C]0.019451[/C][/ROW]
[ROW][C]48[/C][C]-0.190361[/C][C]-1.9783[/C][C]0.025222[/C][/ROW]
[/TABLE]
Source: https://freestatistics.org/blog/index.php?pk=282799&T=1

Globally Unique Identifier (entire table): ba.freestatistics.org/blog/index.php?pk=282799&T=1

As an alternative you can also use a QR Code:  

The GUIDs for individual cells are displayed in the table below:

Autocorrelation Function
Time lag kACF(k)T-STATP-value
10.9387439.75570
20.8597138.93440
30.7743968.04780
40.6958397.23140
50.6282596.52910
60.5641325.86260
70.5029295.22660
80.4305994.47491e-05
90.3717013.86289.6e-05
100.3285273.41420.000451
110.2972513.08910.001276
120.2778912.88790.002343
130.25132.61160.005147
140.2286022.37570.009639
150.2070252.15150.016834
160.2042592.12270.018031
170.2126842.21030.014598
180.2125852.20920.014634
190.2064472.14550.017078
200.1927542.00320.023833
210.1767141.83650.03452
220.1591821.65430.050489
230.1391491.44610.075525
240.1323451.37540.085932
250.1201251.24840.107297
260.1081811.12420.1317
270.0961310.9990.160008
280.0923610.95980.16964
290.0926360.96270.168923
300.0949520.98680.16298
310.0902410.93780.175217
320.0738130.76710.222351
330.065160.67720.249874
340.0578930.60160.274336
350.0514670.53490.296923
360.0387240.40240.344083
370.0228560.23750.40635
38-0.013892-0.14440.442739
39-0.055705-0.57890.281931
40-0.092133-0.95750.170234
41-0.12952-1.3460.090559
42-0.153465-1.59490.056833
43-0.175492-1.82380.035476
44-0.189441-1.96870.025773
45-0.20244-2.10380.018858
46-0.205376-2.13430.017539
47-0.201178-2.09070.019451
48-0.190361-1.97830.025222


Partial Autocorrelation Function
Time lag kPACF(k)T-STATP-value
10.9387439.75570
2-0.181245-1.88350.031158
3-0.076476-0.79480.214248
40.022420.2330.408104
50.0343650.35710.360846
6-0.040692-0.42290.33661
7-0.025276-0.26270.396651
8-0.137158-1.42540.078464
90.1010981.05060.147885
100.0750710.78020.218502
110.0158440.16470.43476
120.0377460.39230.347817
13-0.093678-0.97350.166234
140.0414530.43080.33374
150.0189340.19680.422189
160.1246611.29550.098952
170.0314850.32720.372075
18-0.104586-1.08690.139752
19-0.029035-0.30170.381715
200.0187590.1950.422899
21-0.011966-0.12440.450631
22-0.025585-0.26590.395415
23-0.071463-0.74270.229649
240.1188431.23510.109746
25-0.014971-0.15560.438325
268.6e-059e-040.499643
270.0020890.02170.491361
280.0442920.46030.323115
29-0.002199-0.02280.490906
300.0261720.2720.393077
31-0.094532-0.98240.164047
32-0.0509-0.5290.298957
330.0877110.91150.182027
34-0.022467-0.23350.407914
35-0.015691-0.16310.435385
36-0.098734-1.02610.153574
370.0044430.04620.481627
38-0.184607-1.91850.028844
390.0335520.34870.364005
40-0.001715-0.01780.492906
41-0.092408-0.96030.169516
420.0677960.70460.241301
43-0.003795-0.03940.484305
440.0528750.54950.291899
45-0.031205-0.32430.373173
460.0067810.07050.471975
47-0.028564-0.29680.383577
480.078720.81810.207556

\begin{tabular}{lllllllll}
\hline
Partial Autocorrelation Function \tabularnewline
Time lag k & PACF(k) & T-STAT & P-value \tabularnewline
1 & 0.938743 & 9.7557 & 0 \tabularnewline
2 & -0.181245 & -1.8835 & 0.031158 \tabularnewline
3 & -0.076476 & -0.7948 & 0.214248 \tabularnewline
4 & 0.02242 & 0.233 & 0.408104 \tabularnewline
5 & 0.034365 & 0.3571 & 0.360846 \tabularnewline
6 & -0.040692 & -0.4229 & 0.33661 \tabularnewline
7 & -0.025276 & -0.2627 & 0.396651 \tabularnewline
8 & -0.137158 & -1.4254 & 0.078464 \tabularnewline
9 & 0.101098 & 1.0506 & 0.147885 \tabularnewline
10 & 0.075071 & 0.7802 & 0.218502 \tabularnewline
11 & 0.015844 & 0.1647 & 0.43476 \tabularnewline
12 & 0.037746 & 0.3923 & 0.347817 \tabularnewline
13 & -0.093678 & -0.9735 & 0.166234 \tabularnewline
14 & 0.041453 & 0.4308 & 0.33374 \tabularnewline
15 & 0.018934 & 0.1968 & 0.422189 \tabularnewline
16 & 0.124661 & 1.2955 & 0.098952 \tabularnewline
17 & 0.031485 & 0.3272 & 0.372075 \tabularnewline
18 & -0.104586 & -1.0869 & 0.139752 \tabularnewline
19 & -0.029035 & -0.3017 & 0.381715 \tabularnewline
20 & 0.018759 & 0.195 & 0.422899 \tabularnewline
21 & -0.011966 & -0.1244 & 0.450631 \tabularnewline
22 & -0.025585 & -0.2659 & 0.395415 \tabularnewline
23 & -0.071463 & -0.7427 & 0.229649 \tabularnewline
24 & 0.118843 & 1.2351 & 0.109746 \tabularnewline
25 & -0.014971 & -0.1556 & 0.438325 \tabularnewline
26 & 8.6e-05 & 9e-04 & 0.499643 \tabularnewline
27 & 0.002089 & 0.0217 & 0.491361 \tabularnewline
28 & 0.044292 & 0.4603 & 0.323115 \tabularnewline
29 & -0.002199 & -0.0228 & 0.490906 \tabularnewline
30 & 0.026172 & 0.272 & 0.393077 \tabularnewline
31 & -0.094532 & -0.9824 & 0.164047 \tabularnewline
32 & -0.0509 & -0.529 & 0.298957 \tabularnewline
33 & 0.087711 & 0.9115 & 0.182027 \tabularnewline
34 & -0.022467 & -0.2335 & 0.407914 \tabularnewline
35 & -0.015691 & -0.1631 & 0.435385 \tabularnewline
36 & -0.098734 & -1.0261 & 0.153574 \tabularnewline
37 & 0.004443 & 0.0462 & 0.481627 \tabularnewline
38 & -0.184607 & -1.9185 & 0.028844 \tabularnewline
39 & 0.033552 & 0.3487 & 0.364005 \tabularnewline
40 & -0.001715 & -0.0178 & 0.492906 \tabularnewline
41 & -0.092408 & -0.9603 & 0.169516 \tabularnewline
42 & 0.067796 & 0.7046 & 0.241301 \tabularnewline
43 & -0.003795 & -0.0394 & 0.484305 \tabularnewline
44 & 0.052875 & 0.5495 & 0.291899 \tabularnewline
45 & -0.031205 & -0.3243 & 0.373173 \tabularnewline
46 & 0.006781 & 0.0705 & 0.471975 \tabularnewline
47 & -0.028564 & -0.2968 & 0.383577 \tabularnewline
48 & 0.07872 & 0.8181 & 0.207556 \tabularnewline
\hline
\end{tabular}
%Source: https://freestatistics.org/blog/index.php?pk=282799&T=2

[TABLE]
[ROW][C]Partial Autocorrelation Function[/C][/ROW]
[ROW][C]Time lag k[/C][C]PACF(k)[/C][C]T-STAT[/C][C]P-value[/C][/ROW]
[ROW][C]1[/C][C]0.938743[/C][C]9.7557[/C][C]0[/C][/ROW]
[ROW][C]2[/C][C]-0.181245[/C][C]-1.8835[/C][C]0.031158[/C][/ROW]
[ROW][C]3[/C][C]-0.076476[/C][C]-0.7948[/C][C]0.214248[/C][/ROW]
[ROW][C]4[/C][C]0.02242[/C][C]0.233[/C][C]0.408104[/C][/ROW]
[ROW][C]5[/C][C]0.034365[/C][C]0.3571[/C][C]0.360846[/C][/ROW]
[ROW][C]6[/C][C]-0.040692[/C][C]-0.4229[/C][C]0.33661[/C][/ROW]
[ROW][C]7[/C][C]-0.025276[/C][C]-0.2627[/C][C]0.396651[/C][/ROW]
[ROW][C]8[/C][C]-0.137158[/C][C]-1.4254[/C][C]0.078464[/C][/ROW]
[ROW][C]9[/C][C]0.101098[/C][C]1.0506[/C][C]0.147885[/C][/ROW]
[ROW][C]10[/C][C]0.075071[/C][C]0.7802[/C][C]0.218502[/C][/ROW]
[ROW][C]11[/C][C]0.015844[/C][C]0.1647[/C][C]0.43476[/C][/ROW]
[ROW][C]12[/C][C]0.037746[/C][C]0.3923[/C][C]0.347817[/C][/ROW]
[ROW][C]13[/C][C]-0.093678[/C][C]-0.9735[/C][C]0.166234[/C][/ROW]
[ROW][C]14[/C][C]0.041453[/C][C]0.4308[/C][C]0.33374[/C][/ROW]
[ROW][C]15[/C][C]0.018934[/C][C]0.1968[/C][C]0.422189[/C][/ROW]
[ROW][C]16[/C][C]0.124661[/C][C]1.2955[/C][C]0.098952[/C][/ROW]
[ROW][C]17[/C][C]0.031485[/C][C]0.3272[/C][C]0.372075[/C][/ROW]
[ROW][C]18[/C][C]-0.104586[/C][C]-1.0869[/C][C]0.139752[/C][/ROW]
[ROW][C]19[/C][C]-0.029035[/C][C]-0.3017[/C][C]0.381715[/C][/ROW]
[ROW][C]20[/C][C]0.018759[/C][C]0.195[/C][C]0.422899[/C][/ROW]
[ROW][C]21[/C][C]-0.011966[/C][C]-0.1244[/C][C]0.450631[/C][/ROW]
[ROW][C]22[/C][C]-0.025585[/C][C]-0.2659[/C][C]0.395415[/C][/ROW]
[ROW][C]23[/C][C]-0.071463[/C][C]-0.7427[/C][C]0.229649[/C][/ROW]
[ROW][C]24[/C][C]0.118843[/C][C]1.2351[/C][C]0.109746[/C][/ROW]
[ROW][C]25[/C][C]-0.014971[/C][C]-0.1556[/C][C]0.438325[/C][/ROW]
[ROW][C]26[/C][C]8.6e-05[/C][C]9e-04[/C][C]0.499643[/C][/ROW]
[ROW][C]27[/C][C]0.002089[/C][C]0.0217[/C][C]0.491361[/C][/ROW]
[ROW][C]28[/C][C]0.044292[/C][C]0.4603[/C][C]0.323115[/C][/ROW]
[ROW][C]29[/C][C]-0.002199[/C][C]-0.0228[/C][C]0.490906[/C][/ROW]
[ROW][C]30[/C][C]0.026172[/C][C]0.272[/C][C]0.393077[/C][/ROW]
[ROW][C]31[/C][C]-0.094532[/C][C]-0.9824[/C][C]0.164047[/C][/ROW]
[ROW][C]32[/C][C]-0.0509[/C][C]-0.529[/C][C]0.298957[/C][/ROW]
[ROW][C]33[/C][C]0.087711[/C][C]0.9115[/C][C]0.182027[/C][/ROW]
[ROW][C]34[/C][C]-0.022467[/C][C]-0.2335[/C][C]0.407914[/C][/ROW]
[ROW][C]35[/C][C]-0.015691[/C][C]-0.1631[/C][C]0.435385[/C][/ROW]
[ROW][C]36[/C][C]-0.098734[/C][C]-1.0261[/C][C]0.153574[/C][/ROW]
[ROW][C]37[/C][C]0.004443[/C][C]0.0462[/C][C]0.481627[/C][/ROW]
[ROW][C]38[/C][C]-0.184607[/C][C]-1.9185[/C][C]0.028844[/C][/ROW]
[ROW][C]39[/C][C]0.033552[/C][C]0.3487[/C][C]0.364005[/C][/ROW]
[ROW][C]40[/C][C]-0.001715[/C][C]-0.0178[/C][C]0.492906[/C][/ROW]
[ROW][C]41[/C][C]-0.092408[/C][C]-0.9603[/C][C]0.169516[/C][/ROW]
[ROW][C]42[/C][C]0.067796[/C][C]0.7046[/C][C]0.241301[/C][/ROW]
[ROW][C]43[/C][C]-0.003795[/C][C]-0.0394[/C][C]0.484305[/C][/ROW]
[ROW][C]44[/C][C]0.052875[/C][C]0.5495[/C][C]0.291899[/C][/ROW]
[ROW][C]45[/C][C]-0.031205[/C][C]-0.3243[/C][C]0.373173[/C][/ROW]
[ROW][C]46[/C][C]0.006781[/C][C]0.0705[/C][C]0.471975[/C][/ROW]
[ROW][C]47[/C][C]-0.028564[/C][C]-0.2968[/C][C]0.383577[/C][/ROW]
[ROW][C]48[/C][C]0.07872[/C][C]0.8181[/C][C]0.207556[/C][/ROW]
[/TABLE]
Source: https://freestatistics.org/blog/index.php?pk=282799&T=2

Globally Unique Identifier (entire table): ba.freestatistics.org/blog/index.php?pk=282799&T=2

As an alternative you can also use a QR Code:  

The GUIDs for individual cells are displayed in the table below:

Partial Autocorrelation Function
Time lag kPACF(k)T-STATP-value
10.9387439.75570
2-0.181245-1.88350.031158
3-0.076476-0.79480.214248
40.022420.2330.408104
50.0343650.35710.360846
6-0.040692-0.42290.33661
7-0.025276-0.26270.396651
8-0.137158-1.42540.078464
90.1010981.05060.147885
100.0750710.78020.218502
110.0158440.16470.43476
120.0377460.39230.347817
13-0.093678-0.97350.166234
140.0414530.43080.33374
150.0189340.19680.422189
160.1246611.29550.098952
170.0314850.32720.372075
18-0.104586-1.08690.139752
19-0.029035-0.30170.381715
200.0187590.1950.422899
21-0.011966-0.12440.450631
22-0.025585-0.26590.395415
23-0.071463-0.74270.229649
240.1188431.23510.109746
25-0.014971-0.15560.438325
268.6e-059e-040.499643
270.0020890.02170.491361
280.0442920.46030.323115
29-0.002199-0.02280.490906
300.0261720.2720.393077
31-0.094532-0.98240.164047
32-0.0509-0.5290.298957
330.0877110.91150.182027
34-0.022467-0.23350.407914
35-0.015691-0.16310.435385
36-0.098734-1.02610.153574
370.0044430.04620.481627
38-0.184607-1.91850.028844
390.0335520.34870.364005
40-0.001715-0.01780.492906
41-0.092408-0.96030.169516
420.0677960.70460.241301
43-0.003795-0.03940.484305
440.0528750.54950.291899
45-0.031205-0.32430.373173
460.0067810.07050.471975
47-0.028564-0.29680.383577
480.078720.81810.207556


Parameters (Session):
par1 = 48 ; par2 = 1 ; par3 = 0 ; par4 = 0 ; par5 = 12 ; par6 = White Noise ; par7 = 0.95 ;
Parameters (R input):
par1 = 48 ; par2 = 1 ; par3 = 0 ; par4 = 0 ; par5 = 12 ; par6 = White Noise ; par7 = 0.95 ; par8 = ;
R code (references can be found in the software module):
if (par1 == 'Default') {
par1 = 10*log10(length(x))
} else {
par1 <- as.numeric(par1)
}
par2 <- as.numeric(par2)
par3 <- as.numeric(par3)
par4 <- as.numeric(par4)
par5 <- as.numeric(par5)
if (par6 == 'White Noise') par6 <- 'white' else par6 <- 'ma'
par7 <- as.numeric(par7)
if (par8 != '') par8 <- as.numeric(par8)
ox <- x
if (par8 == '') {
if (par2 == 0) {
x <- log(x)
} else {
x <- (x ^ par2 - 1) / par2
}
} else {
x <- log(x,base=par8)
}
if (par3 > 0) x <- diff(x,lag=1,difference=par3)
if (par4 > 0) x <- diff(x,lag=par5,difference=par4)
bitmap(file='picts.png')
op <- par(mfrow=c(2,1))
plot(ox,type='l',main='Original Time Series',xlab='time',ylab='value')
if (par8=='') {
mytitle <- paste('Working Time Series (lambda=',par2,', d=',par3,', D=',par4,')',sep='')
mysub <- paste('(lambda=',par2,', d=',par3,', D=',par4,', CI=', par7, ', CI type=',par6,')',sep='')
} else {
mytitle <- paste('Working Time Series (base=',par8,', d=',par3,', D=',par4,')',sep='')
mysub <- paste('(base=',par8,', d=',par3,', D=',par4,', CI=', par7, ', CI type=',par6,')',sep='')
}
plot(x,type='l', main=mytitle,xlab='time',ylab='value')
par(op)
dev.off()
bitmap(file='pic1.png')
racf <- acf(x, par1, main='Autocorrelation', xlab='time lag', ylab='ACF', ci.type=par6, ci=par7, sub=mysub)
dev.off()
bitmap(file='pic2.png')
rpacf <- pacf(x,par1,main='Partial Autocorrelation',xlab='lags',ylab='PACF',sub=mysub)
dev.off()
(myacf <- c(racf$acf))
(mypacf <- c(rpacf$acf))
lengthx <- length(x)
sqrtn <- sqrt(lengthx)
load(file='createtable')
a<-table.start()
a<-table.row.start(a)
a<-table.element(a,'Autocorrelation Function',4,TRUE)
a<-table.row.end(a)
a<-table.row.start(a)
a<-table.element(a,'Time lag k',header=TRUE)
a<-table.element(a,hyperlink('basics.htm','ACF(k)','click here for more information about the Autocorrelation Function'),header=TRUE)
a<-table.element(a,'T-STAT',header=TRUE)
a<-table.element(a,'P-value',header=TRUE)
a<-table.row.end(a)
for (i in 2:(par1+1)) {
a<-table.row.start(a)
a<-table.element(a,i-1,header=TRUE)
a<-table.element(a,round(myacf[i],6))
mytstat <- myacf[i]*sqrtn
a<-table.element(a,round(mytstat,4))
a<-table.element(a,round(1-pt(abs(mytstat),lengthx),6))
a<-table.row.end(a)
}
a<-table.end(a)
table.save(a,file='mytable.tab')
a<-table.start()
a<-table.row.start(a)
a<-table.element(a,'Partial Autocorrelation Function',4,TRUE)
a<-table.row.end(a)
a<-table.row.start(a)
a<-table.element(a,'Time lag k',header=TRUE)
a<-table.element(a,hyperlink('basics.htm','PACF(k)','click here for more information about the Partial Autocorrelation Function'),header=TRUE)
a<-table.element(a,'T-STAT',header=TRUE)
a<-table.element(a,'P-value',header=TRUE)
a<-table.row.end(a)
for (i in 1:par1) {
a<-table.row.start(a)
a<-table.element(a,i,header=TRUE)
a<-table.element(a,round(mypacf[i],6))
mytstat <- mypacf[i]*sqrtn
a<-table.element(a,round(mytstat,4))
a<-table.element(a,round(1-pt(abs(mytstat),lengthx),6))
a<-table.row.end(a)
}
a<-table.end(a)
table.save(a,file='mytable1.tab')