Free Statistics
of Irreproducible Research!
Description of Statistical Computation | |||||||||||||||||||||||||||||||||||||||||
|---|---|---|---|---|---|---|---|---|---|---|---|---|---|---|---|---|---|---|---|---|---|---|---|---|---|---|---|---|---|---|---|---|---|---|---|---|---|---|---|---|---|
| Author's title | |||||||||||||||||||||||||||||||||||||||||
| Author | *Unverified author* | ||||||||||||||||||||||||||||||||||||||||
| R Software Module | rwasp_univariatedataseries.wasp | ||||||||||||||||||||||||||||||||||||||||
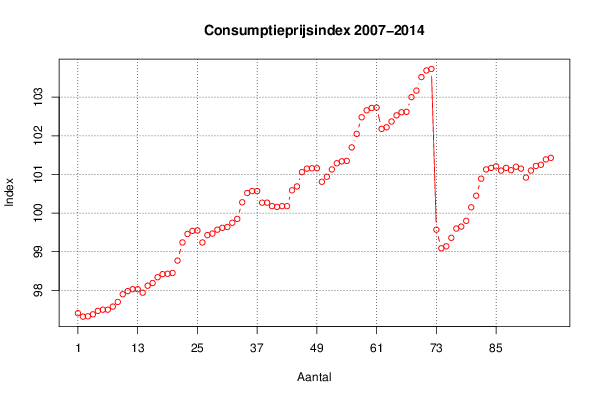
| Title produced by software | Univariate Data Series | ||||||||||||||||||||||||||||||||||||||||
| Date of computation | Thu, 01 Oct 2015 10:52:15 +0100 | ||||||||||||||||||||||||||||||||||||||||
| Cite this page as follows | Statistical Computations at FreeStatistics.org, Office for Research Development and Education, URL https://freestatistics.org/blog/index.php?v=date/2015/Oct/01/t14436932657uzaw86m742h6w2.htm/, Retrieved Sat, 25 May 2024 21:36:18 +0000 | ||||||||||||||||||||||||||||||||||||||||
| Statistical Computations at FreeStatistics.org, Office for Research Development and Education, URL https://freestatistics.org/blog/index.php?pk=280790, Retrieved Sat, 25 May 2024 21:36:18 +0000 | |||||||||||||||||||||||||||||||||||||||||
| QR Codes: | |||||||||||||||||||||||||||||||||||||||||
|
| |||||||||||||||||||||||||||||||||||||||||
| Original text written by user: | |||||||||||||||||||||||||||||||||||||||||
| IsPrivate? | No (this computation is public) | ||||||||||||||||||||||||||||||||||||||||
| User-defined keywords | |||||||||||||||||||||||||||||||||||||||||
| Estimated Impact | 124 | ||||||||||||||||||||||||||||||||||||||||
Tree of Dependent Computations | |||||||||||||||||||||||||||||||||||||||||
| Family? (F = Feedback message, R = changed R code, M = changed R Module, P = changed Parameters, D = changed Data) | |||||||||||||||||||||||||||||||||||||||||
| - [Univariate Data Series] [Consumptieprijsin...] [2015-10-01 09:52:15] [d41d8cd98f00b204e9800998ecf8427e] [Current] - RMP [Histogram] [] [2015-10-01 11:26:41] [4fe100528ef0e3436a176b2fbd665f7c] - RMP [Histogram] [] [2015-10-01 11:35:34] [4fe100528ef0e3436a176b2fbd665f7c] - RMP [Histogram] [] [2015-10-01 11:38:40] [4fe100528ef0e3436a176b2fbd665f7c] - RMP [Kernel Density Estimation] [] [2015-10-01 11:42:19] [4fe100528ef0e3436a176b2fbd665f7c] | |||||||||||||||||||||||||||||||||||||||||
| Feedback Forum | |||||||||||||||||||||||||||||||||||||||||
Post a new message | |||||||||||||||||||||||||||||||||||||||||
Dataset | |||||||||||||||||||||||||||||||||||||||||
| Dataseries X: | |||||||||||||||||||||||||||||||||||||||||
97.41 97.32 97.33 97.38 97.47 97.5 97.5 97.58 97.7 97.9 97.98 98.03 98.03 97.94 98.12 98.19 98.34 98.42 98.43 98.45 98.77 99.24 99.46 99.54 99.55 99.24 99.43 99.47 99.57 99.62 99.64 99.75 99.85 100.28 100.52 100.57 100.57 100.27 100.27 100.18 100.16 100.18 100.18 100.59 100.69 101.06 101.15 101.16 101.16 100.81 100.94 101.13 101.29 101.34 101.35 101.7 102.05 102.48 102.66 102.72 102.73 102.18 102.22 102.37 102.53 102.61 102.62 103 103.17 103.52 103.69 103.73 99.57 99.09 99.14 99.36 99.6 99.65 99.8 100.15 100.45 100.89 101.13 101.17 101.21 101.1 101.17 101.11 101.2 101.15 100.92 101.1 101.22 101.25 101.39 101.43 | |||||||||||||||||||||||||||||||||||||||||
Tables (Output of Computation) | |||||||||||||||||||||||||||||||||||||||||
| |||||||||||||||||||||||||||||||||||||||||
Figures (Output of Computation) | |||||||||||||||||||||||||||||||||||||||||
Input Parameters & R Code | |||||||||||||||||||||||||||||||||||||||||
| Parameters (Session): | |||||||||||||||||||||||||||||||||||||||||
| par1 = Consumptieprijsindex 2007-2014 kleding en schoeisel ; par2 = Blackboard ; par3 = consumptieprijzen van kleding en schoeisel van 2007 tem 2014 ; par4 = 12 ; | |||||||||||||||||||||||||||||||||||||||||
| Parameters (R input): | |||||||||||||||||||||||||||||||||||||||||
| par1 = Consumptieprijsindex 2007-2014 kleding en schoeisel ; par2 = Blackboard ; par3 = consumptieprijzen van kleding en schoeisel van 2007 tem 2014 ; par4 = 12 ; | |||||||||||||||||||||||||||||||||||||||||
| R code (references can be found in the software module): | |||||||||||||||||||||||||||||||||||||||||
par4 <- '12' | |||||||||||||||||||||||||||||||||||||||||