Free Statistics

of Irreproducible Research!

Author's title

Author*Unverified author*
R Software Modulerwasp_exponentialsmoothing.wasp
Title produced by softwareExponential Smoothing
Date of computationFri, 27 Nov 2015 18:15:02 +0000
Cite this page as followsStatistical Computations at FreeStatistics.org, Office for Research Development and Education, URL https://freestatistics.org/blog/index.php?v=date/2015/Nov/27/t1448648128o1yomnyb064x2pi.htm/, Retrieved Wed, 15 May 2024 22:54:30 +0000
Statistical Computations at FreeStatistics.org, Office for Research Development and Education, URL https://freestatistics.org/blog/index.php?pk=284327, Retrieved Wed, 15 May 2024 22:54:30 +0000
QR Codes:

Original text written by user:
IsPrivate?No (this computation is public)
User-defined keywords
Estimated Impact64
Family? (F = Feedback message, R = changed R code, M = changed R Module, P = changed Parameters, D = changed Data)
-       [Exponential Smoothing] [] [2015-11-27 18:15:02] [e7bd1b63287b3004f428c98394187272] [Current]
Feedback Forum

Post a new message
Dataseries X:
62239.3
64816.6
62625.3
67923
64363.7
67342
64411.2
69174.5
66290.2
69336.8
66712.2
72225.9
68229.5
71096.3
68407.9
74522.4
71798.4
75074.3
72694.6
78789.4
74814.5
78303.2
75431.6
82600.7
78830.5
82168.1
79493.2
86876.6
83478.5
87003.2
83672.7
90914.2
86448
90577.7
86621.1
91418.5
84275.4
87677.9
85149.6
92600
87111.3
92293.9
89060
97281.6
91812
95980.4
92043.7
100079.2
94384.8
97900.5
93630.8
102255.2
95251.8
100001.8
95689.8
104298
97435.1
101220.2
97537
105834.9


Summary of computational transaction
Raw Inputview raw input (R code)
Raw Outputview raw output of R engine
Computing time2 seconds
R Server'George Udny Yule' @ yule.wessa.net

\begin{tabular}{lllllllll}
\hline
Summary of computational transaction \tabularnewline
Raw Input & view raw input (R code)  \tabularnewline
Raw Output & view raw output of R engine  \tabularnewline
Computing time & 2 seconds \tabularnewline
R Server & 'George Udny Yule' @ yule.wessa.net \tabularnewline
\hline
\end{tabular}
%Source: https://freestatistics.org/blog/index.php?pk=284327&T=0

[TABLE]
[ROW][C]Summary of computational transaction[/C][/ROW]
[ROW][C]Raw Input[/C][C]view raw input (R code) [/C][/ROW]
[ROW][C]Raw Output[/C][C]view raw output of R engine [/C][/ROW]
[ROW][C]Computing time[/C][C]2 seconds[/C][/ROW]
[ROW][C]R Server[/C][C]'George Udny Yule' @ yule.wessa.net[/C][/ROW]
[/TABLE]
Source: https://freestatistics.org/blog/index.php?pk=284327&T=0

Globally Unique Identifier (entire table): ba.freestatistics.org/blog/index.php?pk=284327&T=0

As an alternative you can also use a QR Code:  

The GUIDs for individual cells are displayed in the table below:

Summary of computational transaction
Raw Inputview raw input (R code)
Raw Outputview raw output of R engine
Computing time2 seconds
R Server'George Udny Yule' @ yule.wessa.net


Estimated Parameters of Exponential Smoothing
ParameterValue
alpha0.647924319302959
beta0
gamma1

\begin{tabular}{lllllllll}
\hline
Estimated Parameters of Exponential Smoothing \tabularnewline
Parameter & Value \tabularnewline
alpha & 0.647924319302959 \tabularnewline
beta & 0 \tabularnewline
gamma & 1 \tabularnewline
\hline
\end{tabular}
%Source: https://freestatistics.org/blog/index.php?pk=284327&T=1

[TABLE]
[ROW][C]Estimated Parameters of Exponential Smoothing[/C][/ROW]
[ROW][C]Parameter[/C][C]Value[/C][/ROW]
[ROW][C]alpha[/C][C]0.647924319302959[/C][/ROW]
[ROW][C]beta[/C][C]0[/C][/ROW]
[ROW][C]gamma[/C][C]1[/C][/ROW]
[/TABLE]
Source: https://freestatistics.org/blog/index.php?pk=284327&T=1

Globally Unique Identifier (entire table): ba.freestatistics.org/blog/index.php?pk=284327&T=1

As an alternative you can also use a QR Code:  

The GUIDs for individual cells are displayed in the table below:

Estimated Parameters of Exponential Smoothing
ParameterValue
alpha0.647924319302959
beta0
gamma1


Interpolation Forecasts of Exponential Smoothing
tObservedFittedResiduals
1368229.564734.39158653843495.10841346156
1471096.369777.03537109241319.26462890762
1568407.967844.6595526296563.240447370394
1674522.474252.3581143011270.041885698913
1771798.471623.4570308143174.942969185679
1875074.374874.1557132459200.14428675409
1972694.672174.4079422085520.192057791457
2078789.477420.54773869831368.85226130165
2174814.575577.605119867-763.105119866988
2278303.278270.894632725732.3053672742972
2375431.675739.5124440318-307.912444031841
2482600.781078.79069486611521.90930513394
2578830.579288.7351307537-458.235130753703
2682168.181003.8498089141164.25019108604
2779493.278704.8586380054788.341361994637
2886876.685155.17747337931721.42252662068
2983478.583433.179187946345.3208120536583
3087003.286608.765293489394.434706511034
3183672.784147.5840472633-474.884047263258
3290914.289047.78245456221866.41754543781
338644886776.6141375715-328.614137571509
3490577.790031.4656130711546.23438692886
3586621.187713.2881171061-1092.18811710612
3691418.593188.6508242096-1770.1508242096
3784275.488568.4287415443-4293.02874154435
3887677.988370.1250038734-692.22500387342
3985149.684735.9300490855413.669950914511
409260091272.00535165441327.99464834562
4187111.388704.9809239216-1593.68092392155
4292293.990941.5324573781352.36754262204
438906088794.9531999496265.046800050375
4497281.694998.88614979282282.71385020722
459181292224.6290587511-412.629058751074
4695980.495733.0581134044247.341886595575
4792043.792644.3721792388-600.672179238754
48100079.298199.50583422081879.69416577918
4994384.895055.8631221942-671.063122194202
5097900.598472.0744199764-571.574419976387
5193630.895305.4106316199-1674.61063161986
52102255.2100810.3496494631444.85035053724
5395251.897290.3879571472-2038.58795714723
54100001.8100275.905423173-274.105423172587
5595689.896692.6755859402-1002.87558594017
56104298102785.4622870151512.5377129846
5797435.198563.2246571369-1128.12465713691
58101220.2101840.426433065-620.226433065036
599753797891.0567564652-354.056756465172
60105834.9104479.2552106781355.64478932235

\begin{tabular}{lllllllll}
\hline
Interpolation Forecasts of Exponential Smoothing \tabularnewline
t & Observed & Fitted & Residuals \tabularnewline
13 & 68229.5 & 64734.3915865384 & 3495.10841346156 \tabularnewline
14 & 71096.3 & 69777.0353710924 & 1319.26462890762 \tabularnewline
15 & 68407.9 & 67844.6595526296 & 563.240447370394 \tabularnewline
16 & 74522.4 & 74252.3581143011 & 270.041885698913 \tabularnewline
17 & 71798.4 & 71623.4570308143 & 174.942969185679 \tabularnewline
18 & 75074.3 & 74874.1557132459 & 200.14428675409 \tabularnewline
19 & 72694.6 & 72174.4079422085 & 520.192057791457 \tabularnewline
20 & 78789.4 & 77420.5477386983 & 1368.85226130165 \tabularnewline
21 & 74814.5 & 75577.605119867 & -763.105119866988 \tabularnewline
22 & 78303.2 & 78270.8946327257 & 32.3053672742972 \tabularnewline
23 & 75431.6 & 75739.5124440318 & -307.912444031841 \tabularnewline
24 & 82600.7 & 81078.7906948661 & 1521.90930513394 \tabularnewline
25 & 78830.5 & 79288.7351307537 & -458.235130753703 \tabularnewline
26 & 82168.1 & 81003.849808914 & 1164.25019108604 \tabularnewline
27 & 79493.2 & 78704.8586380054 & 788.341361994637 \tabularnewline
28 & 86876.6 & 85155.1774733793 & 1721.42252662068 \tabularnewline
29 & 83478.5 & 83433.1791879463 & 45.3208120536583 \tabularnewline
30 & 87003.2 & 86608.765293489 & 394.434706511034 \tabularnewline
31 & 83672.7 & 84147.5840472633 & -474.884047263258 \tabularnewline
32 & 90914.2 & 89047.7824545622 & 1866.41754543781 \tabularnewline
33 & 86448 & 86776.6141375715 & -328.614137571509 \tabularnewline
34 & 90577.7 & 90031.4656130711 & 546.23438692886 \tabularnewline
35 & 86621.1 & 87713.2881171061 & -1092.18811710612 \tabularnewline
36 & 91418.5 & 93188.6508242096 & -1770.1508242096 \tabularnewline
37 & 84275.4 & 88568.4287415443 & -4293.02874154435 \tabularnewline
38 & 87677.9 & 88370.1250038734 & -692.22500387342 \tabularnewline
39 & 85149.6 & 84735.9300490855 & 413.669950914511 \tabularnewline
40 & 92600 & 91272.0053516544 & 1327.99464834562 \tabularnewline
41 & 87111.3 & 88704.9809239216 & -1593.68092392155 \tabularnewline
42 & 92293.9 & 90941.532457378 & 1352.36754262204 \tabularnewline
43 & 89060 & 88794.9531999496 & 265.046800050375 \tabularnewline
44 & 97281.6 & 94998.8861497928 & 2282.71385020722 \tabularnewline
45 & 91812 & 92224.6290587511 & -412.629058751074 \tabularnewline
46 & 95980.4 & 95733.0581134044 & 247.341886595575 \tabularnewline
47 & 92043.7 & 92644.3721792388 & -600.672179238754 \tabularnewline
48 & 100079.2 & 98199.5058342208 & 1879.69416577918 \tabularnewline
49 & 94384.8 & 95055.8631221942 & -671.063122194202 \tabularnewline
50 & 97900.5 & 98472.0744199764 & -571.574419976387 \tabularnewline
51 & 93630.8 & 95305.4106316199 & -1674.61063161986 \tabularnewline
52 & 102255.2 & 100810.349649463 & 1444.85035053724 \tabularnewline
53 & 95251.8 & 97290.3879571472 & -2038.58795714723 \tabularnewline
54 & 100001.8 & 100275.905423173 & -274.105423172587 \tabularnewline
55 & 95689.8 & 96692.6755859402 & -1002.87558594017 \tabularnewline
56 & 104298 & 102785.462287015 & 1512.5377129846 \tabularnewline
57 & 97435.1 & 98563.2246571369 & -1128.12465713691 \tabularnewline
58 & 101220.2 & 101840.426433065 & -620.226433065036 \tabularnewline
59 & 97537 & 97891.0567564652 & -354.056756465172 \tabularnewline
60 & 105834.9 & 104479.255210678 & 1355.64478932235 \tabularnewline
\hline
\end{tabular}
%Source: https://freestatistics.org/blog/index.php?pk=284327&T=2

[TABLE]
[ROW][C]Interpolation Forecasts of Exponential Smoothing[/C][/ROW]
[ROW][C]t[/C][C]Observed[/C][C]Fitted[/C][C]Residuals[/C][/ROW]
[ROW][C]13[/C][C]68229.5[/C][C]64734.3915865384[/C][C]3495.10841346156[/C][/ROW]
[ROW][C]14[/C][C]71096.3[/C][C]69777.0353710924[/C][C]1319.26462890762[/C][/ROW]
[ROW][C]15[/C][C]68407.9[/C][C]67844.6595526296[/C][C]563.240447370394[/C][/ROW]
[ROW][C]16[/C][C]74522.4[/C][C]74252.3581143011[/C][C]270.041885698913[/C][/ROW]
[ROW][C]17[/C][C]71798.4[/C][C]71623.4570308143[/C][C]174.942969185679[/C][/ROW]
[ROW][C]18[/C][C]75074.3[/C][C]74874.1557132459[/C][C]200.14428675409[/C][/ROW]
[ROW][C]19[/C][C]72694.6[/C][C]72174.4079422085[/C][C]520.192057791457[/C][/ROW]
[ROW][C]20[/C][C]78789.4[/C][C]77420.5477386983[/C][C]1368.85226130165[/C][/ROW]
[ROW][C]21[/C][C]74814.5[/C][C]75577.605119867[/C][C]-763.105119866988[/C][/ROW]
[ROW][C]22[/C][C]78303.2[/C][C]78270.8946327257[/C][C]32.3053672742972[/C][/ROW]
[ROW][C]23[/C][C]75431.6[/C][C]75739.5124440318[/C][C]-307.912444031841[/C][/ROW]
[ROW][C]24[/C][C]82600.7[/C][C]81078.7906948661[/C][C]1521.90930513394[/C][/ROW]
[ROW][C]25[/C][C]78830.5[/C][C]79288.7351307537[/C][C]-458.235130753703[/C][/ROW]
[ROW][C]26[/C][C]82168.1[/C][C]81003.849808914[/C][C]1164.25019108604[/C][/ROW]
[ROW][C]27[/C][C]79493.2[/C][C]78704.8586380054[/C][C]788.341361994637[/C][/ROW]
[ROW][C]28[/C][C]86876.6[/C][C]85155.1774733793[/C][C]1721.42252662068[/C][/ROW]
[ROW][C]29[/C][C]83478.5[/C][C]83433.1791879463[/C][C]45.3208120536583[/C][/ROW]
[ROW][C]30[/C][C]87003.2[/C][C]86608.765293489[/C][C]394.434706511034[/C][/ROW]
[ROW][C]31[/C][C]83672.7[/C][C]84147.5840472633[/C][C]-474.884047263258[/C][/ROW]
[ROW][C]32[/C][C]90914.2[/C][C]89047.7824545622[/C][C]1866.41754543781[/C][/ROW]
[ROW][C]33[/C][C]86448[/C][C]86776.6141375715[/C][C]-328.614137571509[/C][/ROW]
[ROW][C]34[/C][C]90577.7[/C][C]90031.4656130711[/C][C]546.23438692886[/C][/ROW]
[ROW][C]35[/C][C]86621.1[/C][C]87713.2881171061[/C][C]-1092.18811710612[/C][/ROW]
[ROW][C]36[/C][C]91418.5[/C][C]93188.6508242096[/C][C]-1770.1508242096[/C][/ROW]
[ROW][C]37[/C][C]84275.4[/C][C]88568.4287415443[/C][C]-4293.02874154435[/C][/ROW]
[ROW][C]38[/C][C]87677.9[/C][C]88370.1250038734[/C][C]-692.22500387342[/C][/ROW]
[ROW][C]39[/C][C]85149.6[/C][C]84735.9300490855[/C][C]413.669950914511[/C][/ROW]
[ROW][C]40[/C][C]92600[/C][C]91272.0053516544[/C][C]1327.99464834562[/C][/ROW]
[ROW][C]41[/C][C]87111.3[/C][C]88704.9809239216[/C][C]-1593.68092392155[/C][/ROW]
[ROW][C]42[/C][C]92293.9[/C][C]90941.532457378[/C][C]1352.36754262204[/C][/ROW]
[ROW][C]43[/C][C]89060[/C][C]88794.9531999496[/C][C]265.046800050375[/C][/ROW]
[ROW][C]44[/C][C]97281.6[/C][C]94998.8861497928[/C][C]2282.71385020722[/C][/ROW]
[ROW][C]45[/C][C]91812[/C][C]92224.6290587511[/C][C]-412.629058751074[/C][/ROW]
[ROW][C]46[/C][C]95980.4[/C][C]95733.0581134044[/C][C]247.341886595575[/C][/ROW]
[ROW][C]47[/C][C]92043.7[/C][C]92644.3721792388[/C][C]-600.672179238754[/C][/ROW]
[ROW][C]48[/C][C]100079.2[/C][C]98199.5058342208[/C][C]1879.69416577918[/C][/ROW]
[ROW][C]49[/C][C]94384.8[/C][C]95055.8631221942[/C][C]-671.063122194202[/C][/ROW]
[ROW][C]50[/C][C]97900.5[/C][C]98472.0744199764[/C][C]-571.574419976387[/C][/ROW]
[ROW][C]51[/C][C]93630.8[/C][C]95305.4106316199[/C][C]-1674.61063161986[/C][/ROW]
[ROW][C]52[/C][C]102255.2[/C][C]100810.349649463[/C][C]1444.85035053724[/C][/ROW]
[ROW][C]53[/C][C]95251.8[/C][C]97290.3879571472[/C][C]-2038.58795714723[/C][/ROW]
[ROW][C]54[/C][C]100001.8[/C][C]100275.905423173[/C][C]-274.105423172587[/C][/ROW]
[ROW][C]55[/C][C]95689.8[/C][C]96692.6755859402[/C][C]-1002.87558594017[/C][/ROW]
[ROW][C]56[/C][C]104298[/C][C]102785.462287015[/C][C]1512.5377129846[/C][/ROW]
[ROW][C]57[/C][C]97435.1[/C][C]98563.2246571369[/C][C]-1128.12465713691[/C][/ROW]
[ROW][C]58[/C][C]101220.2[/C][C]101840.426433065[/C][C]-620.226433065036[/C][/ROW]
[ROW][C]59[/C][C]97537[/C][C]97891.0567564652[/C][C]-354.056756465172[/C][/ROW]
[ROW][C]60[/C][C]105834.9[/C][C]104479.255210678[/C][C]1355.64478932235[/C][/ROW]
[/TABLE]
Source: https://freestatistics.org/blog/index.php?pk=284327&T=2

Globally Unique Identifier (entire table): ba.freestatistics.org/blog/index.php?pk=284327&T=2

As an alternative you can also use a QR Code:  

The GUIDs for individual cells are displayed in the table below:

Interpolation Forecasts of Exponential Smoothing
tObservedFittedResiduals
1368229.564734.39158653843495.10841346156
1471096.369777.03537109241319.26462890762
1568407.967844.6595526296563.240447370394
1674522.474252.3581143011270.041885698913
1771798.471623.4570308143174.942969185679
1875074.374874.1557132459200.14428675409
1972694.672174.4079422085520.192057791457
2078789.477420.54773869831368.85226130165
2174814.575577.605119867-763.105119866988
2278303.278270.894632725732.3053672742972
2375431.675739.5124440318-307.912444031841
2482600.781078.79069486611521.90930513394
2578830.579288.7351307537-458.235130753703
2682168.181003.8498089141164.25019108604
2779493.278704.8586380054788.341361994637
2886876.685155.17747337931721.42252662068
2983478.583433.179187946345.3208120536583
3087003.286608.765293489394.434706511034
3183672.784147.5840472633-474.884047263258
3290914.289047.78245456221866.41754543781
338644886776.6141375715-328.614137571509
3490577.790031.4656130711546.23438692886
3586621.187713.2881171061-1092.18811710612
3691418.593188.6508242096-1770.1508242096
3784275.488568.4287415443-4293.02874154435
3887677.988370.1250038734-692.22500387342
3985149.684735.9300490855413.669950914511
409260091272.00535165441327.99464834562
4187111.388704.9809239216-1593.68092392155
4292293.990941.5324573781352.36754262204
438906088794.9531999496265.046800050375
4497281.694998.88614979282282.71385020722
459181292224.6290587511-412.629058751074
4695980.495733.0581134044247.341886595575
4792043.792644.3721792388-600.672179238754
48100079.298199.50583422081879.69416577918
4994384.895055.8631221942-671.063122194202
5097900.598472.0744199764-571.574419976387
5193630.895305.4106316199-1674.61063161986
52102255.2100810.3496494631444.85035053724
5395251.897290.3879571472-2038.58795714723
54100001.8100275.905423173-274.105423172587
5595689.896692.6755859402-1002.87558594017
56104298102785.4622870151512.5377129846
5797435.198563.2246571369-1128.12465713691
58101220.2101840.426433065-620.226433065036
599753797891.0567564652-354.056756465172
60105834.9104479.2552106781355.64478932235


Extrapolation Forecasts of Exponential Smoothing
tForecast95% Lower Bound95% Upper Bound
61100098.00855467397481.970101435102714.047007911
62103984.045521667100866.888962334107101.202081
63100799.36647525797251.1735771799104347.559373334
64108487.61279539104555.351274518112419.874316263
65102805.06350986498523.0443021646107087.082717564
66107732.663079591103127.373042939112337.953116242
67104070.45056095699163.1392657304108977.761856183
68111698.640592851106506.847841322116890.43334438
69105566.679993415100105.204020622111028.155966208
70109753.639782873104035.184779292115472.094786453
71106299.8417658100335.469589741112264.213941859
72113719.386538462107518.842749316119919.930327607

\begin{tabular}{lllllllll}
\hline
Extrapolation Forecasts of Exponential Smoothing \tabularnewline
t & Forecast & 95% Lower Bound & 95% Upper Bound \tabularnewline
61 & 100098.008554673 & 97481.970101435 & 102714.047007911 \tabularnewline
62 & 103984.045521667 & 100866.888962334 & 107101.202081 \tabularnewline
63 & 100799.366475257 & 97251.1735771799 & 104347.559373334 \tabularnewline
64 & 108487.61279539 & 104555.351274518 & 112419.874316263 \tabularnewline
65 & 102805.063509864 & 98523.0443021646 & 107087.082717564 \tabularnewline
66 & 107732.663079591 & 103127.373042939 & 112337.953116242 \tabularnewline
67 & 104070.450560956 & 99163.1392657304 & 108977.761856183 \tabularnewline
68 & 111698.640592851 & 106506.847841322 & 116890.43334438 \tabularnewline
69 & 105566.679993415 & 100105.204020622 & 111028.155966208 \tabularnewline
70 & 109753.639782873 & 104035.184779292 & 115472.094786453 \tabularnewline
71 & 106299.8417658 & 100335.469589741 & 112264.213941859 \tabularnewline
72 & 113719.386538462 & 107518.842749316 & 119919.930327607 \tabularnewline
\hline
\end{tabular}
%Source: https://freestatistics.org/blog/index.php?pk=284327&T=3

[TABLE]
[ROW][C]Extrapolation Forecasts of Exponential Smoothing[/C][/ROW]
[ROW][C]t[/C][C]Forecast[/C][C]95% Lower Bound[/C][C]95% Upper Bound[/C][/ROW]
[ROW][C]61[/C][C]100098.008554673[/C][C]97481.970101435[/C][C]102714.047007911[/C][/ROW]
[ROW][C]62[/C][C]103984.045521667[/C][C]100866.888962334[/C][C]107101.202081[/C][/ROW]
[ROW][C]63[/C][C]100799.366475257[/C][C]97251.1735771799[/C][C]104347.559373334[/C][/ROW]
[ROW][C]64[/C][C]108487.61279539[/C][C]104555.351274518[/C][C]112419.874316263[/C][/ROW]
[ROW][C]65[/C][C]102805.063509864[/C][C]98523.0443021646[/C][C]107087.082717564[/C][/ROW]
[ROW][C]66[/C][C]107732.663079591[/C][C]103127.373042939[/C][C]112337.953116242[/C][/ROW]
[ROW][C]67[/C][C]104070.450560956[/C][C]99163.1392657304[/C][C]108977.761856183[/C][/ROW]
[ROW][C]68[/C][C]111698.640592851[/C][C]106506.847841322[/C][C]116890.43334438[/C][/ROW]
[ROW][C]69[/C][C]105566.679993415[/C][C]100105.204020622[/C][C]111028.155966208[/C][/ROW]
[ROW][C]70[/C][C]109753.639782873[/C][C]104035.184779292[/C][C]115472.094786453[/C][/ROW]
[ROW][C]71[/C][C]106299.8417658[/C][C]100335.469589741[/C][C]112264.213941859[/C][/ROW]
[ROW][C]72[/C][C]113719.386538462[/C][C]107518.842749316[/C][C]119919.930327607[/C][/ROW]
[/TABLE]
Source: https://freestatistics.org/blog/index.php?pk=284327&T=3

Globally Unique Identifier (entire table): ba.freestatistics.org/blog/index.php?pk=284327&T=3

As an alternative you can also use a QR Code:  

The GUIDs for individual cells are displayed in the table below:

Extrapolation Forecasts of Exponential Smoothing
tForecast95% Lower Bound95% Upper Bound
61100098.00855467397481.970101435102714.047007911
62103984.045521667100866.888962334107101.202081
63100799.36647525797251.1735771799104347.559373334
64108487.61279539104555.351274518112419.874316263
65102805.06350986498523.0443021646107087.082717564
66107732.663079591103127.373042939112337.953116242
67104070.45056095699163.1392657304108977.761856183
68111698.640592851106506.847841322116890.43334438
69105566.679993415100105.204020622111028.155966208
70109753.639782873104035.184779292115472.094786453
71106299.8417658100335.469589741112264.213941859
72113719.386538462107518.842749316119919.930327607


Parameters (Session):
par1 = 12 ; par2 = Triple ; par3 = additive ;
Parameters (R input):
par1 = 12 ; par2 = Triple ; par3 = additive ;
R code (references can be found in the software module):
par3 <- 'additive'
par2 <- 'Triple'
par1 <- '12'
par1 <- as.numeric(par1)
if (par2 == 'Single') K <- 1
if (par2 == 'Double') K <- 2
if (par2 == 'Triple') K <- par1
nx <- length(x)
nxmK <- nx - K
x <- ts(x, frequency = par1)
if (par2 == 'Single') fit <- HoltWinters(x, gamma=F, beta=F)
if (par2 == 'Double') fit <- HoltWinters(x, gamma=F)
if (par2 == 'Triple') fit <- HoltWinters(x, seasonal=par3)
fit
myresid <- x - fit$fitted[,'xhat']
bitmap(file='test1.png')
op <- par(mfrow=c(2,1))
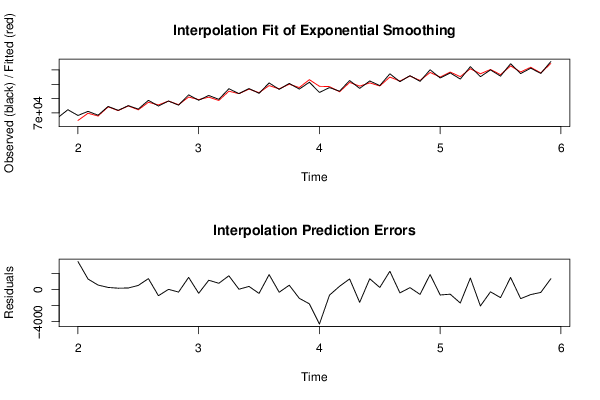
plot(fit,ylab='Observed (black) / Fitted (red)',main='Interpolation Fit of Exponential Smoothing')
plot(myresid,ylab='Residuals',main='Interpolation Prediction Errors')
par(op)
dev.off()
bitmap(file='test2.png')
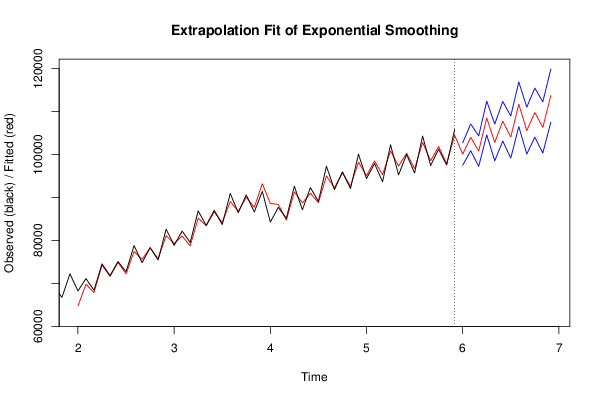
p <- predict(fit, par1, prediction.interval=TRUE)
np <- length(p[,1])
plot(fit,p,ylab='Observed (black) / Fitted (red)',main='Extrapolation Fit of Exponential Smoothing')
dev.off()
bitmap(file='test3.png')
op <- par(mfrow = c(2,2))
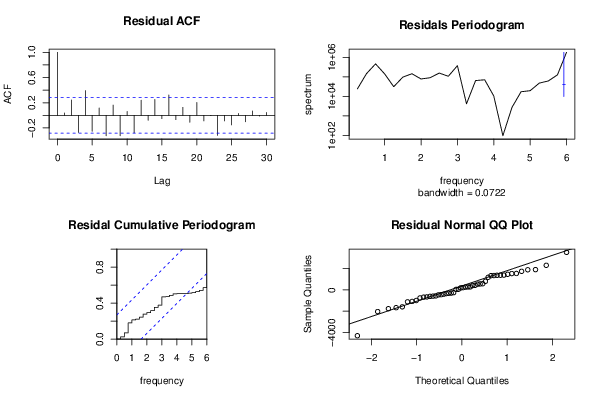
acf(as.numeric(myresid),lag.max = nx/2,main='Residual ACF')
spectrum(myresid,main='Residals Periodogram')
cpgram(myresid,main='Residal Cumulative Periodogram')
qqnorm(myresid,main='Residual Normal QQ Plot')
qqline(myresid)
par(op)
dev.off()
load(file='createtable')
a<-table.start()
a<-table.row.start(a)
a<-table.element(a,'Estimated Parameters of Exponential Smoothing',2,TRUE)
a<-table.row.end(a)
a<-table.row.start(a)
a<-table.element(a,'Parameter',header=TRUE)
a<-table.element(a,'Value',header=TRUE)
a<-table.row.end(a)
a<-table.row.start(a)
a<-table.element(a,'alpha',header=TRUE)
a<-table.element(a,fit$alpha)
a<-table.row.end(a)
a<-table.row.start(a)
a<-table.element(a,'beta',header=TRUE)
a<-table.element(a,fit$beta)
a<-table.row.end(a)
a<-table.row.start(a)
a<-table.element(a,'gamma',header=TRUE)
a<-table.element(a,fit$gamma)
a<-table.row.end(a)
a<-table.end(a)
table.save(a,file='mytable.tab')
a<-table.start()
a<-table.row.start(a)
a<-table.element(a,'Interpolation Forecasts of Exponential Smoothing',4,TRUE)
a<-table.row.end(a)
a<-table.row.start(a)
a<-table.element(a,'t',header=TRUE)
a<-table.element(a,'Observed',header=TRUE)
a<-table.element(a,'Fitted',header=TRUE)
a<-table.element(a,'Residuals',header=TRUE)
a<-table.row.end(a)
for (i in 1:nxmK) {
a<-table.row.start(a)
a<-table.element(a,i+K,header=TRUE)
a<-table.element(a,x[i+K])
a<-table.element(a,fit$fitted[i,'xhat'])
a<-table.element(a,myresid[i])
a<-table.row.end(a)
}
a<-table.end(a)
table.save(a,file='mytable1.tab')
a<-table.start()
a<-table.row.start(a)
a<-table.element(a,'Extrapolation Forecasts of Exponential Smoothing',4,TRUE)
a<-table.row.end(a)
a<-table.row.start(a)
a<-table.element(a,'t',header=TRUE)
a<-table.element(a,'Forecast',header=TRUE)
a<-table.element(a,'95% Lower Bound',header=TRUE)
a<-table.element(a,'95% Upper Bound',header=TRUE)
a<-table.row.end(a)
for (i in 1:np) {
a<-table.row.start(a)
a<-table.element(a,nx+i,header=TRUE)
a<-table.element(a,p[i,'fit'])
a<-table.element(a,p[i,'lwr'])
a<-table.element(a,p[i,'upr'])
a<-table.row.end(a)
}
a<-table.end(a)
table.save(a,file='mytable2.tab')