Free Statistics

of Irreproducible Research!

Author's title

Author*The author of this computation has been verified*
R Software Modulerwasp_autocorrelation.wasp
Title produced by software(Partial) Autocorrelation Function
Date of computationThu, 26 Nov 2015 19:18:56 +0000
Cite this page as followsStatistical Computations at FreeStatistics.org, Office for Research Development and Education, URL https://freestatistics.org/blog/index.php?v=date/2015/Nov/26/t1448565604ugtbp5bbwcpwy6f.htm/, Retrieved Tue, 21 May 2024 17:18:20 +0000
Statistical Computations at FreeStatistics.org, Office for Research Development and Education, URL https://freestatistics.org/blog/index.php?pk=284271, Retrieved Tue, 21 May 2024 17:18:20 +0000
QR Codes:

Original text written by user:
IsPrivate?No (this computation is public)
User-defined keywordsd = 1 D = 0
Estimated Impact128
Family? (F = Feedback message, R = changed R code, M = changed R Module, P = changed Parameters, D = changed Data)
-       [(Partial) Autocorrelation Function] [Partial Autocorre...] [2015-11-26 19:18:56] [60fe8c82fc27b8a1ae22563c57c4f789] [Current]
Feedback Forum

Post a new message
Dataseries X:
33111
36156
48057
51262
63124
67493
64529
54846
69272
58103
47189
38796
37194
38529
56824
61778
73920
78983
70488
58012
71735
63532
46650
40230
36714
38134
58602
64596
73221
76983
69806
63304
70421
64612
45888
43843
35946
36016
54582
59231
71426
76728
76730
64343
75780
67908
46881
44469
36190
41567
57046
65558
87125
91173
91570
71373
80991
74100
49578
49029


Summary of computational transaction
Raw Inputview raw input (R code)
Raw Outputview raw output of R engine
Computing time2 seconds
R Server'Sir Ronald Aylmer Fisher' @ fisher.wessa.net

\begin{tabular}{lllllllll}
\hline
Summary of computational transaction \tabularnewline
Raw Input & view raw input (R code)  \tabularnewline
Raw Output & view raw output of R engine  \tabularnewline
Computing time & 2 seconds \tabularnewline
R Server & 'Sir Ronald Aylmer Fisher' @ fisher.wessa.net \tabularnewline
\hline
\end{tabular}
%Source: https://freestatistics.org/blog/index.php?pk=284271&T=0

[TABLE]
[ROW][C]Summary of computational transaction[/C][/ROW]
[ROW][C]Raw Input[/C][C]view raw input (R code) [/C][/ROW]
[ROW][C]Raw Output[/C][C]view raw output of R engine [/C][/ROW]
[ROW][C]Computing time[/C][C]2 seconds[/C][/ROW]
[ROW][C]R Server[/C][C]'Sir Ronald Aylmer Fisher' @ fisher.wessa.net[/C][/ROW]
[/TABLE]
Source: https://freestatistics.org/blog/index.php?pk=284271&T=0

Globally Unique Identifier (entire table): ba.freestatistics.org/blog/index.php?pk=284271&T=0

As an alternative you can also use a QR Code:  

The GUIDs for individual cells are displayed in the table below:

Summary of computational transaction
Raw Inputview raw input (R code)
Raw Outputview raw output of R engine
Computing time2 seconds
R Server'Sir Ronald Aylmer Fisher' @ fisher.wessa.net


Autocorrelation Function
Time lag kACF(k)T-STATP-value
10.187931.44350.077082
20.0389620.29930.382893
30.0589170.45260.326265
4-0.221742-1.70320.046893
5-0.388615-2.9850.002061
6-0.173788-1.33490.09352
7-0.32473-2.49430.007721
8-0.277451-2.13110.018627
90.0490440.37670.353868
100.039890.30640.38019
110.1498781.15120.127139
120.7336035.63490
130.1785261.37130.08774
140.0006440.00490.498034
150.0537830.41310.34051
16-0.15379-1.18130.121115
17-0.317144-2.4360.008944

\begin{tabular}{lllllllll}
\hline
Autocorrelation Function \tabularnewline
Time lag k & ACF(k) & T-STAT & P-value \tabularnewline
1 & 0.18793 & 1.4435 & 0.077082 \tabularnewline
2 & 0.038962 & 0.2993 & 0.382893 \tabularnewline
3 & 0.058917 & 0.4526 & 0.326265 \tabularnewline
4 & -0.221742 & -1.7032 & 0.046893 \tabularnewline
5 & -0.388615 & -2.985 & 0.002061 \tabularnewline
6 & -0.173788 & -1.3349 & 0.09352 \tabularnewline
7 & -0.32473 & -2.4943 & 0.007721 \tabularnewline
8 & -0.277451 & -2.1311 & 0.018627 \tabularnewline
9 & 0.049044 & 0.3767 & 0.353868 \tabularnewline
10 & 0.03989 & 0.3064 & 0.38019 \tabularnewline
11 & 0.149878 & 1.1512 & 0.127139 \tabularnewline
12 & 0.733603 & 5.6349 & 0 \tabularnewline
13 & 0.178526 & 1.3713 & 0.08774 \tabularnewline
14 & 0.000644 & 0.0049 & 0.498034 \tabularnewline
15 & 0.053783 & 0.4131 & 0.34051 \tabularnewline
16 & -0.15379 & -1.1813 & 0.121115 \tabularnewline
17 & -0.317144 & -2.436 & 0.008944 \tabularnewline
\hline
\end{tabular}
%Source: https://freestatistics.org/blog/index.php?pk=284271&T=1

[TABLE]
[ROW][C]Autocorrelation Function[/C][/ROW]
[ROW][C]Time lag k[/C][C]ACF(k)[/C][C]T-STAT[/C][C]P-value[/C][/ROW]
[ROW][C]1[/C][C]0.18793[/C][C]1.4435[/C][C]0.077082[/C][/ROW]
[ROW][C]2[/C][C]0.038962[/C][C]0.2993[/C][C]0.382893[/C][/ROW]
[ROW][C]3[/C][C]0.058917[/C][C]0.4526[/C][C]0.326265[/C][/ROW]
[ROW][C]4[/C][C]-0.221742[/C][C]-1.7032[/C][C]0.046893[/C][/ROW]
[ROW][C]5[/C][C]-0.388615[/C][C]-2.985[/C][C]0.002061[/C][/ROW]
[ROW][C]6[/C][C]-0.173788[/C][C]-1.3349[/C][C]0.09352[/C][/ROW]
[ROW][C]7[/C][C]-0.32473[/C][C]-2.4943[/C][C]0.007721[/C][/ROW]
[ROW][C]8[/C][C]-0.277451[/C][C]-2.1311[/C][C]0.018627[/C][/ROW]
[ROW][C]9[/C][C]0.049044[/C][C]0.3767[/C][C]0.353868[/C][/ROW]
[ROW][C]10[/C][C]0.03989[/C][C]0.3064[/C][C]0.38019[/C][/ROW]
[ROW][C]11[/C][C]0.149878[/C][C]1.1512[/C][C]0.127139[/C][/ROW]
[ROW][C]12[/C][C]0.733603[/C][C]5.6349[/C][C]0[/C][/ROW]
[ROW][C]13[/C][C]0.178526[/C][C]1.3713[/C][C]0.08774[/C][/ROW]
[ROW][C]14[/C][C]0.000644[/C][C]0.0049[/C][C]0.498034[/C][/ROW]
[ROW][C]15[/C][C]0.053783[/C][C]0.4131[/C][C]0.34051[/C][/ROW]
[ROW][C]16[/C][C]-0.15379[/C][C]-1.1813[/C][C]0.121115[/C][/ROW]
[ROW][C]17[/C][C]-0.317144[/C][C]-2.436[/C][C]0.008944[/C][/ROW]
[/TABLE]
Source: https://freestatistics.org/blog/index.php?pk=284271&T=1

Globally Unique Identifier (entire table): ba.freestatistics.org/blog/index.php?pk=284271&T=1

As an alternative you can also use a QR Code:  

The GUIDs for individual cells are displayed in the table below:

Autocorrelation Function
Time lag kACF(k)T-STATP-value
10.187931.44350.077082
20.0389620.29930.382893
30.0589170.45260.326265
4-0.221742-1.70320.046893
5-0.388615-2.9850.002061
6-0.173788-1.33490.09352
7-0.32473-2.49430.007721
8-0.277451-2.13110.018627
90.0490440.37670.353868
100.039890.30640.38019
110.1498781.15120.127139
120.7336035.63490
130.1785261.37130.08774
140.0006440.00490.498034
150.0537830.41310.34051
16-0.15379-1.18130.121115
17-0.317144-2.4360.008944


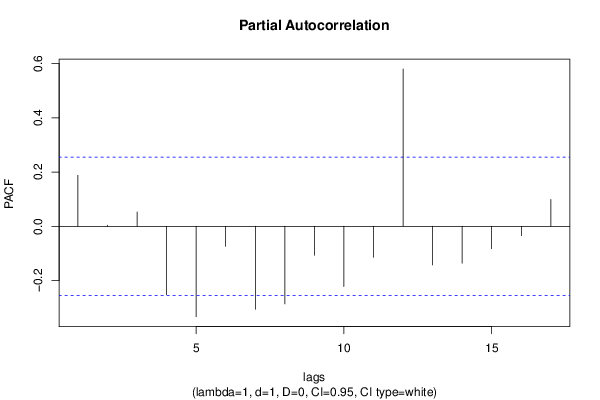
Partial Autocorrelation Function
Time lag kPACF(k)T-STATP-value
10.187931.44350.077082
20.0037770.0290.488476
30.0527780.40540.343327
4-0.252024-1.93580.028842
5-0.333312-2.56020.006521
6-0.073394-0.56380.28753
7-0.305913-2.34980.011076
8-0.286265-2.19880.015911
9-0.106871-0.82090.207506
10-0.221957-1.70490.046739
11-0.114205-0.87720.191961
120.5803384.45771.9e-05
13-0.14248-1.09440.139111
14-0.13605-1.0450.150139
15-0.082956-0.63720.263232
16-0.034763-0.2670.395191
170.0991110.76130.22476

\begin{tabular}{lllllllll}
\hline
Partial Autocorrelation Function \tabularnewline
Time lag k & PACF(k) & T-STAT & P-value \tabularnewline
1 & 0.18793 & 1.4435 & 0.077082 \tabularnewline
2 & 0.003777 & 0.029 & 0.488476 \tabularnewline
3 & 0.052778 & 0.4054 & 0.343327 \tabularnewline
4 & -0.252024 & -1.9358 & 0.028842 \tabularnewline
5 & -0.333312 & -2.5602 & 0.006521 \tabularnewline
6 & -0.073394 & -0.5638 & 0.28753 \tabularnewline
7 & -0.305913 & -2.3498 & 0.011076 \tabularnewline
8 & -0.286265 & -2.1988 & 0.015911 \tabularnewline
9 & -0.106871 & -0.8209 & 0.207506 \tabularnewline
10 & -0.221957 & -1.7049 & 0.046739 \tabularnewline
11 & -0.114205 & -0.8772 & 0.191961 \tabularnewline
12 & 0.580338 & 4.4577 & 1.9e-05 \tabularnewline
13 & -0.14248 & -1.0944 & 0.139111 \tabularnewline
14 & -0.13605 & -1.045 & 0.150139 \tabularnewline
15 & -0.082956 & -0.6372 & 0.263232 \tabularnewline
16 & -0.034763 & -0.267 & 0.395191 \tabularnewline
17 & 0.099111 & 0.7613 & 0.22476 \tabularnewline
\hline
\end{tabular}
%Source: https://freestatistics.org/blog/index.php?pk=284271&T=2

[TABLE]
[ROW][C]Partial Autocorrelation Function[/C][/ROW]
[ROW][C]Time lag k[/C][C]PACF(k)[/C][C]T-STAT[/C][C]P-value[/C][/ROW]
[ROW][C]1[/C][C]0.18793[/C][C]1.4435[/C][C]0.077082[/C][/ROW]
[ROW][C]2[/C][C]0.003777[/C][C]0.029[/C][C]0.488476[/C][/ROW]
[ROW][C]3[/C][C]0.052778[/C][C]0.4054[/C][C]0.343327[/C][/ROW]
[ROW][C]4[/C][C]-0.252024[/C][C]-1.9358[/C][C]0.028842[/C][/ROW]
[ROW][C]5[/C][C]-0.333312[/C][C]-2.5602[/C][C]0.006521[/C][/ROW]
[ROW][C]6[/C][C]-0.073394[/C][C]-0.5638[/C][C]0.28753[/C][/ROW]
[ROW][C]7[/C][C]-0.305913[/C][C]-2.3498[/C][C]0.011076[/C][/ROW]
[ROW][C]8[/C][C]-0.286265[/C][C]-2.1988[/C][C]0.015911[/C][/ROW]
[ROW][C]9[/C][C]-0.106871[/C][C]-0.8209[/C][C]0.207506[/C][/ROW]
[ROW][C]10[/C][C]-0.221957[/C][C]-1.7049[/C][C]0.046739[/C][/ROW]
[ROW][C]11[/C][C]-0.114205[/C][C]-0.8772[/C][C]0.191961[/C][/ROW]
[ROW][C]12[/C][C]0.580338[/C][C]4.4577[/C][C]1.9e-05[/C][/ROW]
[ROW][C]13[/C][C]-0.14248[/C][C]-1.0944[/C][C]0.139111[/C][/ROW]
[ROW][C]14[/C][C]-0.13605[/C][C]-1.045[/C][C]0.150139[/C][/ROW]
[ROW][C]15[/C][C]-0.082956[/C][C]-0.6372[/C][C]0.263232[/C][/ROW]
[ROW][C]16[/C][C]-0.034763[/C][C]-0.267[/C][C]0.395191[/C][/ROW]
[ROW][C]17[/C][C]0.099111[/C][C]0.7613[/C][C]0.22476[/C][/ROW]
[/TABLE]
Source: https://freestatistics.org/blog/index.php?pk=284271&T=2

Globally Unique Identifier (entire table): ba.freestatistics.org/blog/index.php?pk=284271&T=2

As an alternative you can also use a QR Code:  

The GUIDs for individual cells are displayed in the table below:

Partial Autocorrelation Function
Time lag kPACF(k)T-STATP-value
10.187931.44350.077082
20.0037770.0290.488476
30.0527780.40540.343327
4-0.252024-1.93580.028842
5-0.333312-2.56020.006521
6-0.073394-0.56380.28753
7-0.305913-2.34980.011076
8-0.286265-2.19880.015911
9-0.106871-0.82090.207506
10-0.221957-1.70490.046739
11-0.114205-0.87720.191961
120.5803384.45771.9e-05
13-0.14248-1.09440.139111
14-0.13605-1.0450.150139
15-0.082956-0.63720.263232
16-0.034763-0.2670.395191
170.0991110.76130.22476


Parameters (Session):
par1 = Default ; par2 = 1 ; par3 = 1 ; par4 = 0 ; par5 = 12 ; par6 = White Noise ; par7 = 0.95 ;
Parameters (R input):
par1 = Default ; par2 = 1 ; par3 = 1 ; par4 = 0 ; par5 = 12 ; par6 = White Noise ; par7 = 0.95 ; par8 = ;
R code (references can be found in the software module):
par8 <- ''
par7 <- '0.95'
par6 <- 'White Noise'
par5 <- '12'
par4 <- '1'
par3 <- '0'
par2 <- '1'
par1 <- 'Default'
if (par1 == 'Default') {
par1 = 10*log10(length(x))
} else {
par1 <- as.numeric(par1)
}
par2 <- as.numeric(par2)
par3 <- as.numeric(par3)
par4 <- as.numeric(par4)
par5 <- as.numeric(par5)
if (par6 == 'White Noise') par6 <- 'white' else par6 <- 'ma'
par7 <- as.numeric(par7)
if (par8 != '') par8 <- as.numeric(par8)
ox <- x
if (par8 == '') {
if (par2 == 0) {
x <- log(x)
} else {
x <- (x ^ par2 - 1) / par2
}
} else {
x <- log(x,base=par8)
}
if (par3 > 0) x <- diff(x,lag=1,difference=par3)
if (par4 > 0) x <- diff(x,lag=par5,difference=par4)
bitmap(file='picts.png')
op <- par(mfrow=c(2,1))
plot(ox,type='l',main='Original Time Series',xlab='time',ylab='value')
if (par8=='') {
mytitle <- paste('Working Time Series (lambda=',par2,', d=',par3,', D=',par4,')',sep='')
mysub <- paste('(lambda=',par2,', d=',par3,', D=',par4,', CI=', par7, ', CI type=',par6,')',sep='')
} else {
mytitle <- paste('Working Time Series (base=',par8,', d=',par3,', D=',par4,')',sep='')
mysub <- paste('(base=',par8,', d=',par3,', D=',par4,', CI=', par7, ', CI type=',par6,')',sep='')
}
plot(x,type='l', main=mytitle,xlab='time',ylab='value')
par(op)
dev.off()
bitmap(file='pic1.png')
racf <- acf(x, par1, main='Autocorrelation', xlab='time lag', ylab='ACF', ci.type=par6, ci=par7, sub=mysub)
dev.off()
bitmap(file='pic2.png')
rpacf <- pacf(x,par1,main='Partial Autocorrelation',xlab='lags',ylab='PACF',sub=mysub)
dev.off()
(myacf <- c(racf$acf))
(mypacf <- c(rpacf$acf))
lengthx <- length(x)
sqrtn <- sqrt(lengthx)
load(file='createtable')
a<-table.start()
a<-table.row.start(a)
a<-table.element(a,'Autocorrelation Function',4,TRUE)
a<-table.row.end(a)
a<-table.row.start(a)
a<-table.element(a,'Time lag k',header=TRUE)
a<-table.element(a,hyperlink('basics.htm','ACF(k)','click here for more information about the Autocorrelation Function'),header=TRUE)
a<-table.element(a,'T-STAT',header=TRUE)
a<-table.element(a,'P-value',header=TRUE)
a<-table.row.end(a)
for (i in 2:(par1+1)) {
a<-table.row.start(a)
a<-table.element(a,i-1,header=TRUE)
a<-table.element(a,round(myacf[i],6))
mytstat <- myacf[i]*sqrtn
a<-table.element(a,round(mytstat,4))
a<-table.element(a,round(1-pt(abs(mytstat),lengthx),6))
a<-table.row.end(a)
}
a<-table.end(a)
table.save(a,file='mytable.tab')
a<-table.start()
a<-table.row.start(a)
a<-table.element(a,'Partial Autocorrelation Function',4,TRUE)
a<-table.row.end(a)
a<-table.row.start(a)
a<-table.element(a,'Time lag k',header=TRUE)
a<-table.element(a,hyperlink('basics.htm','PACF(k)','click here for more information about the Partial Autocorrelation Function'),header=TRUE)
a<-table.element(a,'T-STAT',header=TRUE)
a<-table.element(a,'P-value',header=TRUE)
a<-table.row.end(a)
for (i in 1:par1) {
a<-table.row.start(a)
a<-table.element(a,i,header=TRUE)
a<-table.element(a,round(mypacf[i],6))
mytstat <- mypacf[i]*sqrtn
a<-table.element(a,round(mytstat,4))
a<-table.element(a,round(1-pt(abs(mytstat),lengthx),6))
a<-table.row.end(a)
}
a<-table.end(a)
table.save(a,file='mytable1.tab')