Free Statistics

of Irreproducible Research!

Author's title

Author*Unverified author*
R Software Modulerwasp_exponentialsmoothing.wasp
Title produced by softwareExponential Smoothing
Date of computationWed, 25 Nov 2015 11:29:50 +0000
Cite this page as followsStatistical Computations at FreeStatistics.org, Office for Research Development and Education, URL https://freestatistics.org/blog/index.php?v=date/2015/Nov/25/t1448451009zjp9ioy9dgc19vl.htm/, Retrieved Tue, 21 May 2024 11:52:23 +0000
Statistical Computations at FreeStatistics.org, Office for Research Development and Education, URL https://freestatistics.org/blog/index.php?pk=284114, Retrieved Tue, 21 May 2024 11:52:23 +0000
QR Codes:

Original text written by user:
IsPrivate?No (this computation is public)
User-defined keywords
Estimated Impact90
Family? (F = Feedback message, R = changed R code, M = changed R Module, P = changed Parameters, D = changed Data)
-       [Exponential Smoothing] [] [2015-11-25 11:29:50] [4b96c7bb02a36edde4d8c72e28fc1c90] [Current]
Feedback Forum

Post a new message
Dataseries X:
103,4
103,49
103,51
103,27
103,35
103,34
103,07
103,08
103,1
103,13
103,13
103,18
103,2
103,21
103
102,46
102,52
102,55
102,78
102,81
102,81
102,68
102,72
102,73
102,87
102,93
103,2
102,62
102,18
101,19
100,91
100,72
100,86
100,89
100,47
100,45
100,64
100,63
100,66
100,38
99,68
99,71
99,63
99,63
99,71
99,77
99,76
99,79
98,13
98,13
97,87
97,72
97,72
97,6
97,31
97,31
97,44
96,94
96,94
96,94


Summary of computational transaction
Raw Inputview raw input (R code)
Raw Outputview raw output of R engine
Computing time1 seconds
R Server'Gwilym Jenkins' @ jenkins.wessa.net

\begin{tabular}{lllllllll}
\hline
Summary of computational transaction \tabularnewline
Raw Input & view raw input (R code)  \tabularnewline
Raw Output & view raw output of R engine  \tabularnewline
Computing time & 1 seconds \tabularnewline
R Server & 'Gwilym Jenkins' @ jenkins.wessa.net \tabularnewline
\hline
\end{tabular}
%Source: https://freestatistics.org/blog/index.php?pk=284114&T=0

[TABLE]
[ROW][C]Summary of computational transaction[/C][/ROW]
[ROW][C]Raw Input[/C][C]view raw input (R code) [/C][/ROW]
[ROW][C]Raw Output[/C][C]view raw output of R engine [/C][/ROW]
[ROW][C]Computing time[/C][C]1 seconds[/C][/ROW]
[ROW][C]R Server[/C][C]'Gwilym Jenkins' @ jenkins.wessa.net[/C][/ROW]
[/TABLE]
Source: https://freestatistics.org/blog/index.php?pk=284114&T=0

Globally Unique Identifier (entire table): ba.freestatistics.org/blog/index.php?pk=284114&T=0

As an alternative you can also use a QR Code:  

The GUIDs for individual cells are displayed in the table below:

Summary of computational transaction
Raw Inputview raw input (R code)
Raw Outputview raw output of R engine
Computing time1 seconds
R Server'Gwilym Jenkins' @ jenkins.wessa.net


Estimated Parameters of Exponential Smoothing
ParameterValue
alpha1
beta0.0295263390496258
gamma0

\begin{tabular}{lllllllll}
\hline
Estimated Parameters of Exponential Smoothing \tabularnewline
Parameter & Value \tabularnewline
alpha & 1 \tabularnewline
beta & 0.0295263390496258 \tabularnewline
gamma & 0 \tabularnewline
\hline
\end{tabular}
%Source: https://freestatistics.org/blog/index.php?pk=284114&T=1

[TABLE]
[ROW][C]Estimated Parameters of Exponential Smoothing[/C][/ROW]
[ROW][C]Parameter[/C][C]Value[/C][/ROW]
[ROW][C]alpha[/C][C]1[/C][/ROW]
[ROW][C]beta[/C][C]0.0295263390496258[/C][/ROW]
[ROW][C]gamma[/C][C]0[/C][/ROW]
[/TABLE]
Source: https://freestatistics.org/blog/index.php?pk=284114&T=1

Globally Unique Identifier (entire table): ba.freestatistics.org/blog/index.php?pk=284114&T=1

As an alternative you can also use a QR Code:  

The GUIDs for individual cells are displayed in the table below:

Estimated Parameters of Exponential Smoothing
ParameterValue
alpha1
beta0.0295263390496258
gamma0


Interpolation Forecasts of Exponential Smoothing
tObservedFittedResiduals
13103.2103.539716880342-0.339716880341911
14103.21103.1812077491980.0287922508015157
15103102.9720578789580.0279421210423436
16102.46102.4403829074970.0196170925026848
17102.52102.5059621284220.0140378715782816
18102.55102.5363766153770.0136233846225338
19102.78102.5830288640510.196971135949198
20102.81102.7667613672610.0432386327394738
21102.81102.820954712458-0.0109547124575045
22102.68102.852714593237-0.172714593236634
23102.72102.7009482969310.0190517030687545
24102.73102.790677490642-0.0606774906421919
25102.87102.7463859064810.12361409351918
26102.93102.8583691114510.0716308885493078
27103.2102.7004841093520.499515890647558
28102.62102.6627329849-0.0427329849003542
29102.18102.6864712363-0.506471236299603
30101.19102.201516994858-1.01151699485773
31100.91101.197900601113-0.287900601113066
32100.72100.857316617019-0.137316617018712
33100.86100.6861788266940.173821173305868
34100.89100.8633944629250.026605537075497
35100.47100.877513360366-0.407513360366124
36100.45100.494647649387-0.0446476493873718
37100.64100.4208293677540.219170632246204
38100.63100.5856340074850.044365992515452
39100.66100.3569439728220.303056027178158
40100.38100.0733921078310.306607892168685
4199.68100.407445116411-0.727445116410792
4299.7199.65596632526360.0540336747363455
4399.6399.703811741864-0.0738117418639774
4499.6399.56954901801460.06045098198544
4599.7199.59425058087120.11574941912879
4699.7799.70975157079850.0602484292014651
4799.7699.75486381967970.00513618032033492
4899.7999.7941821389479-0.00418213894791108
4998.1399.7715586556954-1.64155865569539
5098.1398.03142277159080.0985772284091979
5197.8797.81433339625940.0556666037406188
5297.7297.23347702727520.486522972724828
5397.7297.70284226952330.0171577304767112
5497.697.6733488744906-0.0733488744906481
5597.3197.5674331507535-0.257433150753485
5697.3197.21774875892840.0922512410715655
5797.4497.24338926701670.196610732983274
5896.9497.4112777955129-0.471277795512933
5996.9496.88069602086940.0593039791306182
6096.9496.93161371693090.00838628306914302

\begin{tabular}{lllllllll}
\hline
Interpolation Forecasts of Exponential Smoothing \tabularnewline
t & Observed & Fitted & Residuals \tabularnewline
13 & 103.2 & 103.539716880342 & -0.339716880341911 \tabularnewline
14 & 103.21 & 103.181207749198 & 0.0287922508015157 \tabularnewline
15 & 103 & 102.972057878958 & 0.0279421210423436 \tabularnewline
16 & 102.46 & 102.440382907497 & 0.0196170925026848 \tabularnewline
17 & 102.52 & 102.505962128422 & 0.0140378715782816 \tabularnewline
18 & 102.55 & 102.536376615377 & 0.0136233846225338 \tabularnewline
19 & 102.78 & 102.583028864051 & 0.196971135949198 \tabularnewline
20 & 102.81 & 102.766761367261 & 0.0432386327394738 \tabularnewline
21 & 102.81 & 102.820954712458 & -0.0109547124575045 \tabularnewline
22 & 102.68 & 102.852714593237 & -0.172714593236634 \tabularnewline
23 & 102.72 & 102.700948296931 & 0.0190517030687545 \tabularnewline
24 & 102.73 & 102.790677490642 & -0.0606774906421919 \tabularnewline
25 & 102.87 & 102.746385906481 & 0.12361409351918 \tabularnewline
26 & 102.93 & 102.858369111451 & 0.0716308885493078 \tabularnewline
27 & 103.2 & 102.700484109352 & 0.499515890647558 \tabularnewline
28 & 102.62 & 102.6627329849 & -0.0427329849003542 \tabularnewline
29 & 102.18 & 102.6864712363 & -0.506471236299603 \tabularnewline
30 & 101.19 & 102.201516994858 & -1.01151699485773 \tabularnewline
31 & 100.91 & 101.197900601113 & -0.287900601113066 \tabularnewline
32 & 100.72 & 100.857316617019 & -0.137316617018712 \tabularnewline
33 & 100.86 & 100.686178826694 & 0.173821173305868 \tabularnewline
34 & 100.89 & 100.863394462925 & 0.026605537075497 \tabularnewline
35 & 100.47 & 100.877513360366 & -0.407513360366124 \tabularnewline
36 & 100.45 & 100.494647649387 & -0.0446476493873718 \tabularnewline
37 & 100.64 & 100.420829367754 & 0.219170632246204 \tabularnewline
38 & 100.63 & 100.585634007485 & 0.044365992515452 \tabularnewline
39 & 100.66 & 100.356943972822 & 0.303056027178158 \tabularnewline
40 & 100.38 & 100.073392107831 & 0.306607892168685 \tabularnewline
41 & 99.68 & 100.407445116411 & -0.727445116410792 \tabularnewline
42 & 99.71 & 99.6559663252636 & 0.0540336747363455 \tabularnewline
43 & 99.63 & 99.703811741864 & -0.0738117418639774 \tabularnewline
44 & 99.63 & 99.5695490180146 & 0.06045098198544 \tabularnewline
45 & 99.71 & 99.5942505808712 & 0.11574941912879 \tabularnewline
46 & 99.77 & 99.7097515707985 & 0.0602484292014651 \tabularnewline
47 & 99.76 & 99.7548638196797 & 0.00513618032033492 \tabularnewline
48 & 99.79 & 99.7941821389479 & -0.00418213894791108 \tabularnewline
49 & 98.13 & 99.7715586556954 & -1.64155865569539 \tabularnewline
50 & 98.13 & 98.0314227715908 & 0.0985772284091979 \tabularnewline
51 & 97.87 & 97.8143333962594 & 0.0556666037406188 \tabularnewline
52 & 97.72 & 97.2334770272752 & 0.486522972724828 \tabularnewline
53 & 97.72 & 97.7028422695233 & 0.0171577304767112 \tabularnewline
54 & 97.6 & 97.6733488744906 & -0.0733488744906481 \tabularnewline
55 & 97.31 & 97.5674331507535 & -0.257433150753485 \tabularnewline
56 & 97.31 & 97.2177487589284 & 0.0922512410715655 \tabularnewline
57 & 97.44 & 97.2433892670167 & 0.196610732983274 \tabularnewline
58 & 96.94 & 97.4112777955129 & -0.471277795512933 \tabularnewline
59 & 96.94 & 96.8806960208694 & 0.0593039791306182 \tabularnewline
60 & 96.94 & 96.9316137169309 & 0.00838628306914302 \tabularnewline
\hline
\end{tabular}
%Source: https://freestatistics.org/blog/index.php?pk=284114&T=2

[TABLE]
[ROW][C]Interpolation Forecasts of Exponential Smoothing[/C][/ROW]
[ROW][C]t[/C][C]Observed[/C][C]Fitted[/C][C]Residuals[/C][/ROW]
[ROW][C]13[/C][C]103.2[/C][C]103.539716880342[/C][C]-0.339716880341911[/C][/ROW]
[ROW][C]14[/C][C]103.21[/C][C]103.181207749198[/C][C]0.0287922508015157[/C][/ROW]
[ROW][C]15[/C][C]103[/C][C]102.972057878958[/C][C]0.0279421210423436[/C][/ROW]
[ROW][C]16[/C][C]102.46[/C][C]102.440382907497[/C][C]0.0196170925026848[/C][/ROW]
[ROW][C]17[/C][C]102.52[/C][C]102.505962128422[/C][C]0.0140378715782816[/C][/ROW]
[ROW][C]18[/C][C]102.55[/C][C]102.536376615377[/C][C]0.0136233846225338[/C][/ROW]
[ROW][C]19[/C][C]102.78[/C][C]102.583028864051[/C][C]0.196971135949198[/C][/ROW]
[ROW][C]20[/C][C]102.81[/C][C]102.766761367261[/C][C]0.0432386327394738[/C][/ROW]
[ROW][C]21[/C][C]102.81[/C][C]102.820954712458[/C][C]-0.0109547124575045[/C][/ROW]
[ROW][C]22[/C][C]102.68[/C][C]102.852714593237[/C][C]-0.172714593236634[/C][/ROW]
[ROW][C]23[/C][C]102.72[/C][C]102.700948296931[/C][C]0.0190517030687545[/C][/ROW]
[ROW][C]24[/C][C]102.73[/C][C]102.790677490642[/C][C]-0.0606774906421919[/C][/ROW]
[ROW][C]25[/C][C]102.87[/C][C]102.746385906481[/C][C]0.12361409351918[/C][/ROW]
[ROW][C]26[/C][C]102.93[/C][C]102.858369111451[/C][C]0.0716308885493078[/C][/ROW]
[ROW][C]27[/C][C]103.2[/C][C]102.700484109352[/C][C]0.499515890647558[/C][/ROW]
[ROW][C]28[/C][C]102.62[/C][C]102.6627329849[/C][C]-0.0427329849003542[/C][/ROW]
[ROW][C]29[/C][C]102.18[/C][C]102.6864712363[/C][C]-0.506471236299603[/C][/ROW]
[ROW][C]30[/C][C]101.19[/C][C]102.201516994858[/C][C]-1.01151699485773[/C][/ROW]
[ROW][C]31[/C][C]100.91[/C][C]101.197900601113[/C][C]-0.287900601113066[/C][/ROW]
[ROW][C]32[/C][C]100.72[/C][C]100.857316617019[/C][C]-0.137316617018712[/C][/ROW]
[ROW][C]33[/C][C]100.86[/C][C]100.686178826694[/C][C]0.173821173305868[/C][/ROW]
[ROW][C]34[/C][C]100.89[/C][C]100.863394462925[/C][C]0.026605537075497[/C][/ROW]
[ROW][C]35[/C][C]100.47[/C][C]100.877513360366[/C][C]-0.407513360366124[/C][/ROW]
[ROW][C]36[/C][C]100.45[/C][C]100.494647649387[/C][C]-0.0446476493873718[/C][/ROW]
[ROW][C]37[/C][C]100.64[/C][C]100.420829367754[/C][C]0.219170632246204[/C][/ROW]
[ROW][C]38[/C][C]100.63[/C][C]100.585634007485[/C][C]0.044365992515452[/C][/ROW]
[ROW][C]39[/C][C]100.66[/C][C]100.356943972822[/C][C]0.303056027178158[/C][/ROW]
[ROW][C]40[/C][C]100.38[/C][C]100.073392107831[/C][C]0.306607892168685[/C][/ROW]
[ROW][C]41[/C][C]99.68[/C][C]100.407445116411[/C][C]-0.727445116410792[/C][/ROW]
[ROW][C]42[/C][C]99.71[/C][C]99.6559663252636[/C][C]0.0540336747363455[/C][/ROW]
[ROW][C]43[/C][C]99.63[/C][C]99.703811741864[/C][C]-0.0738117418639774[/C][/ROW]
[ROW][C]44[/C][C]99.63[/C][C]99.5695490180146[/C][C]0.06045098198544[/C][/ROW]
[ROW][C]45[/C][C]99.71[/C][C]99.5942505808712[/C][C]0.11574941912879[/C][/ROW]
[ROW][C]46[/C][C]99.77[/C][C]99.7097515707985[/C][C]0.0602484292014651[/C][/ROW]
[ROW][C]47[/C][C]99.76[/C][C]99.7548638196797[/C][C]0.00513618032033492[/C][/ROW]
[ROW][C]48[/C][C]99.79[/C][C]99.7941821389479[/C][C]-0.00418213894791108[/C][/ROW]
[ROW][C]49[/C][C]98.13[/C][C]99.7715586556954[/C][C]-1.64155865569539[/C][/ROW]
[ROW][C]50[/C][C]98.13[/C][C]98.0314227715908[/C][C]0.0985772284091979[/C][/ROW]
[ROW][C]51[/C][C]97.87[/C][C]97.8143333962594[/C][C]0.0556666037406188[/C][/ROW]
[ROW][C]52[/C][C]97.72[/C][C]97.2334770272752[/C][C]0.486522972724828[/C][/ROW]
[ROW][C]53[/C][C]97.72[/C][C]97.7028422695233[/C][C]0.0171577304767112[/C][/ROW]
[ROW][C]54[/C][C]97.6[/C][C]97.6733488744906[/C][C]-0.0733488744906481[/C][/ROW]
[ROW][C]55[/C][C]97.31[/C][C]97.5674331507535[/C][C]-0.257433150753485[/C][/ROW]
[ROW][C]56[/C][C]97.31[/C][C]97.2177487589284[/C][C]0.0922512410715655[/C][/ROW]
[ROW][C]57[/C][C]97.44[/C][C]97.2433892670167[/C][C]0.196610732983274[/C][/ROW]
[ROW][C]58[/C][C]96.94[/C][C]97.4112777955129[/C][C]-0.471277795512933[/C][/ROW]
[ROW][C]59[/C][C]96.94[/C][C]96.8806960208694[/C][C]0.0593039791306182[/C][/ROW]
[ROW][C]60[/C][C]96.94[/C][C]96.9316137169309[/C][C]0.00838628306914302[/C][/ROW]
[/TABLE]
Source: https://freestatistics.org/blog/index.php?pk=284114&T=2

Globally Unique Identifier (entire table): ba.freestatistics.org/blog/index.php?pk=284114&T=2

As an alternative you can also use a QR Code:  

The GUIDs for individual cells are displayed in the table below:

Interpolation Forecasts of Exponential Smoothing
tObservedFittedResiduals
13103.2103.539716880342-0.339716880341911
14103.21103.1812077491980.0287922508015157
15103102.9720578789580.0279421210423436
16102.46102.4403829074970.0196170925026848
17102.52102.5059621284220.0140378715782816
18102.55102.5363766153770.0136233846225338
19102.78102.5830288640510.196971135949198
20102.81102.7667613672610.0432386327394738
21102.81102.820954712458-0.0109547124575045
22102.68102.852714593237-0.172714593236634
23102.72102.7009482969310.0190517030687545
24102.73102.790677490642-0.0606774906421919
25102.87102.7463859064810.12361409351918
26102.93102.8583691114510.0716308885493078
27103.2102.7004841093520.499515890647558
28102.62102.6627329849-0.0427329849003542
29102.18102.6864712363-0.506471236299603
30101.19102.201516994858-1.01151699485773
31100.91101.197900601113-0.287900601113066
32100.72100.857316617019-0.137316617018712
33100.86100.6861788266940.173821173305868
34100.89100.8633944629250.026605537075497
35100.47100.877513360366-0.407513360366124
36100.45100.494647649387-0.0446476493873718
37100.64100.4208293677540.219170632246204
38100.63100.5856340074850.044365992515452
39100.66100.3569439728220.303056027178158
40100.38100.0733921078310.306607892168685
4199.68100.407445116411-0.727445116410792
4299.7199.65596632526360.0540336747363455
4399.6399.703811741864-0.0738117418639774
4499.6399.56954901801460.06045098198544
4599.7199.59425058087120.11574941912879
4699.7799.70975157079850.0602484292014651
4799.7699.75486381967970.00513618032033492
4899.7999.7941821389479-0.00418213894791108
4998.1399.7715586556954-1.64155865569539
5098.1398.03142277159080.0985772284091979
5197.8797.81433339625940.0556666037406188
5297.7297.23347702727520.486522972724828
5397.7297.70284226952330.0171577304767112
5497.697.6733488744906-0.0733488744906481
5597.3197.5674331507535-0.257433150753485
5697.3197.21774875892840.0922512410715655
5797.4497.24338926701670.196610732983274
5896.9497.4112777955129-0.471277795512933
5996.9496.88069602086940.0593039791306182
6096.9496.93161371693090.00838628306914302


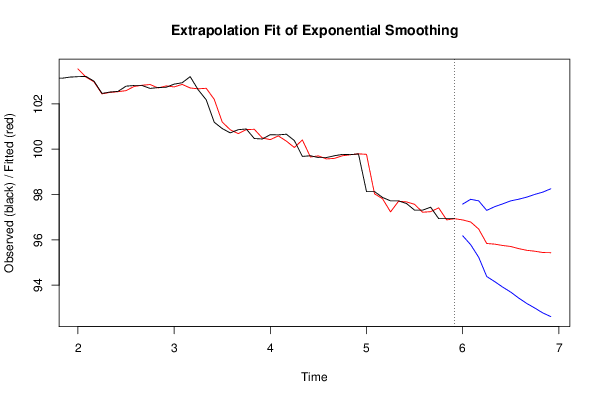
Extrapolation Forecasts of Exponential Smoothing
tForecast95% Lower Bound95% Upper Bound
6196.879361333168196.181357183867197.5773654824691
6296.787055999669695.785249940739897.7888620585994
6396.47475066617195.229734093842597.7197672384996
6495.839945332672594.381380300524197.2985103648209
6595.810139999173994.155902426701597.4643775716464
6695.750334665675493.912350512189597.5883188191613
6795.706779332176893.693495233139997.7200634312137
6895.611140665344993.428772045093297.7935092855967
6995.538418665179793.191655991684497.885181338675
7095.497779998347892.990221600192298.0053383965035
7195.440474664849392.774908210682198.1060411190164
7295.432335998017492.610930186450698.2537418095842

\begin{tabular}{lllllllll}
\hline
Extrapolation Forecasts of Exponential Smoothing \tabularnewline
t & Forecast & 95% Lower Bound & 95% Upper Bound \tabularnewline
61 & 96.8793613331681 & 96.1813571838671 & 97.5773654824691 \tabularnewline
62 & 96.7870559996696 & 95.7852499407398 & 97.7888620585994 \tabularnewline
63 & 96.474750666171 & 95.2297340938425 & 97.7197672384996 \tabularnewline
64 & 95.8399453326725 & 94.3813803005241 & 97.2985103648209 \tabularnewline
65 & 95.8101399991739 & 94.1559024267015 & 97.4643775716464 \tabularnewline
66 & 95.7503346656754 & 93.9123505121895 & 97.5883188191613 \tabularnewline
67 & 95.7067793321768 & 93.6934952331399 & 97.7200634312137 \tabularnewline
68 & 95.6111406653449 & 93.4287720450932 & 97.7935092855967 \tabularnewline
69 & 95.5384186651797 & 93.1916559916844 & 97.885181338675 \tabularnewline
70 & 95.4977799983478 & 92.9902216001922 & 98.0053383965035 \tabularnewline
71 & 95.4404746648493 & 92.7749082106821 & 98.1060411190164 \tabularnewline
72 & 95.4323359980174 & 92.6109301864506 & 98.2537418095842 \tabularnewline
\hline
\end{tabular}
%Source: https://freestatistics.org/blog/index.php?pk=284114&T=3

[TABLE]
[ROW][C]Extrapolation Forecasts of Exponential Smoothing[/C][/ROW]
[ROW][C]t[/C][C]Forecast[/C][C]95% Lower Bound[/C][C]95% Upper Bound[/C][/ROW]
[ROW][C]61[/C][C]96.8793613331681[/C][C]96.1813571838671[/C][C]97.5773654824691[/C][/ROW]
[ROW][C]62[/C][C]96.7870559996696[/C][C]95.7852499407398[/C][C]97.7888620585994[/C][/ROW]
[ROW][C]63[/C][C]96.474750666171[/C][C]95.2297340938425[/C][C]97.7197672384996[/C][/ROW]
[ROW][C]64[/C][C]95.8399453326725[/C][C]94.3813803005241[/C][C]97.2985103648209[/C][/ROW]
[ROW][C]65[/C][C]95.8101399991739[/C][C]94.1559024267015[/C][C]97.4643775716464[/C][/ROW]
[ROW][C]66[/C][C]95.7503346656754[/C][C]93.9123505121895[/C][C]97.5883188191613[/C][/ROW]
[ROW][C]67[/C][C]95.7067793321768[/C][C]93.6934952331399[/C][C]97.7200634312137[/C][/ROW]
[ROW][C]68[/C][C]95.6111406653449[/C][C]93.4287720450932[/C][C]97.7935092855967[/C][/ROW]
[ROW][C]69[/C][C]95.5384186651797[/C][C]93.1916559916844[/C][C]97.885181338675[/C][/ROW]
[ROW][C]70[/C][C]95.4977799983478[/C][C]92.9902216001922[/C][C]98.0053383965035[/C][/ROW]
[ROW][C]71[/C][C]95.4404746648493[/C][C]92.7749082106821[/C][C]98.1060411190164[/C][/ROW]
[ROW][C]72[/C][C]95.4323359980174[/C][C]92.6109301864506[/C][C]98.2537418095842[/C][/ROW]
[/TABLE]
Source: https://freestatistics.org/blog/index.php?pk=284114&T=3

Globally Unique Identifier (entire table): ba.freestatistics.org/blog/index.php?pk=284114&T=3

As an alternative you can also use a QR Code:  

The GUIDs for individual cells are displayed in the table below:

Extrapolation Forecasts of Exponential Smoothing
tForecast95% Lower Bound95% Upper Bound
6196.879361333168196.181357183867197.5773654824691
6296.787055999669695.785249940739897.7888620585994
6396.47475066617195.229734093842597.7197672384996
6495.839945332672594.381380300524197.2985103648209
6595.810139999173994.155902426701597.4643775716464
6695.750334665675493.912350512189597.5883188191613
6795.706779332176893.693495233139997.7200634312137
6895.611140665344993.428772045093297.7935092855967
6995.538418665179793.191655991684497.885181338675
7095.497779998347892.990221600192298.0053383965035
7195.440474664849392.774908210682198.1060411190164
7295.432335998017492.610930186450698.2537418095842


Parameters (Session):
par1 = 12 ; par2 = Triple ; par3 = additive ;
Parameters (R input):
par1 = 12 ; par2 = Triple ; par3 = additive ;
R code (references can be found in the software module):
par1 <- as.numeric(par1)
if (par2 == 'Single') K <- 1
if (par2 == 'Double') K <- 2
if (par2 == 'Triple') K <- par1
nx <- length(x)
nxmK <- nx - K
x <- ts(x, frequency = par1)
if (par2 == 'Single') fit <- HoltWinters(x, gamma=F, beta=F)
if (par2 == 'Double') fit <- HoltWinters(x, gamma=F)
if (par2 == 'Triple') fit <- HoltWinters(x, seasonal=par3)
fit
myresid <- x - fit$fitted[,'xhat']
bitmap(file='test1.png')
op <- par(mfrow=c(2,1))
plot(fit,ylab='Observed (black) / Fitted (red)',main='Interpolation Fit of Exponential Smoothing')
plot(myresid,ylab='Residuals',main='Interpolation Prediction Errors')
par(op)
dev.off()
bitmap(file='test2.png')
p <- predict(fit, par1, prediction.interval=TRUE)
np <- length(p[,1])
plot(fit,p,ylab='Observed (black) / Fitted (red)',main='Extrapolation Fit of Exponential Smoothing')
dev.off()
bitmap(file='test3.png')
op <- par(mfrow = c(2,2))
acf(as.numeric(myresid),lag.max = nx/2,main='Residual ACF')
spectrum(myresid,main='Residals Periodogram')
cpgram(myresid,main='Residal Cumulative Periodogram')
qqnorm(myresid,main='Residual Normal QQ Plot')
qqline(myresid)
par(op)
dev.off()
load(file='createtable')
a<-table.start()
a<-table.row.start(a)
a<-table.element(a,'Estimated Parameters of Exponential Smoothing',2,TRUE)
a<-table.row.end(a)
a<-table.row.start(a)
a<-table.element(a,'Parameter',header=TRUE)
a<-table.element(a,'Value',header=TRUE)
a<-table.row.end(a)
a<-table.row.start(a)
a<-table.element(a,'alpha',header=TRUE)
a<-table.element(a,fit$alpha)
a<-table.row.end(a)
a<-table.row.start(a)
a<-table.element(a,'beta',header=TRUE)
a<-table.element(a,fit$beta)
a<-table.row.end(a)
a<-table.row.start(a)
a<-table.element(a,'gamma',header=TRUE)
a<-table.element(a,fit$gamma)
a<-table.row.end(a)
a<-table.end(a)
table.save(a,file='mytable.tab')
a<-table.start()
a<-table.row.start(a)
a<-table.element(a,'Interpolation Forecasts of Exponential Smoothing',4,TRUE)
a<-table.row.end(a)
a<-table.row.start(a)
a<-table.element(a,'t',header=TRUE)
a<-table.element(a,'Observed',header=TRUE)
a<-table.element(a,'Fitted',header=TRUE)
a<-table.element(a,'Residuals',header=TRUE)
a<-table.row.end(a)
for (i in 1:nxmK) {
a<-table.row.start(a)
a<-table.element(a,i+K,header=TRUE)
a<-table.element(a,x[i+K])
a<-table.element(a,fit$fitted[i,'xhat'])
a<-table.element(a,myresid[i])
a<-table.row.end(a)
}
a<-table.end(a)
table.save(a,file='mytable1.tab')
a<-table.start()
a<-table.row.start(a)
a<-table.element(a,'Extrapolation Forecasts of Exponential Smoothing',4,TRUE)
a<-table.row.end(a)
a<-table.row.start(a)
a<-table.element(a,'t',header=TRUE)
a<-table.element(a,'Forecast',header=TRUE)
a<-table.element(a,'95% Lower Bound',header=TRUE)
a<-table.element(a,'95% Upper Bound',header=TRUE)
a<-table.row.end(a)
for (i in 1:np) {
a<-table.row.start(a)
a<-table.element(a,nx+i,header=TRUE)
a<-table.element(a,p[i,'fit'])
a<-table.element(a,p[i,'lwr'])
a<-table.element(a,p[i,'upr'])
a<-table.row.end(a)
}
a<-table.end(a)
table.save(a,file='mytable2.tab')