Free Statistics

of Irreproducible Research!

Author's title

Author*The author of this computation has been verified*
R Software Modulerwasp_density.wasp
Title produced by softwareKernel Density Estimation
Date of computationWed, 25 Nov 2015 10:25:05 +0000
Cite this page as followsStatistical Computations at FreeStatistics.org, Office for Research Development and Education, URL https://freestatistics.org/blog/index.php?v=date/2015/Nov/25/t1448447271n0wq3oolmaf765d.htm/, Retrieved Wed, 22 May 2024 00:44:38 +0000
Statistical Computations at FreeStatistics.org, Office for Research Development and Education, URL https://freestatistics.org/blog/index.php?pk=284083, Retrieved Wed, 22 May 2024 00:44:38 +0000
QR Codes:

Original text written by user:
IsPrivate?No (this computation is public)
User-defined keywords
Estimated Impact120
Family? (F = Feedback message, R = changed R code, M = changed R Module, P = changed Parameters, D = changed Data)
-     [Kernel Density Estimation] [] [2015-09-26 09:35:08] [32b17a345b130fdf5cc88718ed94a974]
- R PD    [Kernel Density Estimation] [Gaussian Kernel D...] [2015-11-25 10:25:05] [ff6d1090be03ecb1ea559b1add2eb09a] [Current]
-    D      [Kernel Density Estimation] [Gaussian Kernel D...] [2015-11-25 10:43:19] [9f1f97f94b06139fcd2f81db6b062425]
Feedback Forum

Post a new message
Dataseries X:
235
403
407
235
221
386
403
360
345
408
232
251
359
436
387
405
381
239
227
407
420
370
385
423
214
237
387
408
405
401
409
231
255
349
401
417
417
397
227
229
358
401
392
392
430
258
234
397
394
351
399
374
219
207
375
396
400
382
400
198
209
332
346
348
355
361
234
206
386
417
408
384
386
243
233
391
374
368
387
387
231
243
399
394
395
387
395
220
202
374
415
381
417
421
222
217
370
363
361
387
358
206
241
370
376
357
362
370
221
217
244
414
383
414
401
233
202
430
379
374
221
374
208
204
416
412
418
384
412
248
230
367
412
390
386
377
222
206
376
379
382
420
414
210
229
376
472
458
220
338
216
243
438
439
415
420
432
261
266
249
409
442
417
357
232
226
385
419
382
370
387
241
245
393
417
393
435
389
247
260
396
413
387
417
436
236
253
412
388
402
384
397
200
243
394
409
381
455
448
268
251
270
416
445
424
382
233
239
383
440
392
442
428
233
266
407
416
425
431
410
225
268
417
403
408
420
250
202
247
366
395
419
387
378
229
215
405
404
382
408
389
243
227
374
398
379
403
434
226
223
394
402
392
413
413
239
239
403
418
374
406
420
231
227
368
446
425
363
403
224
243
395
449
424
362
372
224
245
353
389
401
391
418
208
228
373
395
380
406
370
220
221
371
377
366
379
382
231
203
326
381
349
338
366
220
215
359
388
363
384
393
198
214
385
222
380
393
390
227
235
376
400
349
379
386
226
215
363
378
370
398
377
197
220
351
393
331
353
323
212
224
357
380
381
386
399
213
214
307
376
375
443
423
247
208
378
427
319
199
336
218
197
354
365
261


Summary of computational transaction
Raw Inputview raw input (R code)
Raw Outputview raw output of R engine
Computing time3 seconds
R Server'George Udny Yule' @ yule.wessa.net

\begin{tabular}{lllllllll}
\hline
Summary of computational transaction \tabularnewline
Raw Input & view raw input (R code)  \tabularnewline
Raw Output & view raw output of R engine  \tabularnewline
Computing time & 3 seconds \tabularnewline
R Server & 'George Udny Yule' @ yule.wessa.net \tabularnewline
\hline
\end{tabular}
%Source: https://freestatistics.org/blog/index.php?pk=284083&T=0

[TABLE]
[ROW][C]Summary of computational transaction[/C][/ROW]
[ROW][C]Raw Input[/C][C]view raw input (R code) [/C][/ROW]
[ROW][C]Raw Output[/C][C]view raw output of R engine [/C][/ROW]
[ROW][C]Computing time[/C][C]3 seconds[/C][/ROW]
[ROW][C]R Server[/C][C]'George Udny Yule' @ yule.wessa.net[/C][/ROW]
[/TABLE]
Source: https://freestatistics.org/blog/index.php?pk=284083&T=0

Globally Unique Identifier (entire table): ba.freestatistics.org/blog/index.php?pk=284083&T=0

As an alternative you can also use a QR Code:  

The GUIDs for individual cells are displayed in the table below:

Summary of computational transaction
Raw Inputview raw input (R code)
Raw Outputview raw output of R engine
Computing time3 seconds
R Server'George Udny Yule' @ yule.wessa.net


Properties of Density Trace
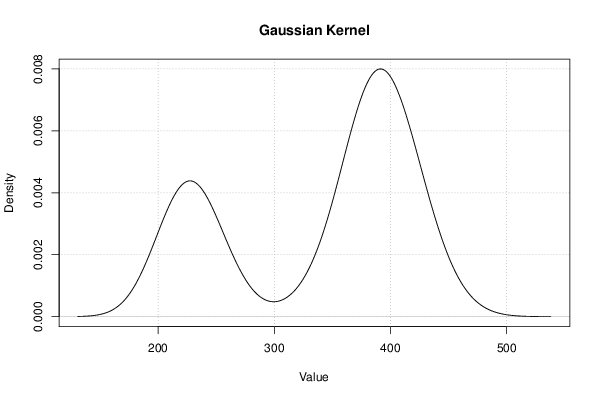
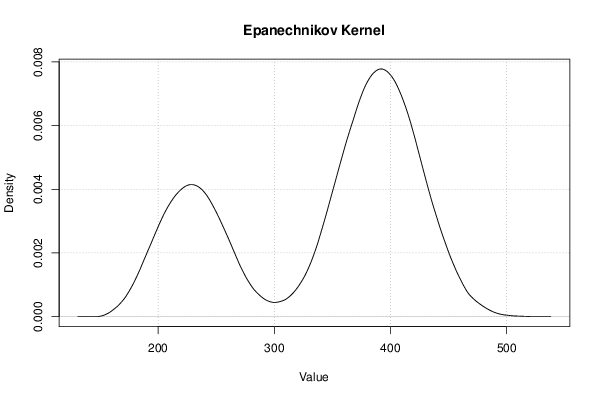
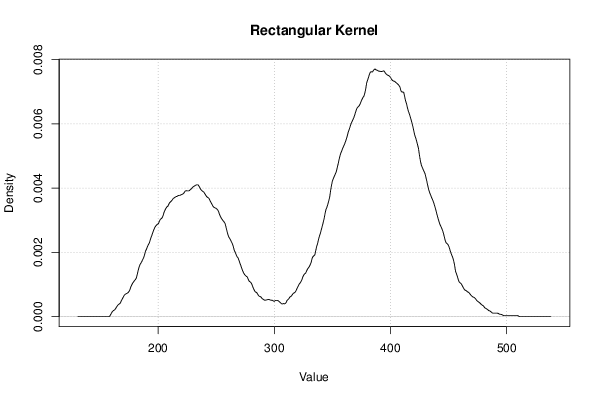
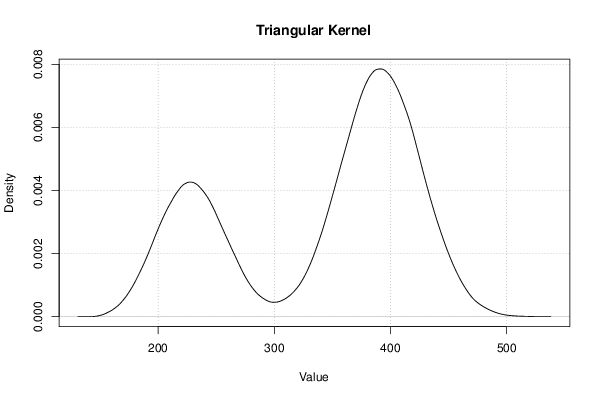
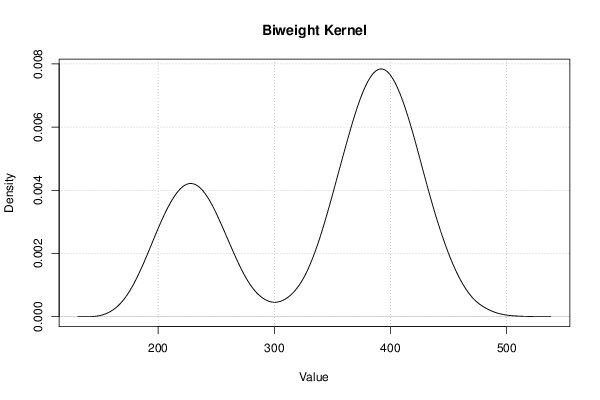
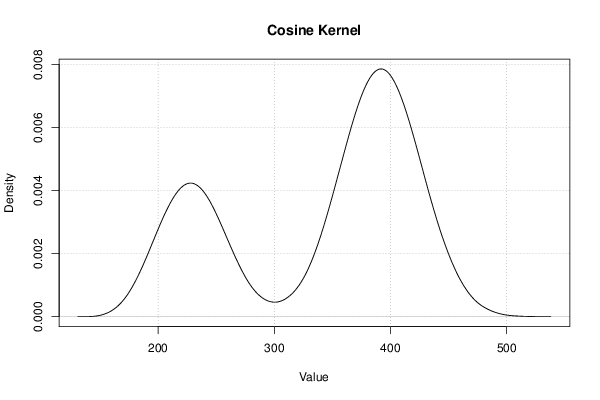
Bandwidth22.0075186692142
#Observations365

\begin{tabular}{lllllllll}
\hline
Properties of Density Trace \tabularnewline
Bandwidth & 22.0075186692142 \tabularnewline
#Observations & 365 \tabularnewline
\hline
\end{tabular}
%Source: https://freestatistics.org/blog/index.php?pk=284083&T=1

[TABLE]
[ROW][C]Properties of Density Trace[/C][/ROW]
[ROW][C]Bandwidth[/C][C]22.0075186692142[/C][/ROW]
[ROW][C]#Observations[/C][C]365[/C][/ROW]
[/TABLE]
Source: https://freestatistics.org/blog/index.php?pk=284083&T=1

Globally Unique Identifier (entire table): ba.freestatistics.org/blog/index.php?pk=284083&T=1

As an alternative you can also use a QR Code:  

The GUIDs for individual cells are displayed in the table below:

Properties of Density Trace
Bandwidth22.0075186692142
#Observations365


Maximum Density Values
Kernelx-valuemax. density
Gaussian391.4544530510620.00799741072550751
Epanechnikov392.2510188280.00778100323156058
Rectangular386.6750583894350.00770743335307087
Triangular391.4544530510620.00785381478963283
Biweight392.2510188280.00784048740931062
Cosine392.2510188280.00786211612366323
Optcosine392.2510188280.00779773983853036

\begin{tabular}{lllllllll}
\hline
Maximum Density Values \tabularnewline
Kernel & x-value & max. density \tabularnewline
Gaussian & 391.454453051062 & 0.00799741072550751 \tabularnewline
Epanechnikov & 392.251018828 & 0.00778100323156058 \tabularnewline
Rectangular & 386.675058389435 & 0.00770743335307087 \tabularnewline
Triangular & 391.454453051062 & 0.00785381478963283 \tabularnewline
Biweight & 392.251018828 & 0.00784048740931062 \tabularnewline
Cosine & 392.251018828 & 0.00786211612366323 \tabularnewline
Optcosine & 392.251018828 & 0.00779773983853036 \tabularnewline
\hline
\end{tabular}
%Source: https://freestatistics.org/blog/index.php?pk=284083&T=2

[TABLE]
[ROW][C]Maximum Density Values[/C][/ROW]
[ROW][C]Kernel[/C][C]x-value[/C][C]max. density[/C][/ROW]
[ROW][C]Gaussian[/C][C]391.454453051062[/C][C]0.00799741072550751[/C][/ROW]
[ROW][C]Epanechnikov[/C][C]392.251018828[/C][C]0.00778100323156058[/C][/ROW]
[ROW][C]Rectangular[/C][C]386.675058389435[/C][C]0.00770743335307087[/C][/ROW]
[ROW][C]Triangular[/C][C]391.454453051062[/C][C]0.00785381478963283[/C][/ROW]
[ROW][C]Biweight[/C][C]392.251018828[/C][C]0.00784048740931062[/C][/ROW]
[ROW][C]Cosine[/C][C]392.251018828[/C][C]0.00786211612366323[/C][/ROW]
[ROW][C]Optcosine[/C][C]392.251018828[/C][C]0.00779773983853036[/C][/ROW]
[/TABLE]
Source: https://freestatistics.org/blog/index.php?pk=284083&T=2

Globally Unique Identifier (entire table): ba.freestatistics.org/blog/index.php?pk=284083&T=2

As an alternative you can also use a QR Code:  

The GUIDs for individual cells are displayed in the table below:

Maximum Density Values
Kernelx-valuemax. density
Gaussian391.4544530510620.00799741072550751
Epanechnikov392.2510188280.00778100323156058
Rectangular386.6750583894350.00770743335307087
Triangular391.4544530510620.00785381478963283
Biweight392.2510188280.00784048740931062
Cosine392.2510188280.00786211612366323
Optcosine392.2510188280.00779773983853036


Kernel Density Values
x-valueGaussianEpanechnikovRectangularTriangularBiweightCosineOptcosine
Kernel Density Values are not shown

\begin{tabular}{lllllllll}
\hline
Kernel Density Values \tabularnewline
x-value & Gaussian & Epanechnikov & Rectangular & Triangular & Biweight & Cosine & Optcosine \tabularnewline
Kernel Density Values are not shown \tabularnewline
\hline
\end{tabular}
%Source: https://freestatistics.org/blog/index.php?pk=284083&T=3

[TABLE]
[ROW][C]Kernel Density Values[/C][/ROW]
[ROW][C]x-value[/C][C]Gaussian[/C][C]Epanechnikov[/C][C]Rectangular[/C][C]Triangular[/C][C]Biweight[/C][C]Cosine[/C][C]Optcosine[/C][/ROW]
[ROW][C]Kernel Density Values are not shown[/C][/ROW]
[/TABLE]
Source: https://freestatistics.org/blog/index.php?pk=284083&T=3

Globally Unique Identifier (entire table): ba.freestatistics.org/blog/index.php?pk=284083&T=3

As an alternative you can also use a QR Code:  

The GUIDs for individual cells are displayed in the table below:

Kernel Density Values
x-valueGaussianEpanechnikovRectangularTriangularBiweightCosineOptcosine
Kernel Density Values are not shown


Parameters (Session):
Parameters (R input):
par1 = 0 ; par2 = no ; par3 = 512 ;
R code (references can be found in the software module):
if (par1 == '0') bw <- 'nrd0'
if (par1 != '0') bw <- as.numeric(par1)
par3 <- as.numeric(par3)
mydensity <- array(NA, dim=c(par3,8))
bitmap(file='density1.png')
mydensity1<-density(x,bw=bw,kernel='gaussian',na.rm=TRUE)
mydensity[,8] = signif(mydensity1$x,3)
mydensity[,1] = signif(mydensity1$y,3)
plot(mydensity1,main='Gaussian Kernel',xlab=xlab,ylab=ylab)
grid()
dev.off()
mydensity1
bitmap(file='density2.png')
mydensity2<-density(x,bw=bw,kernel='epanechnikov',na.rm=TRUE)
mydensity[,2] = signif(mydensity2$y,3)
plot(mydensity2,main='Epanechnikov Kernel',xlab=xlab,ylab=ylab)
grid()
dev.off()
bitmap(file='density3.png')
mydensity3<-density(x,bw=bw,kernel='rectangular',na.rm=TRUE)
mydensity[,3] = signif(mydensity3$y,3)
plot(mydensity3,main='Rectangular Kernel',xlab=xlab,ylab=ylab)
grid()
dev.off()
bitmap(file='density4.png')
mydensity4<-density(x,bw=bw,kernel='triangular',na.rm=TRUE)
mydensity[,4] = signif(mydensity4$y,3)
plot(mydensity4,main='Triangular Kernel',xlab=xlab,ylab=ylab)
grid()
dev.off()
bitmap(file='density5.png')
mydensity5<-density(x,bw=bw,kernel='biweight',na.rm=TRUE)
mydensity[,5] = signif(mydensity5$y,3)
plot(mydensity5,main='Biweight Kernel',xlab=xlab,ylab=ylab)
grid()
dev.off()
bitmap(file='density6.png')
mydensity6<-density(x,bw=bw,kernel='cosine',na.rm=TRUE)
mydensity[,6] = signif(mydensity6$y,3)
plot(mydensity6,main='Cosine Kernel',xlab=xlab,ylab=ylab)
grid()
dev.off()
bitmap(file='density7.png')
mydensity7<-density(x,bw=bw,kernel='optcosine',na.rm=TRUE)
mydensity[,7] = signif(mydensity7$y,3)
plot(mydensity7,main='Optcosine Kernel',xlab=xlab,ylab=ylab)
grid()
dev.off()
load(file='createtable')
ab<-table.start()
ab<-table.row.start(ab)
ab<-table.element(ab,'Properties of Density Trace',2,TRUE)
ab<-table.row.end(ab)
ab<-table.row.start(ab)
ab<-table.element(ab,'Bandwidth',header=TRUE)
ab<-table.element(ab,mydensity1$bw)
ab<-table.row.end(ab)
ab<-table.row.start(ab)
ab<-table.element(ab,'#Observations',header=TRUE)
ab<-table.element(ab,mydensity1$n)
ab<-table.row.end(ab)
ab<-table.end(ab)
a <- ab
table.save(ab,file='mytable123.tab')
b<-table.start()
b<-table.row.start(b)
b<-table.element(b,'Maximum Density Values',3,TRUE)
b<-table.row.end(b)
b<-table.row.start(b)
b<-table.element(b,'Kernel',1,TRUE)
b<-table.element(b,'x-value',1,TRUE)
b<-table.element(b,'max. density',1,TRUE)
b<-table.row.end(b)
b<-table.row.start(b)
b<-table.element(b,'Gaussian',1,TRUE)
b<-table.element(b,mydensity1$x[mydensity1$y==max(mydensity1$y)],1)
b<-table.element(b,mydensity1$y[mydensity1$y==max(mydensity1$y)],1)
b<-table.row.end(b)
b<-table.row.start(b)
b<-table.element(b,'Epanechnikov',1,TRUE)
b<-table.element(b,mydensity2$x[mydensity2$y==max(mydensity2$y)],1)
b<-table.element(b,mydensity2$y[mydensity2$y==max(mydensity2$y)],1)
b<-table.row.end(b)
b<-table.row.start(b)
b<-table.element(b,'Rectangular',1,TRUE)
b<-table.element(b,mydensity3$x[mydensity3$y==max(mydensity3$y)],1)
b<-table.element(b,mydensity3$y[mydensity3$y==max(mydensity3$y)],1)
b<-table.row.end(b)
b<-table.row.start(b)
b<-table.element(b,'Triangular',1,TRUE)
b<-table.element(b,mydensity4$x[mydensity4$y==max(mydensity4$y)],1)
b<-table.element(b,mydensity4$y[mydensity4$y==max(mydensity4$y)],1)
b<-table.row.end(b)
b<-table.row.start(b)
b<-table.element(b,'Biweight',1,TRUE)
b<-table.element(b,mydensity5$x[mydensity5$y==max(mydensity5$y)],1)
b<-table.element(b,mydensity5$y[mydensity5$y==max(mydensity5$y)],1)
b<-table.row.end(b)
b<-table.row.start(b)
b<-table.element(b,'Cosine',1,TRUE)
b<-table.element(b,mydensity6$x[mydensity6$y==max(mydensity6$y)],1)
b<-table.element(b,mydensity6$y[mydensity6$y==max(mydensity6$y)],1)
b<-table.row.end(b)
b<-table.row.start(b)
b<-table.element(b,'Optcosine',1,TRUE)
b<-table.element(b,mydensity7$x[mydensity7$y==max(mydensity7$y)],1)
b<-table.element(b,mydensity7$y[mydensity7$y==max(mydensity7$y)],1)
b<-table.row.end(b)
b<-table.end(b)
a <- b[1]
table.save(b,file='mytable2a.tab')
a<-table.start()
a<-table.row.start(a)
a<-table.element(a,'Kernel Density Values',8,TRUE)
a<-table.row.end(a)
a<-table.row.start(a)
a<-table.element(a,'x-value',1,TRUE)
a<-table.element(a,'Gaussian',1,TRUE)
a<-table.element(a,'Epanechnikov',1,TRUE)
a<-table.element(a,'Rectangular',1,TRUE)
a<-table.element(a,'Triangular',1,TRUE)
a<-table.element(a,'Biweight',1,TRUE)
a<-table.element(a,'Cosine',1,TRUE)
a<-table.element(a,'Optcosine',1,TRUE)
a<-table.row.end(a)
if (par2=='yes') {
for(i in 1:par3) {
a<-table.row.start(a)
a<-table.element(a,mydensity[i,8],1,TRUE)
for(j in 1:7) {
a<-table.element(a,mydensity[i,j],1)
}
a<-table.row.end(a)
}
} else {
a<-table.row.start(a)
a<-table.element(a,'Kernel Density Values are not shown',8)
a<-table.row.end(a)
}
a<-table.end(a)
table.save(a,file='mytable1.tab')