Free Statistics

of Irreproducible Research!

Author's title

Author*Unverified author*
R Software Modulerwasp_autocorrelation.wasp
Title produced by software(Partial) Autocorrelation Function
Date of computationThu, 05 Mar 2015 19:10:24 +0000
Cite this page as followsStatistical Computations at FreeStatistics.org, Office for Research Development and Education, URL https://freestatistics.org/blog/index.php?v=date/2015/Mar/05/t14255826657mpoln9zpcy5f0f.htm/, Retrieved Sun, 19 May 2024 10:46:53 +0000
Statistical Computations at FreeStatistics.org, Office for Research Development and Education, URL https://freestatistics.org/blog/index.php?pk=277996, Retrieved Sun, 19 May 2024 10:46:53 +0000
QR Codes:

Original text written by user:
IsPrivate?No (this computation is public)
User-defined keywords
Estimated Impact72
Family? (F = Feedback message, R = changed R code, M = changed R Module, P = changed Parameters, D = changed Data)
-       [(Partial) Autocorrelation Function] [] [2015-03-05 19:10:24] [7281bb56277fa48a38e7263e2ca5f521] [Current]
Feedback Forum

Post a new message
Dataseries X:
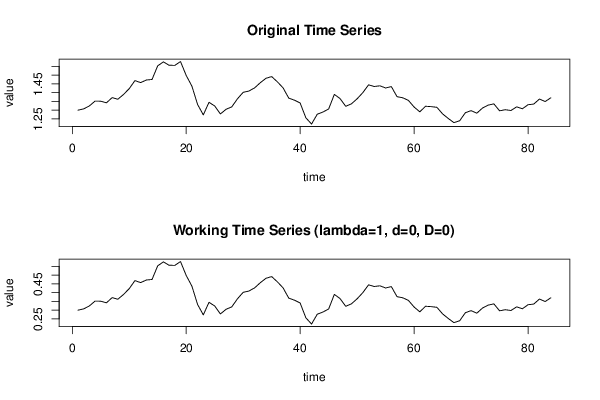
1,2999
1,3074
1,3242
1,3516
1,3511
1,3419
1,3716
1,3622
1,3896
1,4227
1,4684
1,457
1,4718
1,4748
1,5527
1,5751
1,5557
1,5553
1,577
1,4975
1,4369
1,3322
1,2732
1,3449
1,3239
1,2785
1,305
1,319
1,365
1,4016
1,4088
1,4268
1,4562
1,4816
1,4914
1,4614
1,4272
1,3686
1,3569
1,3406
1,2565
1,2209
1,277
1,2894
1,3067
1,3898
1,3661
1,322
1,336
1,3649
1,3999
1,4442
1,4349
1,4388
1,4264
1,4343
1,377
1,3706
1,3556
1,3179
1,2905
1,3224
1,3201
1,3162
1,2789
1,2526
1,2288
1,24
1,2856
1,2974
1,2828
1,3119
1,3288
1,3359
1,2964
1,3026
1,2982
1,3189
1,308
1,331
1,3348
1,3635
1,3493
1,3704


Summary of computational transaction
Raw Inputview raw input (R code)
Raw Outputview raw output of R engine
Computing time2 seconds
R Server'Sir Ronald Aylmer Fisher' @ fisher.wessa.net

\begin{tabular}{lllllllll}
\hline
Summary of computational transaction \tabularnewline
Raw Input & view raw input (R code)  \tabularnewline
Raw Output & view raw output of R engine  \tabularnewline
Computing time & 2 seconds \tabularnewline
R Server & 'Sir Ronald Aylmer Fisher' @ fisher.wessa.net \tabularnewline
\hline
\end{tabular}
%Source: https://freestatistics.org/blog/index.php?pk=277996&T=0

[TABLE]
[ROW][C]Summary of computational transaction[/C][/ROW]
[ROW][C]Raw Input[/C][C]view raw input (R code) [/C][/ROW]
[ROW][C]Raw Output[/C][C]view raw output of R engine [/C][/ROW]
[ROW][C]Computing time[/C][C]2 seconds[/C][/ROW]
[ROW][C]R Server[/C][C]'Sir Ronald Aylmer Fisher' @ fisher.wessa.net[/C][/ROW]
[/TABLE]
Source: https://freestatistics.org/blog/index.php?pk=277996&T=0

Globally Unique Identifier (entire table): ba.freestatistics.org/blog/index.php?pk=277996&T=0

As an alternative you can also use a QR Code:  

The GUIDs for individual cells are displayed in the table below:

Summary of computational transaction
Raw Inputview raw input (R code)
Raw Outputview raw output of R engine
Computing time2 seconds
R Server'Sir Ronald Aylmer Fisher' @ fisher.wessa.net


Autocorrelation Function
Time lag kACF(k)T-STATP-value
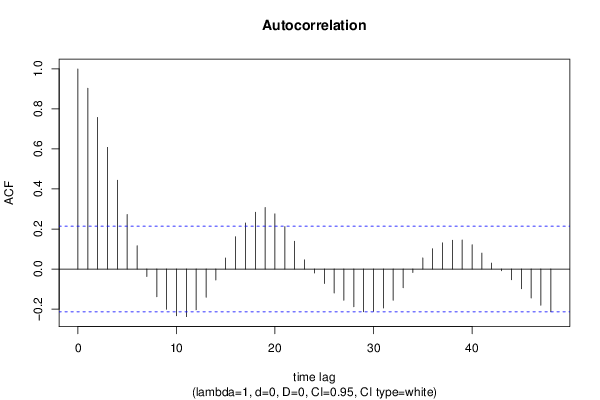
10.9038758.28420
20.7578156.94550
30.6079855.57230
40.4438464.06795.3e-05
50.2727562.49980.007185
60.1159321.06250.145519
7-0.037854-0.34690.364754
8-0.138347-1.2680.104156
9-0.201567-1.84740.034105
10-0.233981-2.14450.017442
11-0.238106-2.18230.015941
12-0.204092-1.87050.032446
13-0.141253-1.29460.099501
14-0.055328-0.50710.30671
150.0548180.50240.308345
160.1615411.48050.071235
170.2304442.11210.018826
180.2835712.5990.005521
190.3076252.81940.003
200.2755632.52560.006714
210.212041.94340.02766
220.1389851.27380.10312
230.0458510.42020.337696
24-0.019588-0.17950.42898
25-0.072354-0.66310.25453
26-0.120117-1.10090.137045
27-0.155923-1.42910.078348
28-0.188564-1.72820.043812
29-0.213698-1.95860.02674
30-0.211855-1.94170.027764
31-0.194938-1.78660.038802
32-0.156398-1.43340.077726
33-0.094034-0.86180.195617
34-0.01715-0.15720.437739
350.0555750.50940.30592
360.1012540.9280.17803
370.1308631.19940.116876
380.1435071.31530.096
390.1447281.32650.094142
400.1214781.11340.134363
410.0794220.72790.234344
420.0295210.27060.393696
43-0.009104-0.08340.466852
44-0.053823-0.49330.311546
45-0.098294-0.90090.185114
46-0.145193-1.33070.093443
47-0.18107-1.65950.050369
48-0.213875-1.96020.026644

\begin{tabular}{lllllllll}
\hline
Autocorrelation Function \tabularnewline
Time lag k & ACF(k) & T-STAT & P-value \tabularnewline
1 & 0.903875 & 8.2842 & 0 \tabularnewline
2 & 0.757815 & 6.9455 & 0 \tabularnewline
3 & 0.607985 & 5.5723 & 0 \tabularnewline
4 & 0.443846 & 4.0679 & 5.3e-05 \tabularnewline
5 & 0.272756 & 2.4998 & 0.007185 \tabularnewline
6 & 0.115932 & 1.0625 & 0.145519 \tabularnewline
7 & -0.037854 & -0.3469 & 0.364754 \tabularnewline
8 & -0.138347 & -1.268 & 0.104156 \tabularnewline
9 & -0.201567 & -1.8474 & 0.034105 \tabularnewline
10 & -0.233981 & -2.1445 & 0.017442 \tabularnewline
11 & -0.238106 & -2.1823 & 0.015941 \tabularnewline
12 & -0.204092 & -1.8705 & 0.032446 \tabularnewline
13 & -0.141253 & -1.2946 & 0.099501 \tabularnewline
14 & -0.055328 & -0.5071 & 0.30671 \tabularnewline
15 & 0.054818 & 0.5024 & 0.308345 \tabularnewline
16 & 0.161541 & 1.4805 & 0.071235 \tabularnewline
17 & 0.230444 & 2.1121 & 0.018826 \tabularnewline
18 & 0.283571 & 2.599 & 0.005521 \tabularnewline
19 & 0.307625 & 2.8194 & 0.003 \tabularnewline
20 & 0.275563 & 2.5256 & 0.006714 \tabularnewline
21 & 0.21204 & 1.9434 & 0.02766 \tabularnewline
22 & 0.138985 & 1.2738 & 0.10312 \tabularnewline
23 & 0.045851 & 0.4202 & 0.337696 \tabularnewline
24 & -0.019588 & -0.1795 & 0.42898 \tabularnewline
25 & -0.072354 & -0.6631 & 0.25453 \tabularnewline
26 & -0.120117 & -1.1009 & 0.137045 \tabularnewline
27 & -0.155923 & -1.4291 & 0.078348 \tabularnewline
28 & -0.188564 & -1.7282 & 0.043812 \tabularnewline
29 & -0.213698 & -1.9586 & 0.02674 \tabularnewline
30 & -0.211855 & -1.9417 & 0.027764 \tabularnewline
31 & -0.194938 & -1.7866 & 0.038802 \tabularnewline
32 & -0.156398 & -1.4334 & 0.077726 \tabularnewline
33 & -0.094034 & -0.8618 & 0.195617 \tabularnewline
34 & -0.01715 & -0.1572 & 0.437739 \tabularnewline
35 & 0.055575 & 0.5094 & 0.30592 \tabularnewline
36 & 0.101254 & 0.928 & 0.17803 \tabularnewline
37 & 0.130863 & 1.1994 & 0.116876 \tabularnewline
38 & 0.143507 & 1.3153 & 0.096 \tabularnewline
39 & 0.144728 & 1.3265 & 0.094142 \tabularnewline
40 & 0.121478 & 1.1134 & 0.134363 \tabularnewline
41 & 0.079422 & 0.7279 & 0.234344 \tabularnewline
42 & 0.029521 & 0.2706 & 0.393696 \tabularnewline
43 & -0.009104 & -0.0834 & 0.466852 \tabularnewline
44 & -0.053823 & -0.4933 & 0.311546 \tabularnewline
45 & -0.098294 & -0.9009 & 0.185114 \tabularnewline
46 & -0.145193 & -1.3307 & 0.093443 \tabularnewline
47 & -0.18107 & -1.6595 & 0.050369 \tabularnewline
48 & -0.213875 & -1.9602 & 0.026644 \tabularnewline
\hline
\end{tabular}
%Source: https://freestatistics.org/blog/index.php?pk=277996&T=1

[TABLE]
[ROW][C]Autocorrelation Function[/C][/ROW]
[ROW][C]Time lag k[/C][C]ACF(k)[/C][C]T-STAT[/C][C]P-value[/C][/ROW]
[ROW][C]1[/C][C]0.903875[/C][C]8.2842[/C][C]0[/C][/ROW]
[ROW][C]2[/C][C]0.757815[/C][C]6.9455[/C][C]0[/C][/ROW]
[ROW][C]3[/C][C]0.607985[/C][C]5.5723[/C][C]0[/C][/ROW]
[ROW][C]4[/C][C]0.443846[/C][C]4.0679[/C][C]5.3e-05[/C][/ROW]
[ROW][C]5[/C][C]0.272756[/C][C]2.4998[/C][C]0.007185[/C][/ROW]
[ROW][C]6[/C][C]0.115932[/C][C]1.0625[/C][C]0.145519[/C][/ROW]
[ROW][C]7[/C][C]-0.037854[/C][C]-0.3469[/C][C]0.364754[/C][/ROW]
[ROW][C]8[/C][C]-0.138347[/C][C]-1.268[/C][C]0.104156[/C][/ROW]
[ROW][C]9[/C][C]-0.201567[/C][C]-1.8474[/C][C]0.034105[/C][/ROW]
[ROW][C]10[/C][C]-0.233981[/C][C]-2.1445[/C][C]0.017442[/C][/ROW]
[ROW][C]11[/C][C]-0.238106[/C][C]-2.1823[/C][C]0.015941[/C][/ROW]
[ROW][C]12[/C][C]-0.204092[/C][C]-1.8705[/C][C]0.032446[/C][/ROW]
[ROW][C]13[/C][C]-0.141253[/C][C]-1.2946[/C][C]0.099501[/C][/ROW]
[ROW][C]14[/C][C]-0.055328[/C][C]-0.5071[/C][C]0.30671[/C][/ROW]
[ROW][C]15[/C][C]0.054818[/C][C]0.5024[/C][C]0.308345[/C][/ROW]
[ROW][C]16[/C][C]0.161541[/C][C]1.4805[/C][C]0.071235[/C][/ROW]
[ROW][C]17[/C][C]0.230444[/C][C]2.1121[/C][C]0.018826[/C][/ROW]
[ROW][C]18[/C][C]0.283571[/C][C]2.599[/C][C]0.005521[/C][/ROW]
[ROW][C]19[/C][C]0.307625[/C][C]2.8194[/C][C]0.003[/C][/ROW]
[ROW][C]20[/C][C]0.275563[/C][C]2.5256[/C][C]0.006714[/C][/ROW]
[ROW][C]21[/C][C]0.21204[/C][C]1.9434[/C][C]0.02766[/C][/ROW]
[ROW][C]22[/C][C]0.138985[/C][C]1.2738[/C][C]0.10312[/C][/ROW]
[ROW][C]23[/C][C]0.045851[/C][C]0.4202[/C][C]0.337696[/C][/ROW]
[ROW][C]24[/C][C]-0.019588[/C][C]-0.1795[/C][C]0.42898[/C][/ROW]
[ROW][C]25[/C][C]-0.072354[/C][C]-0.6631[/C][C]0.25453[/C][/ROW]
[ROW][C]26[/C][C]-0.120117[/C][C]-1.1009[/C][C]0.137045[/C][/ROW]
[ROW][C]27[/C][C]-0.155923[/C][C]-1.4291[/C][C]0.078348[/C][/ROW]
[ROW][C]28[/C][C]-0.188564[/C][C]-1.7282[/C][C]0.043812[/C][/ROW]
[ROW][C]29[/C][C]-0.213698[/C][C]-1.9586[/C][C]0.02674[/C][/ROW]
[ROW][C]30[/C][C]-0.211855[/C][C]-1.9417[/C][C]0.027764[/C][/ROW]
[ROW][C]31[/C][C]-0.194938[/C][C]-1.7866[/C][C]0.038802[/C][/ROW]
[ROW][C]32[/C][C]-0.156398[/C][C]-1.4334[/C][C]0.077726[/C][/ROW]
[ROW][C]33[/C][C]-0.094034[/C][C]-0.8618[/C][C]0.195617[/C][/ROW]
[ROW][C]34[/C][C]-0.01715[/C][C]-0.1572[/C][C]0.437739[/C][/ROW]
[ROW][C]35[/C][C]0.055575[/C][C]0.5094[/C][C]0.30592[/C][/ROW]
[ROW][C]36[/C][C]0.101254[/C][C]0.928[/C][C]0.17803[/C][/ROW]
[ROW][C]37[/C][C]0.130863[/C][C]1.1994[/C][C]0.116876[/C][/ROW]
[ROW][C]38[/C][C]0.143507[/C][C]1.3153[/C][C]0.096[/C][/ROW]
[ROW][C]39[/C][C]0.144728[/C][C]1.3265[/C][C]0.094142[/C][/ROW]
[ROW][C]40[/C][C]0.121478[/C][C]1.1134[/C][C]0.134363[/C][/ROW]
[ROW][C]41[/C][C]0.079422[/C][C]0.7279[/C][C]0.234344[/C][/ROW]
[ROW][C]42[/C][C]0.029521[/C][C]0.2706[/C][C]0.393696[/C][/ROW]
[ROW][C]43[/C][C]-0.009104[/C][C]-0.0834[/C][C]0.466852[/C][/ROW]
[ROW][C]44[/C][C]-0.053823[/C][C]-0.4933[/C][C]0.311546[/C][/ROW]
[ROW][C]45[/C][C]-0.098294[/C][C]-0.9009[/C][C]0.185114[/C][/ROW]
[ROW][C]46[/C][C]-0.145193[/C][C]-1.3307[/C][C]0.093443[/C][/ROW]
[ROW][C]47[/C][C]-0.18107[/C][C]-1.6595[/C][C]0.050369[/C][/ROW]
[ROW][C]48[/C][C]-0.213875[/C][C]-1.9602[/C][C]0.026644[/C][/ROW]
[/TABLE]
Source: https://freestatistics.org/blog/index.php?pk=277996&T=1

Globally Unique Identifier (entire table): ba.freestatistics.org/blog/index.php?pk=277996&T=1

As an alternative you can also use a QR Code:  

The GUIDs for individual cells are displayed in the table below:

Autocorrelation Function
Time lag kACF(k)T-STATP-value
10.9038758.28420
20.7578156.94550
30.6079855.57230
40.4438464.06795.3e-05
50.2727562.49980.007185
60.1159321.06250.145519
7-0.037854-0.34690.364754
8-0.138347-1.2680.104156
9-0.201567-1.84740.034105
10-0.233981-2.14450.017442
11-0.238106-2.18230.015941
12-0.204092-1.87050.032446
13-0.141253-1.29460.099501
14-0.055328-0.50710.30671
150.0548180.50240.308345
160.1615411.48050.071235
170.2304442.11210.018826
180.2835712.5990.005521
190.3076252.81940.003
200.2755632.52560.006714
210.212041.94340.02766
220.1389851.27380.10312
230.0458510.42020.337696
24-0.019588-0.17950.42898
25-0.072354-0.66310.25453
26-0.120117-1.10090.137045
27-0.155923-1.42910.078348
28-0.188564-1.72820.043812
29-0.213698-1.95860.02674
30-0.211855-1.94170.027764
31-0.194938-1.78660.038802
32-0.156398-1.43340.077726
33-0.094034-0.86180.195617
34-0.01715-0.15720.437739
350.0555750.50940.30592
360.1012540.9280.17803
370.1308631.19940.116876
380.1435071.31530.096
390.1447281.32650.094142
400.1214781.11340.134363
410.0794220.72790.234344
420.0295210.27060.393696
43-0.009104-0.08340.466852
44-0.053823-0.49330.311546
45-0.098294-0.90090.185114
46-0.145193-1.33070.093443
47-0.18107-1.65950.050369
48-0.213875-1.96020.026644


Partial Autocorrelation Function
Time lag kPACF(k)T-STATP-value
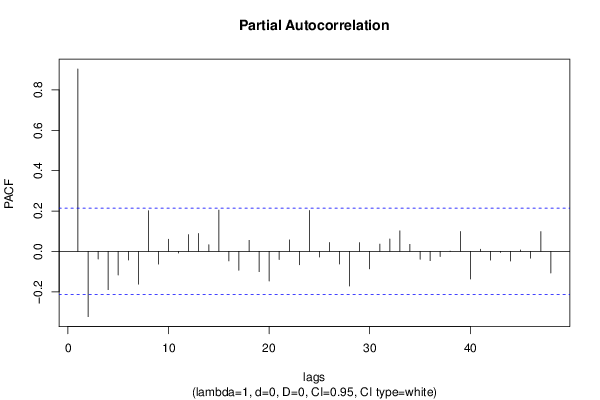
10.9038758.28420
2-0.323345-2.96350.001978
3-0.037858-0.3470.364741
4-0.189485-1.73670.043057
5-0.117129-1.07350.14306
6-0.042852-0.39270.347753
7-0.162133-1.4860.070515
80.2009861.84210.034497
9-0.062967-0.57710.282708
100.060540.55490.290234
11-0.007651-0.07010.472133
120.0830190.76090.224429
130.0883640.80990.210151
140.0330330.30280.381414
150.2045971.87520.032123
16-0.04721-0.43270.333176
17-0.093927-0.86090.195884
180.0546320.50070.308943
19-0.100202-0.91840.180527
20-0.146359-1.34140.091703
21-0.040475-0.3710.355802
220.0569240.52170.301622
23-0.065974-0.60470.273516
240.2025861.85670.033427
25-0.027682-0.25370.400168
260.0443510.40650.34271
27-0.062255-0.57060.284906
28-0.171136-1.56850.060264
290.0433680.39750.346013
30-0.086494-0.79270.215083
310.0359550.32950.371287
320.0610690.55970.288585
330.1018060.93310.176731
340.0347150.31820.375572
35-0.038809-0.35570.36148
36-0.045715-0.4190.338148
37-0.025407-0.23290.408218
38-0.000682-0.00620.497514
390.0983720.90160.184925
40-0.136973-1.25540.106411
410.0104060.09540.462123
42-0.04315-0.39550.346746
43-0.004753-0.04360.482678
44-0.047518-0.43550.332155
450.0066540.0610.475759
46-0.033414-0.30620.380089
470.0979050.89730.186057
48-0.107544-0.98570.163565

\begin{tabular}{lllllllll}
\hline
Partial Autocorrelation Function \tabularnewline
Time lag k & PACF(k) & T-STAT & P-value \tabularnewline
1 & 0.903875 & 8.2842 & 0 \tabularnewline
2 & -0.323345 & -2.9635 & 0.001978 \tabularnewline
3 & -0.037858 & -0.347 & 0.364741 \tabularnewline
4 & -0.189485 & -1.7367 & 0.043057 \tabularnewline
5 & -0.117129 & -1.0735 & 0.14306 \tabularnewline
6 & -0.042852 & -0.3927 & 0.347753 \tabularnewline
7 & -0.162133 & -1.486 & 0.070515 \tabularnewline
8 & 0.200986 & 1.8421 & 0.034497 \tabularnewline
9 & -0.062967 & -0.5771 & 0.282708 \tabularnewline
10 & 0.06054 & 0.5549 & 0.290234 \tabularnewline
11 & -0.007651 & -0.0701 & 0.472133 \tabularnewline
12 & 0.083019 & 0.7609 & 0.224429 \tabularnewline
13 & 0.088364 & 0.8099 & 0.210151 \tabularnewline
14 & 0.033033 & 0.3028 & 0.381414 \tabularnewline
15 & 0.204597 & 1.8752 & 0.032123 \tabularnewline
16 & -0.04721 & -0.4327 & 0.333176 \tabularnewline
17 & -0.093927 & -0.8609 & 0.195884 \tabularnewline
18 & 0.054632 & 0.5007 & 0.308943 \tabularnewline
19 & -0.100202 & -0.9184 & 0.180527 \tabularnewline
20 & -0.146359 & -1.3414 & 0.091703 \tabularnewline
21 & -0.040475 & -0.371 & 0.355802 \tabularnewline
22 & 0.056924 & 0.5217 & 0.301622 \tabularnewline
23 & -0.065974 & -0.6047 & 0.273516 \tabularnewline
24 & 0.202586 & 1.8567 & 0.033427 \tabularnewline
25 & -0.027682 & -0.2537 & 0.400168 \tabularnewline
26 & 0.044351 & 0.4065 & 0.34271 \tabularnewline
27 & -0.062255 & -0.5706 & 0.284906 \tabularnewline
28 & -0.171136 & -1.5685 & 0.060264 \tabularnewline
29 & 0.043368 & 0.3975 & 0.346013 \tabularnewline
30 & -0.086494 & -0.7927 & 0.215083 \tabularnewline
31 & 0.035955 & 0.3295 & 0.371287 \tabularnewline
32 & 0.061069 & 0.5597 & 0.288585 \tabularnewline
33 & 0.101806 & 0.9331 & 0.176731 \tabularnewline
34 & 0.034715 & 0.3182 & 0.375572 \tabularnewline
35 & -0.038809 & -0.3557 & 0.36148 \tabularnewline
36 & -0.045715 & -0.419 & 0.338148 \tabularnewline
37 & -0.025407 & -0.2329 & 0.408218 \tabularnewline
38 & -0.000682 & -0.0062 & 0.497514 \tabularnewline
39 & 0.098372 & 0.9016 & 0.184925 \tabularnewline
40 & -0.136973 & -1.2554 & 0.106411 \tabularnewline
41 & 0.010406 & 0.0954 & 0.462123 \tabularnewline
42 & -0.04315 & -0.3955 & 0.346746 \tabularnewline
43 & -0.004753 & -0.0436 & 0.482678 \tabularnewline
44 & -0.047518 & -0.4355 & 0.332155 \tabularnewline
45 & 0.006654 & 0.061 & 0.475759 \tabularnewline
46 & -0.033414 & -0.3062 & 0.380089 \tabularnewline
47 & 0.097905 & 0.8973 & 0.186057 \tabularnewline
48 & -0.107544 & -0.9857 & 0.163565 \tabularnewline
\hline
\end{tabular}
%Source: https://freestatistics.org/blog/index.php?pk=277996&T=2

[TABLE]
[ROW][C]Partial Autocorrelation Function[/C][/ROW]
[ROW][C]Time lag k[/C][C]PACF(k)[/C][C]T-STAT[/C][C]P-value[/C][/ROW]
[ROW][C]1[/C][C]0.903875[/C][C]8.2842[/C][C]0[/C][/ROW]
[ROW][C]2[/C][C]-0.323345[/C][C]-2.9635[/C][C]0.001978[/C][/ROW]
[ROW][C]3[/C][C]-0.037858[/C][C]-0.347[/C][C]0.364741[/C][/ROW]
[ROW][C]4[/C][C]-0.189485[/C][C]-1.7367[/C][C]0.043057[/C][/ROW]
[ROW][C]5[/C][C]-0.117129[/C][C]-1.0735[/C][C]0.14306[/C][/ROW]
[ROW][C]6[/C][C]-0.042852[/C][C]-0.3927[/C][C]0.347753[/C][/ROW]
[ROW][C]7[/C][C]-0.162133[/C][C]-1.486[/C][C]0.070515[/C][/ROW]
[ROW][C]8[/C][C]0.200986[/C][C]1.8421[/C][C]0.034497[/C][/ROW]
[ROW][C]9[/C][C]-0.062967[/C][C]-0.5771[/C][C]0.282708[/C][/ROW]
[ROW][C]10[/C][C]0.06054[/C][C]0.5549[/C][C]0.290234[/C][/ROW]
[ROW][C]11[/C][C]-0.007651[/C][C]-0.0701[/C][C]0.472133[/C][/ROW]
[ROW][C]12[/C][C]0.083019[/C][C]0.7609[/C][C]0.224429[/C][/ROW]
[ROW][C]13[/C][C]0.088364[/C][C]0.8099[/C][C]0.210151[/C][/ROW]
[ROW][C]14[/C][C]0.033033[/C][C]0.3028[/C][C]0.381414[/C][/ROW]
[ROW][C]15[/C][C]0.204597[/C][C]1.8752[/C][C]0.032123[/C][/ROW]
[ROW][C]16[/C][C]-0.04721[/C][C]-0.4327[/C][C]0.333176[/C][/ROW]
[ROW][C]17[/C][C]-0.093927[/C][C]-0.8609[/C][C]0.195884[/C][/ROW]
[ROW][C]18[/C][C]0.054632[/C][C]0.5007[/C][C]0.308943[/C][/ROW]
[ROW][C]19[/C][C]-0.100202[/C][C]-0.9184[/C][C]0.180527[/C][/ROW]
[ROW][C]20[/C][C]-0.146359[/C][C]-1.3414[/C][C]0.091703[/C][/ROW]
[ROW][C]21[/C][C]-0.040475[/C][C]-0.371[/C][C]0.355802[/C][/ROW]
[ROW][C]22[/C][C]0.056924[/C][C]0.5217[/C][C]0.301622[/C][/ROW]
[ROW][C]23[/C][C]-0.065974[/C][C]-0.6047[/C][C]0.273516[/C][/ROW]
[ROW][C]24[/C][C]0.202586[/C][C]1.8567[/C][C]0.033427[/C][/ROW]
[ROW][C]25[/C][C]-0.027682[/C][C]-0.2537[/C][C]0.400168[/C][/ROW]
[ROW][C]26[/C][C]0.044351[/C][C]0.4065[/C][C]0.34271[/C][/ROW]
[ROW][C]27[/C][C]-0.062255[/C][C]-0.5706[/C][C]0.284906[/C][/ROW]
[ROW][C]28[/C][C]-0.171136[/C][C]-1.5685[/C][C]0.060264[/C][/ROW]
[ROW][C]29[/C][C]0.043368[/C][C]0.3975[/C][C]0.346013[/C][/ROW]
[ROW][C]30[/C][C]-0.086494[/C][C]-0.7927[/C][C]0.215083[/C][/ROW]
[ROW][C]31[/C][C]0.035955[/C][C]0.3295[/C][C]0.371287[/C][/ROW]
[ROW][C]32[/C][C]0.061069[/C][C]0.5597[/C][C]0.288585[/C][/ROW]
[ROW][C]33[/C][C]0.101806[/C][C]0.9331[/C][C]0.176731[/C][/ROW]
[ROW][C]34[/C][C]0.034715[/C][C]0.3182[/C][C]0.375572[/C][/ROW]
[ROW][C]35[/C][C]-0.038809[/C][C]-0.3557[/C][C]0.36148[/C][/ROW]
[ROW][C]36[/C][C]-0.045715[/C][C]-0.419[/C][C]0.338148[/C][/ROW]
[ROW][C]37[/C][C]-0.025407[/C][C]-0.2329[/C][C]0.408218[/C][/ROW]
[ROW][C]38[/C][C]-0.000682[/C][C]-0.0062[/C][C]0.497514[/C][/ROW]
[ROW][C]39[/C][C]0.098372[/C][C]0.9016[/C][C]0.184925[/C][/ROW]
[ROW][C]40[/C][C]-0.136973[/C][C]-1.2554[/C][C]0.106411[/C][/ROW]
[ROW][C]41[/C][C]0.010406[/C][C]0.0954[/C][C]0.462123[/C][/ROW]
[ROW][C]42[/C][C]-0.04315[/C][C]-0.3955[/C][C]0.346746[/C][/ROW]
[ROW][C]43[/C][C]-0.004753[/C][C]-0.0436[/C][C]0.482678[/C][/ROW]
[ROW][C]44[/C][C]-0.047518[/C][C]-0.4355[/C][C]0.332155[/C][/ROW]
[ROW][C]45[/C][C]0.006654[/C][C]0.061[/C][C]0.475759[/C][/ROW]
[ROW][C]46[/C][C]-0.033414[/C][C]-0.3062[/C][C]0.380089[/C][/ROW]
[ROW][C]47[/C][C]0.097905[/C][C]0.8973[/C][C]0.186057[/C][/ROW]
[ROW][C]48[/C][C]-0.107544[/C][C]-0.9857[/C][C]0.163565[/C][/ROW]
[/TABLE]
Source: https://freestatistics.org/blog/index.php?pk=277996&T=2

Globally Unique Identifier (entire table): ba.freestatistics.org/blog/index.php?pk=277996&T=2

As an alternative you can also use a QR Code:  

The GUIDs for individual cells are displayed in the table below:

Partial Autocorrelation Function
Time lag kPACF(k)T-STATP-value
10.9038758.28420
2-0.323345-2.96350.001978
3-0.037858-0.3470.364741
4-0.189485-1.73670.043057
5-0.117129-1.07350.14306
6-0.042852-0.39270.347753
7-0.162133-1.4860.070515
80.2009861.84210.034497
9-0.062967-0.57710.282708
100.060540.55490.290234
11-0.007651-0.07010.472133
120.0830190.76090.224429
130.0883640.80990.210151
140.0330330.30280.381414
150.2045971.87520.032123
16-0.04721-0.43270.333176
17-0.093927-0.86090.195884
180.0546320.50070.308943
19-0.100202-0.91840.180527
20-0.146359-1.34140.091703
21-0.040475-0.3710.355802
220.0569240.52170.301622
23-0.065974-0.60470.273516
240.2025861.85670.033427
25-0.027682-0.25370.400168
260.0443510.40650.34271
27-0.062255-0.57060.284906
28-0.171136-1.56850.060264
290.0433680.39750.346013
30-0.086494-0.79270.215083
310.0359550.32950.371287
320.0610690.55970.288585
330.1018060.93310.176731
340.0347150.31820.375572
35-0.038809-0.35570.36148
36-0.045715-0.4190.338148
37-0.025407-0.23290.408218
38-0.000682-0.00620.497514
390.0983720.90160.184925
40-0.136973-1.25540.106411
410.0104060.09540.462123
42-0.04315-0.39550.346746
43-0.004753-0.04360.482678
44-0.047518-0.43550.332155
450.0066540.0610.475759
46-0.033414-0.30620.380089
470.0979050.89730.186057
48-0.107544-0.98570.163565


Parameters (Session):
par1 = 48 ; par2 = 1 ; par3 = 0 ; par4 = 0 ; par5 = 12 ; par6 = White Noise ; par7 = 0.95 ;
Parameters (R input):
par1 = 48 ; par2 = 1 ; par3 = 0 ; par4 = 0 ; par5 = 12 ; par6 = White Noise ; par7 = 0.95 ; par8 = ;
R code (references can be found in the software module):
if (par1 == 'Default') {
par1 = 10*log10(length(x))
} else {
par1 <- as.numeric(par1)
}
par2 <- as.numeric(par2)
par3 <- as.numeric(par3)
par4 <- as.numeric(par4)
par5 <- as.numeric(par5)
if (par6 == 'White Noise') par6 <- 'white' else par6 <- 'ma'
par7 <- as.numeric(par7)
if (par8 != '') par8 <- as.numeric(par8)
ox <- x
if (par8 == '') {
if (par2 == 0) {
x <- log(x)
} else {
x <- (x ^ par2 - 1) / par2
}
} else {
x <- log(x,base=par8)
}
if (par3 > 0) x <- diff(x,lag=1,difference=par3)
if (par4 > 0) x <- diff(x,lag=par5,difference=par4)
bitmap(file='picts.png')
op <- par(mfrow=c(2,1))
plot(ox,type='l',main='Original Time Series',xlab='time',ylab='value')
if (par8=='') {
mytitle <- paste('Working Time Series (lambda=',par2,', d=',par3,', D=',par4,')',sep='')
mysub <- paste('(lambda=',par2,', d=',par3,', D=',par4,', CI=', par7, ', CI type=',par6,')',sep='')
} else {
mytitle <- paste('Working Time Series (base=',par8,', d=',par3,', D=',par4,')',sep='')
mysub <- paste('(base=',par8,', d=',par3,', D=',par4,', CI=', par7, ', CI type=',par6,')',sep='')
}
plot(x,type='l', main=mytitle,xlab='time',ylab='value')
par(op)
dev.off()
bitmap(file='pic1.png')
racf <- acf(x, par1, main='Autocorrelation', xlab='time lag', ylab='ACF', ci.type=par6, ci=par7, sub=mysub)
dev.off()
bitmap(file='pic2.png')
rpacf <- pacf(x,par1,main='Partial Autocorrelation',xlab='lags',ylab='PACF',sub=mysub)
dev.off()
(myacf <- c(racf$acf))
(mypacf <- c(rpacf$acf))
lengthx <- length(x)
sqrtn <- sqrt(lengthx)
load(file='createtable')
a<-table.start()
a<-table.row.start(a)
a<-table.element(a,'Autocorrelation Function',4,TRUE)
a<-table.row.end(a)
a<-table.row.start(a)
a<-table.element(a,'Time lag k',header=TRUE)
a<-table.element(a,hyperlink('basics.htm','ACF(k)','click here for more information about the Autocorrelation Function'),header=TRUE)
a<-table.element(a,'T-STAT',header=TRUE)
a<-table.element(a,'P-value',header=TRUE)
a<-table.row.end(a)
for (i in 2:(par1+1)) {
a<-table.row.start(a)
a<-table.element(a,i-1,header=TRUE)
a<-table.element(a,round(myacf[i],6))
mytstat <- myacf[i]*sqrtn
a<-table.element(a,round(mytstat,4))
a<-table.element(a,round(1-pt(abs(mytstat),lengthx),6))
a<-table.row.end(a)
}
a<-table.end(a)
table.save(a,file='mytable.tab')
a<-table.start()
a<-table.row.start(a)
a<-table.element(a,'Partial Autocorrelation Function',4,TRUE)
a<-table.row.end(a)
a<-table.row.start(a)
a<-table.element(a,'Time lag k',header=TRUE)
a<-table.element(a,hyperlink('basics.htm','PACF(k)','click here for more information about the Partial Autocorrelation Function'),header=TRUE)
a<-table.element(a,'T-STAT',header=TRUE)
a<-table.element(a,'P-value',header=TRUE)
a<-table.row.end(a)
for (i in 1:par1) {
a<-table.row.start(a)
a<-table.element(a,i,header=TRUE)
a<-table.element(a,round(mypacf[i],6))
mytstat <- mypacf[i]*sqrtn
a<-table.element(a,round(mytstat,4))
a<-table.element(a,round(1-pt(abs(mytstat),lengthx),6))
a<-table.row.end(a)
}
a<-table.end(a)
table.save(a,file='mytable1.tab')