Free Statistics

of Irreproducible Research!

Author's title

Author*Unverified author*
R Software Modulerwasp_autocorrelation.wasp
Title produced by software(Partial) Autocorrelation Function
Date of computationThu, 05 Mar 2015 19:05:31 +0000
Cite this page as followsStatistical Computations at FreeStatistics.org, Office for Research Development and Education, URL https://freestatistics.org/blog/index.php?v=date/2015/Mar/05/t1425582372r3idh9vfbxlzed9.htm/, Retrieved Sun, 19 May 2024 11:33:42 +0000
Statistical Computations at FreeStatistics.org, Office for Research Development and Education, URL https://freestatistics.org/blog/index.php?pk=277992, Retrieved Sun, 19 May 2024 11:33:42 +0000
QR Codes:

Original text written by user:
IsPrivate?No (this computation is public)
User-defined keywords
Estimated Impact65
Family? (F = Feedback message, R = changed R code, M = changed R Module, P = changed Parameters, D = changed Data)
-       [(Partial) Autocorrelation Function] [] [2015-03-05 19:05:31] [d41d8cd98f00b204e9800998ecf8427e] [Current]
Feedback Forum

Post a new message
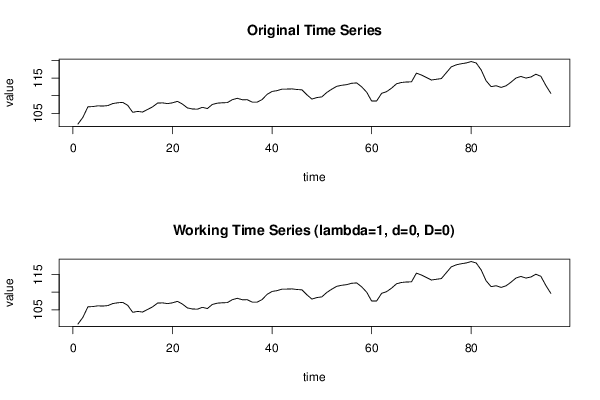
Dataseries X:
101,97
103,9
106,85
106,93
107,13
107,07
107,2
107,78
108
108,11
107,26
105,3
105,55
105,38
106,12
106,85
107,92
107,97
107,76
107,99
108,41
107,61
106,54
106,24
106,19
106,71
106,36
107,53
107,89
108
108,05
108,86
109,27
108,87
108,88
108,19
108,19
108,91
110,39
111,21
111,44
111,87
111,88
111,93
111,76
111,66
110,25
109,05
109,47
109,68
110,93
111,86
112,66
112,96
113,14
113,53
113,62
112,51
111
108,49
108,52
110,66
111,15
112,14
113,38
113,75
113,89
113,92
116,4
115,86
115,16
114,45
114,65
114,85
116,51
118,18
118,75
119,06
119,28
119,68
119,28
117,3
114,23
112,56
112,83
112,35
112,8
113,84
115,02
115,46
115
115,3
116,09
115,49
112,89
110,66


Summary of computational transaction
Raw Inputview raw input (R code)
Raw Outputview raw output of R engine
Computing time2 seconds
R Server'George Udny Yule' @ yule.wessa.net

\begin{tabular}{lllllllll}
\hline
Summary of computational transaction \tabularnewline
Raw Input & view raw input (R code)  \tabularnewline
Raw Output & view raw output of R engine  \tabularnewline
Computing time & 2 seconds \tabularnewline
R Server & 'George Udny Yule' @ yule.wessa.net \tabularnewline
\hline
\end{tabular}
%Source: https://freestatistics.org/blog/index.php?pk=277992&T=0

[TABLE]
[ROW][C]Summary of computational transaction[/C][/ROW]
[ROW][C]Raw Input[/C][C]view raw input (R code) [/C][/ROW]
[ROW][C]Raw Output[/C][C]view raw output of R engine [/C][/ROW]
[ROW][C]Computing time[/C][C]2 seconds[/C][/ROW]
[ROW][C]R Server[/C][C]'George Udny Yule' @ yule.wessa.net[/C][/ROW]
[/TABLE]
Source: https://freestatistics.org/blog/index.php?pk=277992&T=0

Globally Unique Identifier (entire table): ba.freestatistics.org/blog/index.php?pk=277992&T=0

As an alternative you can also use a QR Code:  

The GUIDs for individual cells are displayed in the table below:

Summary of computational transaction
Raw Inputview raw input (R code)
Raw Outputview raw output of R engine
Computing time2 seconds
R Server'George Udny Yule' @ yule.wessa.net


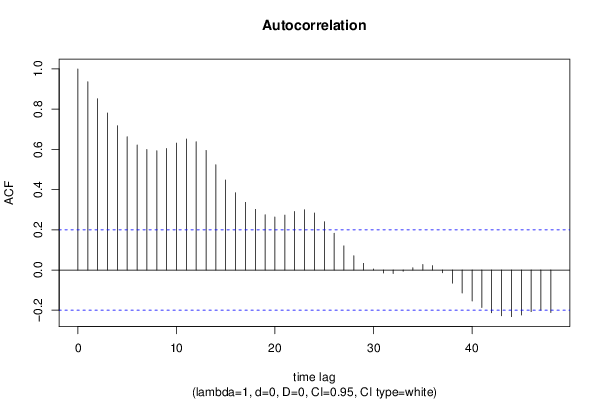
Autocorrelation Function
Time lag kACF(k)T-STATP-value
10.9365739.17650
20.8519238.34710
30.7811837.6540
40.7174037.02910
50.6629796.49580
60.6216126.09050
70.5990595.86960
80.5932875.8130
90.604415.9220
100.6312876.18530
110.6514126.38250
120.6382766.25380
130.594865.82840
140.5231645.12591e-06
150.448114.39061.5e-05
160.3840433.76280.000145
170.3365283.29730.000685
180.3015012.95410.001972
190.2744582.68910.004224
200.2639232.58590.005608
210.272992.67470.004396
220.2910012.85120.002666
230.2997572.9370.002074
240.2832752.77550.003313
250.2403262.35470.010287
260.1829661.79270.038086
270.1201181.17690.12107
280.0710050.69570.244149
290.0331930.32520.372861
300.0046340.04540.481938
31-0.014695-0.1440.44291
32-0.017728-0.17370.431236
33-0.006705-0.06570.47388
340.0111150.10890.456754
350.0275610.270.393853
360.0219780.21530.414981
37-0.013978-0.1370.445676
38-0.0654-0.64080.261595
39-0.114213-1.11910.132955
40-0.154249-1.51130.066995
41-0.186945-1.83170.03505
42-0.21285-2.08550.019839
43-0.227937-2.23330.013925
44-0.232022-2.27330.012617
45-0.224129-2.1960.01525
46-0.207063-2.02880.022624
47-0.1998-1.95760.026588
48-0.211231-2.06960.020586

\begin{tabular}{lllllllll}
\hline
Autocorrelation Function \tabularnewline
Time lag k & ACF(k) & T-STAT & P-value \tabularnewline
1 & 0.936573 & 9.1765 & 0 \tabularnewline
2 & 0.851923 & 8.3471 & 0 \tabularnewline
3 & 0.781183 & 7.654 & 0 \tabularnewline
4 & 0.717403 & 7.0291 & 0 \tabularnewline
5 & 0.662979 & 6.4958 & 0 \tabularnewline
6 & 0.621612 & 6.0905 & 0 \tabularnewline
7 & 0.599059 & 5.8696 & 0 \tabularnewline
8 & 0.593287 & 5.813 & 0 \tabularnewline
9 & 0.60441 & 5.922 & 0 \tabularnewline
10 & 0.631287 & 6.1853 & 0 \tabularnewline
11 & 0.651412 & 6.3825 & 0 \tabularnewline
12 & 0.638276 & 6.2538 & 0 \tabularnewline
13 & 0.59486 & 5.8284 & 0 \tabularnewline
14 & 0.523164 & 5.1259 & 1e-06 \tabularnewline
15 & 0.44811 & 4.3906 & 1.5e-05 \tabularnewline
16 & 0.384043 & 3.7628 & 0.000145 \tabularnewline
17 & 0.336528 & 3.2973 & 0.000685 \tabularnewline
18 & 0.301501 & 2.9541 & 0.001972 \tabularnewline
19 & 0.274458 & 2.6891 & 0.004224 \tabularnewline
20 & 0.263923 & 2.5859 & 0.005608 \tabularnewline
21 & 0.27299 & 2.6747 & 0.004396 \tabularnewline
22 & 0.291001 & 2.8512 & 0.002666 \tabularnewline
23 & 0.299757 & 2.937 & 0.002074 \tabularnewline
24 & 0.283275 & 2.7755 & 0.003313 \tabularnewline
25 & 0.240326 & 2.3547 & 0.010287 \tabularnewline
26 & 0.182966 & 1.7927 & 0.038086 \tabularnewline
27 & 0.120118 & 1.1769 & 0.12107 \tabularnewline
28 & 0.071005 & 0.6957 & 0.244149 \tabularnewline
29 & 0.033193 & 0.3252 & 0.372861 \tabularnewline
30 & 0.004634 & 0.0454 & 0.481938 \tabularnewline
31 & -0.014695 & -0.144 & 0.44291 \tabularnewline
32 & -0.017728 & -0.1737 & 0.431236 \tabularnewline
33 & -0.006705 & -0.0657 & 0.47388 \tabularnewline
34 & 0.011115 & 0.1089 & 0.456754 \tabularnewline
35 & 0.027561 & 0.27 & 0.393853 \tabularnewline
36 & 0.021978 & 0.2153 & 0.414981 \tabularnewline
37 & -0.013978 & -0.137 & 0.445676 \tabularnewline
38 & -0.0654 & -0.6408 & 0.261595 \tabularnewline
39 & -0.114213 & -1.1191 & 0.132955 \tabularnewline
40 & -0.154249 & -1.5113 & 0.066995 \tabularnewline
41 & -0.186945 & -1.8317 & 0.03505 \tabularnewline
42 & -0.21285 & -2.0855 & 0.019839 \tabularnewline
43 & -0.227937 & -2.2333 & 0.013925 \tabularnewline
44 & -0.232022 & -2.2733 & 0.012617 \tabularnewline
45 & -0.224129 & -2.196 & 0.01525 \tabularnewline
46 & -0.207063 & -2.0288 & 0.022624 \tabularnewline
47 & -0.1998 & -1.9576 & 0.026588 \tabularnewline
48 & -0.211231 & -2.0696 & 0.020586 \tabularnewline
\hline
\end{tabular}
%Source: https://freestatistics.org/blog/index.php?pk=277992&T=1

[TABLE]
[ROW][C]Autocorrelation Function[/C][/ROW]
[ROW][C]Time lag k[/C][C]ACF(k)[/C][C]T-STAT[/C][C]P-value[/C][/ROW]
[ROW][C]1[/C][C]0.936573[/C][C]9.1765[/C][C]0[/C][/ROW]
[ROW][C]2[/C][C]0.851923[/C][C]8.3471[/C][C]0[/C][/ROW]
[ROW][C]3[/C][C]0.781183[/C][C]7.654[/C][C]0[/C][/ROW]
[ROW][C]4[/C][C]0.717403[/C][C]7.0291[/C][C]0[/C][/ROW]
[ROW][C]5[/C][C]0.662979[/C][C]6.4958[/C][C]0[/C][/ROW]
[ROW][C]6[/C][C]0.621612[/C][C]6.0905[/C][C]0[/C][/ROW]
[ROW][C]7[/C][C]0.599059[/C][C]5.8696[/C][C]0[/C][/ROW]
[ROW][C]8[/C][C]0.593287[/C][C]5.813[/C][C]0[/C][/ROW]
[ROW][C]9[/C][C]0.60441[/C][C]5.922[/C][C]0[/C][/ROW]
[ROW][C]10[/C][C]0.631287[/C][C]6.1853[/C][C]0[/C][/ROW]
[ROW][C]11[/C][C]0.651412[/C][C]6.3825[/C][C]0[/C][/ROW]
[ROW][C]12[/C][C]0.638276[/C][C]6.2538[/C][C]0[/C][/ROW]
[ROW][C]13[/C][C]0.59486[/C][C]5.8284[/C][C]0[/C][/ROW]
[ROW][C]14[/C][C]0.523164[/C][C]5.1259[/C][C]1e-06[/C][/ROW]
[ROW][C]15[/C][C]0.44811[/C][C]4.3906[/C][C]1.5e-05[/C][/ROW]
[ROW][C]16[/C][C]0.384043[/C][C]3.7628[/C][C]0.000145[/C][/ROW]
[ROW][C]17[/C][C]0.336528[/C][C]3.2973[/C][C]0.000685[/C][/ROW]
[ROW][C]18[/C][C]0.301501[/C][C]2.9541[/C][C]0.001972[/C][/ROW]
[ROW][C]19[/C][C]0.274458[/C][C]2.6891[/C][C]0.004224[/C][/ROW]
[ROW][C]20[/C][C]0.263923[/C][C]2.5859[/C][C]0.005608[/C][/ROW]
[ROW][C]21[/C][C]0.27299[/C][C]2.6747[/C][C]0.004396[/C][/ROW]
[ROW][C]22[/C][C]0.291001[/C][C]2.8512[/C][C]0.002666[/C][/ROW]
[ROW][C]23[/C][C]0.299757[/C][C]2.937[/C][C]0.002074[/C][/ROW]
[ROW][C]24[/C][C]0.283275[/C][C]2.7755[/C][C]0.003313[/C][/ROW]
[ROW][C]25[/C][C]0.240326[/C][C]2.3547[/C][C]0.010287[/C][/ROW]
[ROW][C]26[/C][C]0.182966[/C][C]1.7927[/C][C]0.038086[/C][/ROW]
[ROW][C]27[/C][C]0.120118[/C][C]1.1769[/C][C]0.12107[/C][/ROW]
[ROW][C]28[/C][C]0.071005[/C][C]0.6957[/C][C]0.244149[/C][/ROW]
[ROW][C]29[/C][C]0.033193[/C][C]0.3252[/C][C]0.372861[/C][/ROW]
[ROW][C]30[/C][C]0.004634[/C][C]0.0454[/C][C]0.481938[/C][/ROW]
[ROW][C]31[/C][C]-0.014695[/C][C]-0.144[/C][C]0.44291[/C][/ROW]
[ROW][C]32[/C][C]-0.017728[/C][C]-0.1737[/C][C]0.431236[/C][/ROW]
[ROW][C]33[/C][C]-0.006705[/C][C]-0.0657[/C][C]0.47388[/C][/ROW]
[ROW][C]34[/C][C]0.011115[/C][C]0.1089[/C][C]0.456754[/C][/ROW]
[ROW][C]35[/C][C]0.027561[/C][C]0.27[/C][C]0.393853[/C][/ROW]
[ROW][C]36[/C][C]0.021978[/C][C]0.2153[/C][C]0.414981[/C][/ROW]
[ROW][C]37[/C][C]-0.013978[/C][C]-0.137[/C][C]0.445676[/C][/ROW]
[ROW][C]38[/C][C]-0.0654[/C][C]-0.6408[/C][C]0.261595[/C][/ROW]
[ROW][C]39[/C][C]-0.114213[/C][C]-1.1191[/C][C]0.132955[/C][/ROW]
[ROW][C]40[/C][C]-0.154249[/C][C]-1.5113[/C][C]0.066995[/C][/ROW]
[ROW][C]41[/C][C]-0.186945[/C][C]-1.8317[/C][C]0.03505[/C][/ROW]
[ROW][C]42[/C][C]-0.21285[/C][C]-2.0855[/C][C]0.019839[/C][/ROW]
[ROW][C]43[/C][C]-0.227937[/C][C]-2.2333[/C][C]0.013925[/C][/ROW]
[ROW][C]44[/C][C]-0.232022[/C][C]-2.2733[/C][C]0.012617[/C][/ROW]
[ROW][C]45[/C][C]-0.224129[/C][C]-2.196[/C][C]0.01525[/C][/ROW]
[ROW][C]46[/C][C]-0.207063[/C][C]-2.0288[/C][C]0.022624[/C][/ROW]
[ROW][C]47[/C][C]-0.1998[/C][C]-1.9576[/C][C]0.026588[/C][/ROW]
[ROW][C]48[/C][C]-0.211231[/C][C]-2.0696[/C][C]0.020586[/C][/ROW]
[/TABLE]
Source: https://freestatistics.org/blog/index.php?pk=277992&T=1

Globally Unique Identifier (entire table): ba.freestatistics.org/blog/index.php?pk=277992&T=1

As an alternative you can also use a QR Code:  

The GUIDs for individual cells are displayed in the table below:

Autocorrelation Function
Time lag kACF(k)T-STATP-value
10.9365739.17650
20.8519238.34710
30.7811837.6540
40.7174037.02910
50.6629796.49580
60.6216126.09050
70.5990595.86960
80.5932875.8130
90.604415.9220
100.6312876.18530
110.6514126.38250
120.6382766.25380
130.594865.82840
140.5231645.12591e-06
150.448114.39061.5e-05
160.3840433.76280.000145
170.3365283.29730.000685
180.3015012.95410.001972
190.2744582.68910.004224
200.2639232.58590.005608
210.272992.67470.004396
220.2910012.85120.002666
230.2997572.9370.002074
240.2832752.77550.003313
250.2403262.35470.010287
260.1829661.79270.038086
270.1201181.17690.12107
280.0710050.69570.244149
290.0331930.32520.372861
300.0046340.04540.481938
31-0.014695-0.1440.44291
32-0.017728-0.17370.431236
33-0.006705-0.06570.47388
340.0111150.10890.456754
350.0275610.270.393853
360.0219780.21530.414981
37-0.013978-0.1370.445676
38-0.0654-0.64080.261595
39-0.114213-1.11910.132955
40-0.154249-1.51130.066995
41-0.186945-1.83170.03505
42-0.21285-2.08550.019839
43-0.227937-2.23330.013925
44-0.232022-2.27330.012617
45-0.224129-2.1960.01525
46-0.207063-2.02880.022624
47-0.1998-1.95760.026588
48-0.211231-2.06960.020586


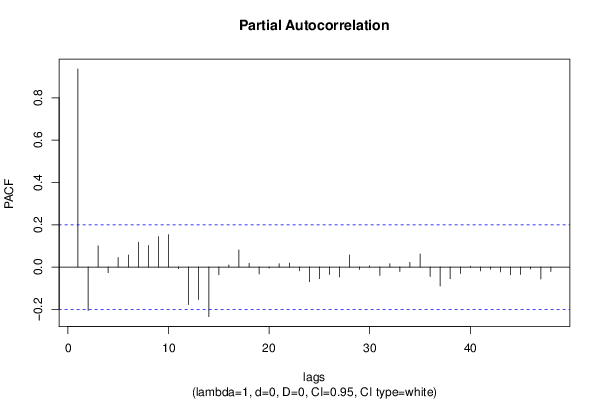
Partial Autocorrelation Function
Time lag kPACF(k)T-STATP-value
10.9365739.17650
2-0.205539-2.01390.023411
30.1003080.98280.164084
4-0.026406-0.25870.3982
50.0456350.44710.327893
60.0574550.56290.287394
70.117381.15010.126484
80.1023631.00290.159204
90.1438411.40930.080982
100.1533381.50240.068138
11-0.007655-0.0750.470182
12-0.177316-1.73730.042768
13-0.153194-1.5010.06832
14-0.234363-2.29630.011917
15-0.036084-0.35360.362226
160.0101810.09980.460375
170.081070.79430.214483
180.0183180.17950.42897
19-0.033015-0.32350.373518
20-0.004481-0.04390.482537
210.0159350.15610.438128
220.0188610.18480.426888
23-0.017254-0.16910.433056
24-0.069263-0.67860.249501
25-0.054598-0.53490.296961
26-0.035069-0.34360.365949
27-0.046454-0.45520.325012
280.0567650.55620.289692
29-0.011332-0.1110.455911
300.0056570.05540.477956
31-0.039355-0.38560.350325
320.0154350.15120.440054
33-0.021024-0.2060.418615
340.0221770.21730.414222
350.0617250.60480.273375
36-0.044856-0.43950.330645
37-0.089896-0.88080.190313
38-0.054987-0.53880.295651
39-0.030643-0.30020.382324
400.0041850.0410.483689
41-0.0181-0.17730.429805
42-0.009623-0.09430.46254
43-0.022744-0.22280.412064
44-0.036714-0.35970.359924
45-0.035182-0.34470.365533
46-0.00927-0.09080.46391
47-0.056079-0.54950.291982
48-0.021117-0.20690.418264

\begin{tabular}{lllllllll}
\hline
Partial Autocorrelation Function \tabularnewline
Time lag k & PACF(k) & T-STAT & P-value \tabularnewline
1 & 0.936573 & 9.1765 & 0 \tabularnewline
2 & -0.205539 & -2.0139 & 0.023411 \tabularnewline
3 & 0.100308 & 0.9828 & 0.164084 \tabularnewline
4 & -0.026406 & -0.2587 & 0.3982 \tabularnewline
5 & 0.045635 & 0.4471 & 0.327893 \tabularnewline
6 & 0.057455 & 0.5629 & 0.287394 \tabularnewline
7 & 0.11738 & 1.1501 & 0.126484 \tabularnewline
8 & 0.102363 & 1.0029 & 0.159204 \tabularnewline
9 & 0.143841 & 1.4093 & 0.080982 \tabularnewline
10 & 0.153338 & 1.5024 & 0.068138 \tabularnewline
11 & -0.007655 & -0.075 & 0.470182 \tabularnewline
12 & -0.177316 & -1.7373 & 0.042768 \tabularnewline
13 & -0.153194 & -1.501 & 0.06832 \tabularnewline
14 & -0.234363 & -2.2963 & 0.011917 \tabularnewline
15 & -0.036084 & -0.3536 & 0.362226 \tabularnewline
16 & 0.010181 & 0.0998 & 0.460375 \tabularnewline
17 & 0.08107 & 0.7943 & 0.214483 \tabularnewline
18 & 0.018318 & 0.1795 & 0.42897 \tabularnewline
19 & -0.033015 & -0.3235 & 0.373518 \tabularnewline
20 & -0.004481 & -0.0439 & 0.482537 \tabularnewline
21 & 0.015935 & 0.1561 & 0.438128 \tabularnewline
22 & 0.018861 & 0.1848 & 0.426888 \tabularnewline
23 & -0.017254 & -0.1691 & 0.433056 \tabularnewline
24 & -0.069263 & -0.6786 & 0.249501 \tabularnewline
25 & -0.054598 & -0.5349 & 0.296961 \tabularnewline
26 & -0.035069 & -0.3436 & 0.365949 \tabularnewline
27 & -0.046454 & -0.4552 & 0.325012 \tabularnewline
28 & 0.056765 & 0.5562 & 0.289692 \tabularnewline
29 & -0.011332 & -0.111 & 0.455911 \tabularnewline
30 & 0.005657 & 0.0554 & 0.477956 \tabularnewline
31 & -0.039355 & -0.3856 & 0.350325 \tabularnewline
32 & 0.015435 & 0.1512 & 0.440054 \tabularnewline
33 & -0.021024 & -0.206 & 0.418615 \tabularnewline
34 & 0.022177 & 0.2173 & 0.414222 \tabularnewline
35 & 0.061725 & 0.6048 & 0.273375 \tabularnewline
36 & -0.044856 & -0.4395 & 0.330645 \tabularnewline
37 & -0.089896 & -0.8808 & 0.190313 \tabularnewline
38 & -0.054987 & -0.5388 & 0.295651 \tabularnewline
39 & -0.030643 & -0.3002 & 0.382324 \tabularnewline
40 & 0.004185 & 0.041 & 0.483689 \tabularnewline
41 & -0.0181 & -0.1773 & 0.429805 \tabularnewline
42 & -0.009623 & -0.0943 & 0.46254 \tabularnewline
43 & -0.022744 & -0.2228 & 0.412064 \tabularnewline
44 & -0.036714 & -0.3597 & 0.359924 \tabularnewline
45 & -0.035182 & -0.3447 & 0.365533 \tabularnewline
46 & -0.00927 & -0.0908 & 0.46391 \tabularnewline
47 & -0.056079 & -0.5495 & 0.291982 \tabularnewline
48 & -0.021117 & -0.2069 & 0.418264 \tabularnewline
\hline
\end{tabular}
%Source: https://freestatistics.org/blog/index.php?pk=277992&T=2

[TABLE]
[ROW][C]Partial Autocorrelation Function[/C][/ROW]
[ROW][C]Time lag k[/C][C]PACF(k)[/C][C]T-STAT[/C][C]P-value[/C][/ROW]
[ROW][C]1[/C][C]0.936573[/C][C]9.1765[/C][C]0[/C][/ROW]
[ROW][C]2[/C][C]-0.205539[/C][C]-2.0139[/C][C]0.023411[/C][/ROW]
[ROW][C]3[/C][C]0.100308[/C][C]0.9828[/C][C]0.164084[/C][/ROW]
[ROW][C]4[/C][C]-0.026406[/C][C]-0.2587[/C][C]0.3982[/C][/ROW]
[ROW][C]5[/C][C]0.045635[/C][C]0.4471[/C][C]0.327893[/C][/ROW]
[ROW][C]6[/C][C]0.057455[/C][C]0.5629[/C][C]0.287394[/C][/ROW]
[ROW][C]7[/C][C]0.11738[/C][C]1.1501[/C][C]0.126484[/C][/ROW]
[ROW][C]8[/C][C]0.102363[/C][C]1.0029[/C][C]0.159204[/C][/ROW]
[ROW][C]9[/C][C]0.143841[/C][C]1.4093[/C][C]0.080982[/C][/ROW]
[ROW][C]10[/C][C]0.153338[/C][C]1.5024[/C][C]0.068138[/C][/ROW]
[ROW][C]11[/C][C]-0.007655[/C][C]-0.075[/C][C]0.470182[/C][/ROW]
[ROW][C]12[/C][C]-0.177316[/C][C]-1.7373[/C][C]0.042768[/C][/ROW]
[ROW][C]13[/C][C]-0.153194[/C][C]-1.501[/C][C]0.06832[/C][/ROW]
[ROW][C]14[/C][C]-0.234363[/C][C]-2.2963[/C][C]0.011917[/C][/ROW]
[ROW][C]15[/C][C]-0.036084[/C][C]-0.3536[/C][C]0.362226[/C][/ROW]
[ROW][C]16[/C][C]0.010181[/C][C]0.0998[/C][C]0.460375[/C][/ROW]
[ROW][C]17[/C][C]0.08107[/C][C]0.7943[/C][C]0.214483[/C][/ROW]
[ROW][C]18[/C][C]0.018318[/C][C]0.1795[/C][C]0.42897[/C][/ROW]
[ROW][C]19[/C][C]-0.033015[/C][C]-0.3235[/C][C]0.373518[/C][/ROW]
[ROW][C]20[/C][C]-0.004481[/C][C]-0.0439[/C][C]0.482537[/C][/ROW]
[ROW][C]21[/C][C]0.015935[/C][C]0.1561[/C][C]0.438128[/C][/ROW]
[ROW][C]22[/C][C]0.018861[/C][C]0.1848[/C][C]0.426888[/C][/ROW]
[ROW][C]23[/C][C]-0.017254[/C][C]-0.1691[/C][C]0.433056[/C][/ROW]
[ROW][C]24[/C][C]-0.069263[/C][C]-0.6786[/C][C]0.249501[/C][/ROW]
[ROW][C]25[/C][C]-0.054598[/C][C]-0.5349[/C][C]0.296961[/C][/ROW]
[ROW][C]26[/C][C]-0.035069[/C][C]-0.3436[/C][C]0.365949[/C][/ROW]
[ROW][C]27[/C][C]-0.046454[/C][C]-0.4552[/C][C]0.325012[/C][/ROW]
[ROW][C]28[/C][C]0.056765[/C][C]0.5562[/C][C]0.289692[/C][/ROW]
[ROW][C]29[/C][C]-0.011332[/C][C]-0.111[/C][C]0.455911[/C][/ROW]
[ROW][C]30[/C][C]0.005657[/C][C]0.0554[/C][C]0.477956[/C][/ROW]
[ROW][C]31[/C][C]-0.039355[/C][C]-0.3856[/C][C]0.350325[/C][/ROW]
[ROW][C]32[/C][C]0.015435[/C][C]0.1512[/C][C]0.440054[/C][/ROW]
[ROW][C]33[/C][C]-0.021024[/C][C]-0.206[/C][C]0.418615[/C][/ROW]
[ROW][C]34[/C][C]0.022177[/C][C]0.2173[/C][C]0.414222[/C][/ROW]
[ROW][C]35[/C][C]0.061725[/C][C]0.6048[/C][C]0.273375[/C][/ROW]
[ROW][C]36[/C][C]-0.044856[/C][C]-0.4395[/C][C]0.330645[/C][/ROW]
[ROW][C]37[/C][C]-0.089896[/C][C]-0.8808[/C][C]0.190313[/C][/ROW]
[ROW][C]38[/C][C]-0.054987[/C][C]-0.5388[/C][C]0.295651[/C][/ROW]
[ROW][C]39[/C][C]-0.030643[/C][C]-0.3002[/C][C]0.382324[/C][/ROW]
[ROW][C]40[/C][C]0.004185[/C][C]0.041[/C][C]0.483689[/C][/ROW]
[ROW][C]41[/C][C]-0.0181[/C][C]-0.1773[/C][C]0.429805[/C][/ROW]
[ROW][C]42[/C][C]-0.009623[/C][C]-0.0943[/C][C]0.46254[/C][/ROW]
[ROW][C]43[/C][C]-0.022744[/C][C]-0.2228[/C][C]0.412064[/C][/ROW]
[ROW][C]44[/C][C]-0.036714[/C][C]-0.3597[/C][C]0.359924[/C][/ROW]
[ROW][C]45[/C][C]-0.035182[/C][C]-0.3447[/C][C]0.365533[/C][/ROW]
[ROW][C]46[/C][C]-0.00927[/C][C]-0.0908[/C][C]0.46391[/C][/ROW]
[ROW][C]47[/C][C]-0.056079[/C][C]-0.5495[/C][C]0.291982[/C][/ROW]
[ROW][C]48[/C][C]-0.021117[/C][C]-0.2069[/C][C]0.418264[/C][/ROW]
[/TABLE]
Source: https://freestatistics.org/blog/index.php?pk=277992&T=2

Globally Unique Identifier (entire table): ba.freestatistics.org/blog/index.php?pk=277992&T=2

As an alternative you can also use a QR Code:  

The GUIDs for individual cells are displayed in the table below:

Partial Autocorrelation Function
Time lag kPACF(k)T-STATP-value
10.9365739.17650
2-0.205539-2.01390.023411
30.1003080.98280.164084
4-0.026406-0.25870.3982
50.0456350.44710.327893
60.0574550.56290.287394
70.117381.15010.126484
80.1023631.00290.159204
90.1438411.40930.080982
100.1533381.50240.068138
11-0.007655-0.0750.470182
12-0.177316-1.73730.042768
13-0.153194-1.5010.06832
14-0.234363-2.29630.011917
15-0.036084-0.35360.362226
160.0101810.09980.460375
170.081070.79430.214483
180.0183180.17950.42897
19-0.033015-0.32350.373518
20-0.004481-0.04390.482537
210.0159350.15610.438128
220.0188610.18480.426888
23-0.017254-0.16910.433056
24-0.069263-0.67860.249501
25-0.054598-0.53490.296961
26-0.035069-0.34360.365949
27-0.046454-0.45520.325012
280.0567650.55620.289692
29-0.011332-0.1110.455911
300.0056570.05540.477956
31-0.039355-0.38560.350325
320.0154350.15120.440054
33-0.021024-0.2060.418615
340.0221770.21730.414222
350.0617250.60480.273375
36-0.044856-0.43950.330645
37-0.089896-0.88080.190313
38-0.054987-0.53880.295651
39-0.030643-0.30020.382324
400.0041850.0410.483689
41-0.0181-0.17730.429805
42-0.009623-0.09430.46254
43-0.022744-0.22280.412064
44-0.036714-0.35970.359924
45-0.035182-0.34470.365533
46-0.00927-0.09080.46391
47-0.056079-0.54950.291982
48-0.021117-0.20690.418264


Parameters (Session):
par1 = 48 ; par2 = 1 ; par3 = 0 ; par4 = 0 ; par5 = 12 ; par6 = White Noise ; par7 = 0.95 ;
Parameters (R input):
par1 = 48 ; par2 = 1 ; par3 = 0 ; par4 = 0 ; par5 = 12 ; par6 = White Noise ; par7 = 0.95 ; par8 = ;
R code (references can be found in the software module):
if (par1 == 'Default') {
par1 = 10*log10(length(x))
} else {
par1 <- as.numeric(par1)
}
par2 <- as.numeric(par2)
par3 <- as.numeric(par3)
par4 <- as.numeric(par4)
par5 <- as.numeric(par5)
if (par6 == 'White Noise') par6 <- 'white' else par6 <- 'ma'
par7 <- as.numeric(par7)
if (par8 != '') par8 <- as.numeric(par8)
ox <- x
if (par8 == '') {
if (par2 == 0) {
x <- log(x)
} else {
x <- (x ^ par2 - 1) / par2
}
} else {
x <- log(x,base=par8)
}
if (par3 > 0) x <- diff(x,lag=1,difference=par3)
if (par4 > 0) x <- diff(x,lag=par5,difference=par4)
bitmap(file='picts.png')
op <- par(mfrow=c(2,1))
plot(ox,type='l',main='Original Time Series',xlab='time',ylab='value')
if (par8=='') {
mytitle <- paste('Working Time Series (lambda=',par2,', d=',par3,', D=',par4,')',sep='')
mysub <- paste('(lambda=',par2,', d=',par3,', D=',par4,', CI=', par7, ', CI type=',par6,')',sep='')
} else {
mytitle <- paste('Working Time Series (base=',par8,', d=',par3,', D=',par4,')',sep='')
mysub <- paste('(base=',par8,', d=',par3,', D=',par4,', CI=', par7, ', CI type=',par6,')',sep='')
}
plot(x,type='l', main=mytitle,xlab='time',ylab='value')
par(op)
dev.off()
bitmap(file='pic1.png')
racf <- acf(x, par1, main='Autocorrelation', xlab='time lag', ylab='ACF', ci.type=par6, ci=par7, sub=mysub)
dev.off()
bitmap(file='pic2.png')
rpacf <- pacf(x,par1,main='Partial Autocorrelation',xlab='lags',ylab='PACF',sub=mysub)
dev.off()
(myacf <- c(racf$acf))
(mypacf <- c(rpacf$acf))
lengthx <- length(x)
sqrtn <- sqrt(lengthx)
load(file='createtable')
a<-table.start()
a<-table.row.start(a)
a<-table.element(a,'Autocorrelation Function',4,TRUE)
a<-table.row.end(a)
a<-table.row.start(a)
a<-table.element(a,'Time lag k',header=TRUE)
a<-table.element(a,hyperlink('basics.htm','ACF(k)','click here for more information about the Autocorrelation Function'),header=TRUE)
a<-table.element(a,'T-STAT',header=TRUE)
a<-table.element(a,'P-value',header=TRUE)
a<-table.row.end(a)
for (i in 2:(par1+1)) {
a<-table.row.start(a)
a<-table.element(a,i-1,header=TRUE)
a<-table.element(a,round(myacf[i],6))
mytstat <- myacf[i]*sqrtn
a<-table.element(a,round(mytstat,4))
a<-table.element(a,round(1-pt(abs(mytstat),lengthx),6))
a<-table.row.end(a)
}
a<-table.end(a)
table.save(a,file='mytable.tab')
a<-table.start()
a<-table.row.start(a)
a<-table.element(a,'Partial Autocorrelation Function',4,TRUE)
a<-table.row.end(a)
a<-table.row.start(a)
a<-table.element(a,'Time lag k',header=TRUE)
a<-table.element(a,hyperlink('basics.htm','PACF(k)','click here for more information about the Partial Autocorrelation Function'),header=TRUE)
a<-table.element(a,'T-STAT',header=TRUE)
a<-table.element(a,'P-value',header=TRUE)
a<-table.row.end(a)
for (i in 1:par1) {
a<-table.row.start(a)
a<-table.element(a,i,header=TRUE)
a<-table.element(a,round(mypacf[i],6))
mytstat <- mypacf[i]*sqrtn
a<-table.element(a,round(mytstat,4))
a<-table.element(a,round(1-pt(abs(mytstat),lengthx),6))
a<-table.row.end(a)
}
a<-table.end(a)
table.save(a,file='mytable1.tab')