Free Statistics

of Irreproducible Research!

Author's title

Author*Unverified author*
R Software Modulerwasp_autocorrelation.wasp
Title produced by software(Partial) Autocorrelation Function
Date of computationThu, 05 Mar 2015 18:59:48 +0000
Cite this page as followsStatistical Computations at FreeStatistics.org, Office for Research Development and Education, URL https://freestatistics.org/blog/index.php?v=date/2015/Mar/05/t14255820340ewanrolalzjajt.htm/, Retrieved Sun, 19 May 2024 11:11:27 +0000
Statistical Computations at FreeStatistics.org, Office for Research Development and Education, URL https://freestatistics.org/blog/index.php?pk=277987, Retrieved Sun, 19 May 2024 11:11:27 +0000
QR Codes:

Original text written by user:
IsPrivate?No (this computation is public)
User-defined keywords
Estimated Impact96
Family? (F = Feedback message, R = changed R code, M = changed R Module, P = changed Parameters, D = changed Data)
-       [(Partial) Autocorrelation Function] [] [2015-03-05 18:59:48] [efb69546851bccb1c0576f78d5afa44b] [Current]
Feedback Forum

Post a new message
Dataseries X:
75.6
74
75.3
83.1
84.9
83.5
88.2
87.4
77.8
74.5
75.3
78.7
71.4
75.8
79.2
84.4
84.4
87.2
92.4
88.5
94.8
100.9
110
107.9
111.2
116.7
125.8
131.5
146.2
155.4
157.5
137.2
121.3
89.1
69.6
56.7
58.5
56.4
60.5
64.6
73.2
84.6
80.4
88.4
84.6
90.8
94.9
93.1
96.6
93.1
98.3
105
95.6
94.3
95.3
97.1
98.1
104.4
107.8
114.3
118.7
124.1
134.2
142.4
133.8
131
133.2
125.9
126.2
122.7
126.6
124.8
128
134.1
138.8
134
124
110.4
116.7
124.7
126
122.8
120.2
121.2
125.4
127.9
122
117.5
117.9
117.9
122.7
125.7
126.1
123.2
120.6
123.5


Summary of computational transaction
Raw Inputview raw input (R code)
Raw Outputview raw output of R engine
Computing time2 seconds
R Server'George Udny Yule' @ yule.wessa.net

\begin{tabular}{lllllllll}
\hline
Summary of computational transaction \tabularnewline
Raw Input & view raw input (R code)  \tabularnewline
Raw Output & view raw output of R engine  \tabularnewline
Computing time & 2 seconds \tabularnewline
R Server & 'George Udny Yule' @ yule.wessa.net \tabularnewline
\hline
\end{tabular}
%Source: https://freestatistics.org/blog/index.php?pk=277987&T=0

[TABLE]
[ROW][C]Summary of computational transaction[/C][/ROW]
[ROW][C]Raw Input[/C][C]view raw input (R code) [/C][/ROW]
[ROW][C]Raw Output[/C][C]view raw output of R engine [/C][/ROW]
[ROW][C]Computing time[/C][C]2 seconds[/C][/ROW]
[ROW][C]R Server[/C][C]'George Udny Yule' @ yule.wessa.net[/C][/ROW]
[/TABLE]
Source: https://freestatistics.org/blog/index.php?pk=277987&T=0

Globally Unique Identifier (entire table): ba.freestatistics.org/blog/index.php?pk=277987&T=0

As an alternative you can also use a QR Code:  

The GUIDs for individual cells are displayed in the table below:

Summary of computational transaction
Raw Inputview raw input (R code)
Raw Outputview raw output of R engine
Computing time2 seconds
R Server'George Udny Yule' @ yule.wessa.net


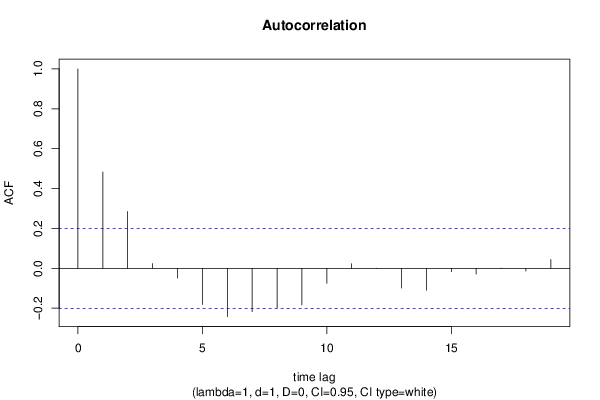
Autocorrelation Function
Time lag kACF(k)T-STATP-value
10.4832014.70974e-06
20.2850332.77820.003294
30.0237650.23160.408659
4-0.048681-0.47450.318123
5-0.181346-1.76750.040174
6-0.242246-2.36110.010131
7-0.217225-2.11720.018425
8-0.197722-1.92720.028474
9-0.183087-1.78450.038766
10-0.074525-0.72640.234695
110.0233270.22740.410313
122.2e-052e-040.499914
13-0.09822-0.95730.170415
14-0.109229-1.06460.14487
15-0.017227-0.16790.433507
16-0.027996-0.27290.392773
17-0.000766-0.00750.497029
18-0.013754-0.13410.44682
190.0443530.43230.333251

\begin{tabular}{lllllllll}
\hline
Autocorrelation Function \tabularnewline
Time lag k & ACF(k) & T-STAT & P-value \tabularnewline
1 & 0.483201 & 4.7097 & 4e-06 \tabularnewline
2 & 0.285033 & 2.7782 & 0.003294 \tabularnewline
3 & 0.023765 & 0.2316 & 0.408659 \tabularnewline
4 & -0.048681 & -0.4745 & 0.318123 \tabularnewline
5 & -0.181346 & -1.7675 & 0.040174 \tabularnewline
6 & -0.242246 & -2.3611 & 0.010131 \tabularnewline
7 & -0.217225 & -2.1172 & 0.018425 \tabularnewline
8 & -0.197722 & -1.9272 & 0.028474 \tabularnewline
9 & -0.183087 & -1.7845 & 0.038766 \tabularnewline
10 & -0.074525 & -0.7264 & 0.234695 \tabularnewline
11 & 0.023327 & 0.2274 & 0.410313 \tabularnewline
12 & 2.2e-05 & 2e-04 & 0.499914 \tabularnewline
13 & -0.09822 & -0.9573 & 0.170415 \tabularnewline
14 & -0.109229 & -1.0646 & 0.14487 \tabularnewline
15 & -0.017227 & -0.1679 & 0.433507 \tabularnewline
16 & -0.027996 & -0.2729 & 0.392773 \tabularnewline
17 & -0.000766 & -0.0075 & 0.497029 \tabularnewline
18 & -0.013754 & -0.1341 & 0.44682 \tabularnewline
19 & 0.044353 & 0.4323 & 0.333251 \tabularnewline
\hline
\end{tabular}
%Source: https://freestatistics.org/blog/index.php?pk=277987&T=1

[TABLE]
[ROW][C]Autocorrelation Function[/C][/ROW]
[ROW][C]Time lag k[/C][C]ACF(k)[/C][C]T-STAT[/C][C]P-value[/C][/ROW]
[ROW][C]1[/C][C]0.483201[/C][C]4.7097[/C][C]4e-06[/C][/ROW]
[ROW][C]2[/C][C]0.285033[/C][C]2.7782[/C][C]0.003294[/C][/ROW]
[ROW][C]3[/C][C]0.023765[/C][C]0.2316[/C][C]0.408659[/C][/ROW]
[ROW][C]4[/C][C]-0.048681[/C][C]-0.4745[/C][C]0.318123[/C][/ROW]
[ROW][C]5[/C][C]-0.181346[/C][C]-1.7675[/C][C]0.040174[/C][/ROW]
[ROW][C]6[/C][C]-0.242246[/C][C]-2.3611[/C][C]0.010131[/C][/ROW]
[ROW][C]7[/C][C]-0.217225[/C][C]-2.1172[/C][C]0.018425[/C][/ROW]
[ROW][C]8[/C][C]-0.197722[/C][C]-1.9272[/C][C]0.028474[/C][/ROW]
[ROW][C]9[/C][C]-0.183087[/C][C]-1.7845[/C][C]0.038766[/C][/ROW]
[ROW][C]10[/C][C]-0.074525[/C][C]-0.7264[/C][C]0.234695[/C][/ROW]
[ROW][C]11[/C][C]0.023327[/C][C]0.2274[/C][C]0.410313[/C][/ROW]
[ROW][C]12[/C][C]2.2e-05[/C][C]2e-04[/C][C]0.499914[/C][/ROW]
[ROW][C]13[/C][C]-0.09822[/C][C]-0.9573[/C][C]0.170415[/C][/ROW]
[ROW][C]14[/C][C]-0.109229[/C][C]-1.0646[/C][C]0.14487[/C][/ROW]
[ROW][C]15[/C][C]-0.017227[/C][C]-0.1679[/C][C]0.433507[/C][/ROW]
[ROW][C]16[/C][C]-0.027996[/C][C]-0.2729[/C][C]0.392773[/C][/ROW]
[ROW][C]17[/C][C]-0.000766[/C][C]-0.0075[/C][C]0.497029[/C][/ROW]
[ROW][C]18[/C][C]-0.013754[/C][C]-0.1341[/C][C]0.44682[/C][/ROW]
[ROW][C]19[/C][C]0.044353[/C][C]0.4323[/C][C]0.333251[/C][/ROW]
[/TABLE]
Source: https://freestatistics.org/blog/index.php?pk=277987&T=1

Globally Unique Identifier (entire table): ba.freestatistics.org/blog/index.php?pk=277987&T=1

As an alternative you can also use a QR Code:  

The GUIDs for individual cells are displayed in the table below:

Autocorrelation Function
Time lag kACF(k)T-STATP-value
10.4832014.70974e-06
20.2850332.77820.003294
30.0237650.23160.408659
4-0.048681-0.47450.318123
5-0.181346-1.76750.040174
6-0.242246-2.36110.010131
7-0.217225-2.11720.018425
8-0.197722-1.92720.028474
9-0.183087-1.78450.038766
10-0.074525-0.72640.234695
110.0233270.22740.410313
122.2e-052e-040.499914
13-0.09822-0.95730.170415
14-0.109229-1.06460.14487
15-0.017227-0.16790.433507
16-0.027996-0.27290.392773
17-0.000766-0.00750.497029
18-0.013754-0.13410.44682
190.0443530.43230.333251


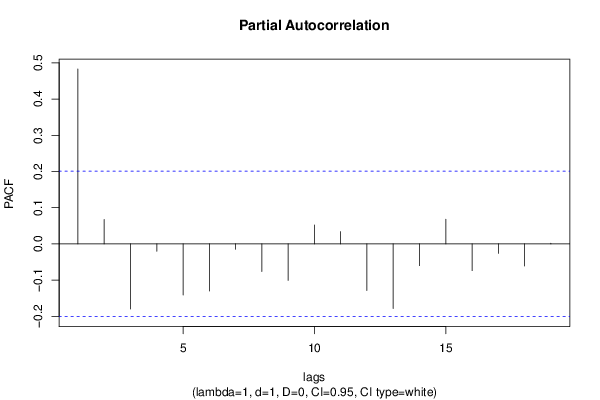
Partial Autocorrelation Function
Time lag kPACF(k)T-STATP-value
10.4832014.70974e-06
20.0672520.65550.256869
3-0.1798-1.75250.04146
4-0.020405-0.19890.421389
5-0.141144-1.37570.086075
6-0.130257-1.26960.103666
7-0.014684-0.14310.443248
8-0.076414-0.74480.229118
9-0.10095-0.98390.163823
100.0519130.5060.307018
110.0338640.33010.371037
12-0.128737-1.25480.10632
13-0.178517-1.740.042551
14-0.060157-0.58630.279518
150.0678340.66120.255053
16-0.073993-0.72120.236279
17-0.026343-0.25680.398958
18-0.06123-0.59680.27603
190.0017810.01740.493094

\begin{tabular}{lllllllll}
\hline
Partial Autocorrelation Function \tabularnewline
Time lag k & PACF(k) & T-STAT & P-value \tabularnewline
1 & 0.483201 & 4.7097 & 4e-06 \tabularnewline
2 & 0.067252 & 0.6555 & 0.256869 \tabularnewline
3 & -0.1798 & -1.7525 & 0.04146 \tabularnewline
4 & -0.020405 & -0.1989 & 0.421389 \tabularnewline
5 & -0.141144 & -1.3757 & 0.086075 \tabularnewline
6 & -0.130257 & -1.2696 & 0.103666 \tabularnewline
7 & -0.014684 & -0.1431 & 0.443248 \tabularnewline
8 & -0.076414 & -0.7448 & 0.229118 \tabularnewline
9 & -0.10095 & -0.9839 & 0.163823 \tabularnewline
10 & 0.051913 & 0.506 & 0.307018 \tabularnewline
11 & 0.033864 & 0.3301 & 0.371037 \tabularnewline
12 & -0.128737 & -1.2548 & 0.10632 \tabularnewline
13 & -0.178517 & -1.74 & 0.042551 \tabularnewline
14 & -0.060157 & -0.5863 & 0.279518 \tabularnewline
15 & 0.067834 & 0.6612 & 0.255053 \tabularnewline
16 & -0.073993 & -0.7212 & 0.236279 \tabularnewline
17 & -0.026343 & -0.2568 & 0.398958 \tabularnewline
18 & -0.06123 & -0.5968 & 0.27603 \tabularnewline
19 & 0.001781 & 0.0174 & 0.493094 \tabularnewline
\hline
\end{tabular}
%Source: https://freestatistics.org/blog/index.php?pk=277987&T=2

[TABLE]
[ROW][C]Partial Autocorrelation Function[/C][/ROW]
[ROW][C]Time lag k[/C][C]PACF(k)[/C][C]T-STAT[/C][C]P-value[/C][/ROW]
[ROW][C]1[/C][C]0.483201[/C][C]4.7097[/C][C]4e-06[/C][/ROW]
[ROW][C]2[/C][C]0.067252[/C][C]0.6555[/C][C]0.256869[/C][/ROW]
[ROW][C]3[/C][C]-0.1798[/C][C]-1.7525[/C][C]0.04146[/C][/ROW]
[ROW][C]4[/C][C]-0.020405[/C][C]-0.1989[/C][C]0.421389[/C][/ROW]
[ROW][C]5[/C][C]-0.141144[/C][C]-1.3757[/C][C]0.086075[/C][/ROW]
[ROW][C]6[/C][C]-0.130257[/C][C]-1.2696[/C][C]0.103666[/C][/ROW]
[ROW][C]7[/C][C]-0.014684[/C][C]-0.1431[/C][C]0.443248[/C][/ROW]
[ROW][C]8[/C][C]-0.076414[/C][C]-0.7448[/C][C]0.229118[/C][/ROW]
[ROW][C]9[/C][C]-0.10095[/C][C]-0.9839[/C][C]0.163823[/C][/ROW]
[ROW][C]10[/C][C]0.051913[/C][C]0.506[/C][C]0.307018[/C][/ROW]
[ROW][C]11[/C][C]0.033864[/C][C]0.3301[/C][C]0.371037[/C][/ROW]
[ROW][C]12[/C][C]-0.128737[/C][C]-1.2548[/C][C]0.10632[/C][/ROW]
[ROW][C]13[/C][C]-0.178517[/C][C]-1.74[/C][C]0.042551[/C][/ROW]
[ROW][C]14[/C][C]-0.060157[/C][C]-0.5863[/C][C]0.279518[/C][/ROW]
[ROW][C]15[/C][C]0.067834[/C][C]0.6612[/C][C]0.255053[/C][/ROW]
[ROW][C]16[/C][C]-0.073993[/C][C]-0.7212[/C][C]0.236279[/C][/ROW]
[ROW][C]17[/C][C]-0.026343[/C][C]-0.2568[/C][C]0.398958[/C][/ROW]
[ROW][C]18[/C][C]-0.06123[/C][C]-0.5968[/C][C]0.27603[/C][/ROW]
[ROW][C]19[/C][C]0.001781[/C][C]0.0174[/C][C]0.493094[/C][/ROW]
[/TABLE]
Source: https://freestatistics.org/blog/index.php?pk=277987&T=2

Globally Unique Identifier (entire table): ba.freestatistics.org/blog/index.php?pk=277987&T=2

As an alternative you can also use a QR Code:  

The GUIDs for individual cells are displayed in the table below:

Partial Autocorrelation Function
Time lag kPACF(k)T-STATP-value
10.4832014.70974e-06
20.0672520.65550.256869
3-0.1798-1.75250.04146
4-0.020405-0.19890.421389
5-0.141144-1.37570.086075
6-0.130257-1.26960.103666
7-0.014684-0.14310.443248
8-0.076414-0.74480.229118
9-0.10095-0.98390.163823
100.0519130.5060.307018
110.0338640.33010.371037
12-0.128737-1.25480.10632
13-0.178517-1.740.042551
14-0.060157-0.58630.279518
150.0678340.66120.255053
16-0.073993-0.72120.236279
17-0.026343-0.25680.398958
18-0.06123-0.59680.27603
190.0017810.01740.493094


Parameters (Session):
par1 = Default ; par2 = 1 ; par3 = 1 ; par4 = 0 ; par5 = 12 ; par6 = White Noise ; par7 = 0.95 ;
Parameters (R input):
par1 = Default ; par2 = 1 ; par3 = 1 ; par4 = 0 ; par5 = 12 ; par6 = White Noise ; par7 = 0.95 ; par8 = ;
R code (references can be found in the software module):
if (par1 == 'Default') {
par1 = 10*log10(length(x))
} else {
par1 <- as.numeric(par1)
}
par2 <- as.numeric(par2)
par3 <- as.numeric(par3)
par4 <- as.numeric(par4)
par5 <- as.numeric(par5)
if (par6 == 'White Noise') par6 <- 'white' else par6 <- 'ma'
par7 <- as.numeric(par7)
if (par8 != '') par8 <- as.numeric(par8)
ox <- x
if (par8 == '') {
if (par2 == 0) {
x <- log(x)
} else {
x <- (x ^ par2 - 1) / par2
}
} else {
x <- log(x,base=par8)
}
if (par3 > 0) x <- diff(x,lag=1,difference=par3)
if (par4 > 0) x <- diff(x,lag=par5,difference=par4)
bitmap(file='picts.png')
op <- par(mfrow=c(2,1))
plot(ox,type='l',main='Original Time Series',xlab='time',ylab='value')
if (par8=='') {
mytitle <- paste('Working Time Series (lambda=',par2,', d=',par3,', D=',par4,')',sep='')
mysub <- paste('(lambda=',par2,', d=',par3,', D=',par4,', CI=', par7, ', CI type=',par6,')',sep='')
} else {
mytitle <- paste('Working Time Series (base=',par8,', d=',par3,', D=',par4,')',sep='')
mysub <- paste('(base=',par8,', d=',par3,', D=',par4,', CI=', par7, ', CI type=',par6,')',sep='')
}
plot(x,type='l', main=mytitle,xlab='time',ylab='value')
par(op)
dev.off()
bitmap(file='pic1.png')
racf <- acf(x, par1, main='Autocorrelation', xlab='time lag', ylab='ACF', ci.type=par6, ci=par7, sub=mysub)
dev.off()
bitmap(file='pic2.png')
rpacf <- pacf(x,par1,main='Partial Autocorrelation',xlab='lags',ylab='PACF',sub=mysub)
dev.off()
(myacf <- c(racf$acf))
(mypacf <- c(rpacf$acf))
lengthx <- length(x)
sqrtn <- sqrt(lengthx)
load(file='createtable')
a<-table.start()
a<-table.row.start(a)
a<-table.element(a,'Autocorrelation Function',4,TRUE)
a<-table.row.end(a)
a<-table.row.start(a)
a<-table.element(a,'Time lag k',header=TRUE)
a<-table.element(a,hyperlink('basics.htm','ACF(k)','click here for more information about the Autocorrelation Function'),header=TRUE)
a<-table.element(a,'T-STAT',header=TRUE)
a<-table.element(a,'P-value',header=TRUE)
a<-table.row.end(a)
for (i in 2:(par1+1)) {
a<-table.row.start(a)
a<-table.element(a,i-1,header=TRUE)
a<-table.element(a,round(myacf[i],6))
mytstat <- myacf[i]*sqrtn
a<-table.element(a,round(mytstat,4))
a<-table.element(a,round(1-pt(abs(mytstat),lengthx),6))
a<-table.row.end(a)
}
a<-table.end(a)
table.save(a,file='mytable.tab')
a<-table.start()
a<-table.row.start(a)
a<-table.element(a,'Partial Autocorrelation Function',4,TRUE)
a<-table.row.end(a)
a<-table.row.start(a)
a<-table.element(a,'Time lag k',header=TRUE)
a<-table.element(a,hyperlink('basics.htm','PACF(k)','click here for more information about the Partial Autocorrelation Function'),header=TRUE)
a<-table.element(a,'T-STAT',header=TRUE)
a<-table.element(a,'P-value',header=TRUE)
a<-table.row.end(a)
for (i in 1:par1) {
a<-table.row.start(a)
a<-table.element(a,i,header=TRUE)
a<-table.element(a,round(mypacf[i],6))
mytstat <- mypacf[i]*sqrtn
a<-table.element(a,round(mytstat,4))
a<-table.element(a,round(1-pt(abs(mytstat),lengthx),6))
a<-table.row.end(a)
}
a<-table.end(a)
table.save(a,file='mytable1.tab')