Free Statistics

of Irreproducible Research!

Author's title

Author*Unverified author*
R Software Modulerwasp_autocorrelation.wasp
Title produced by software(Partial) Autocorrelation Function
Date of computationThu, 05 Mar 2015 11:53:58 +0000
Cite this page as followsStatistical Computations at FreeStatistics.org, Office for Research Development and Education, URL https://freestatistics.org/blog/index.php?v=date/2015/Mar/05/t14255565027nja913tlrbbtxm.htm/, Retrieved Sun, 19 May 2024 09:18:27 +0000
Statistical Computations at FreeStatistics.org, Office for Research Development and Education, URL https://freestatistics.org/blog/index.php?pk=277931, Retrieved Sun, 19 May 2024 09:18:27 +0000
QR Codes:

Original text written by user:
IsPrivate?No (this computation is public)
User-defined keywords
Estimated Impact98
Family? (F = Feedback message, R = changed R code, M = changed R Module, P = changed Parameters, D = changed Data)
-       [(Partial) Autocorrelation Function] [Aantal nieuwe res...] [2015-03-05 11:53:58] [4436f154edbd6dc391df500b76aea682] [Current]
Feedback Forum

Post a new message
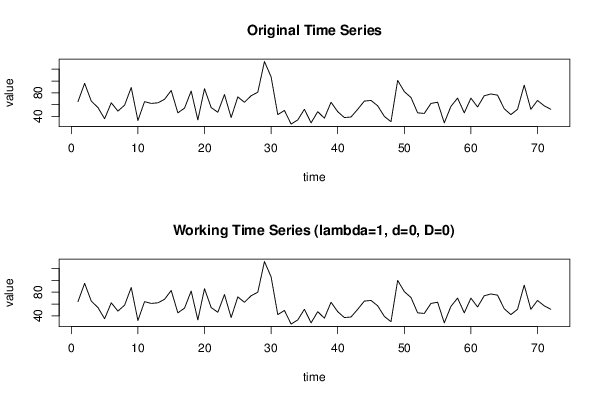
Dataseries X:
65
96
66
55
36
63
49
59
89
33
65
62
63
69
84
46
54
83
34
87
55
47
77
38
73
64
75
81
133
107
43
50
27
34
52
29
48
37
64
48
38
39
52
66
67
58
40
31
101
82
72
46
45
62
64
29
57
71
46
71
56
75
78
76
53
43
52
93
52
67
58
52


Summary of computational transaction
Raw Inputview raw input (R code)
Raw Outputview raw output of R engine
Computing time1 seconds
R Server'Gwilym Jenkins' @ jenkins.wessa.net

\begin{tabular}{lllllllll}
\hline
Summary of computational transaction \tabularnewline
Raw Input & view raw input (R code)  \tabularnewline
Raw Output & view raw output of R engine  \tabularnewline
Computing time & 1 seconds \tabularnewline
R Server & 'Gwilym Jenkins' @ jenkins.wessa.net \tabularnewline
\hline
\end{tabular}
%Source: https://freestatistics.org/blog/index.php?pk=277931&T=0

[TABLE]
[ROW][C]Summary of computational transaction[/C][/ROW]
[ROW][C]Raw Input[/C][C]view raw input (R code) [/C][/ROW]
[ROW][C]Raw Output[/C][C]view raw output of R engine [/C][/ROW]
[ROW][C]Computing time[/C][C]1 seconds[/C][/ROW]
[ROW][C]R Server[/C][C]'Gwilym Jenkins' @ jenkins.wessa.net[/C][/ROW]
[/TABLE]
Source: https://freestatistics.org/blog/index.php?pk=277931&T=0

Globally Unique Identifier (entire table): ba.freestatistics.org/blog/index.php?pk=277931&T=0

As an alternative you can also use a QR Code:  

The GUIDs for individual cells are displayed in the table below:

Summary of computational transaction
Raw Inputview raw input (R code)
Raw Outputview raw output of R engine
Computing time1 seconds
R Server'Gwilym Jenkins' @ jenkins.wessa.net


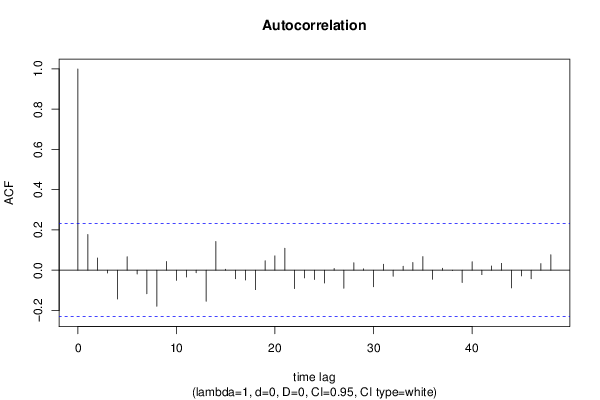
Autocorrelation Function
Time lag kACF(k)T-STATP-value
10.1770331.50220.068712
20.0605110.51350.304603
3-0.014131-0.11990.452448
4-0.143296-1.21590.113996
50.066590.5650.286903
6-0.019418-0.16480.434794
7-0.116996-0.99270.16208
8-0.178936-1.51830.066656
90.0429750.36470.358219
10-0.050819-0.43120.3338
11-0.033724-0.28620.38779
12-0.012909-0.10950.456541
13-0.154741-1.3130.096673
140.1425681.20970.11517
150.0047740.04050.483901
16-0.042976-0.36470.358216
17-0.049151-0.41710.338937
18-0.096785-0.82120.207108
190.0471350.40.345186
200.071150.60370.27396
210.1092640.92710.178477
22-0.091568-0.7770.219859
23-0.038183-0.3240.373441
24-0.046599-0.39540.346856
25-0.064124-0.54410.294023
260.0082110.06970.472323
27-0.090273-0.7660.223093
280.0365510.31010.378672
290.0064410.05470.478283
30-0.082259-0.6980.243715
310.0290740.24670.402919
32-0.030336-0.25740.398797
330.0192020.16290.435514
340.0379260.32180.374264
350.0673060.57110.28485
36-0.045432-0.38550.350499
370.0099390.08430.466511
38-0.001157-0.00980.496097
39-0.061377-0.52080.302053
400.0422920.35890.360374
41-0.022178-0.18820.425629
420.0211280.17930.429112
430.0337590.28650.387678
44-0.088118-0.74770.228537
45-0.02842-0.24120.405062
46-0.042554-0.36110.359547
470.0324490.27530.391921
480.0768180.65180.258295

\begin{tabular}{lllllllll}
\hline
Autocorrelation Function \tabularnewline
Time lag k & ACF(k) & T-STAT & P-value \tabularnewline
1 & 0.177033 & 1.5022 & 0.068712 \tabularnewline
2 & 0.060511 & 0.5135 & 0.304603 \tabularnewline
3 & -0.014131 & -0.1199 & 0.452448 \tabularnewline
4 & -0.143296 & -1.2159 & 0.113996 \tabularnewline
5 & 0.06659 & 0.565 & 0.286903 \tabularnewline
6 & -0.019418 & -0.1648 & 0.434794 \tabularnewline
7 & -0.116996 & -0.9927 & 0.16208 \tabularnewline
8 & -0.178936 & -1.5183 & 0.066656 \tabularnewline
9 & 0.042975 & 0.3647 & 0.358219 \tabularnewline
10 & -0.050819 & -0.4312 & 0.3338 \tabularnewline
11 & -0.033724 & -0.2862 & 0.38779 \tabularnewline
12 & -0.012909 & -0.1095 & 0.456541 \tabularnewline
13 & -0.154741 & -1.313 & 0.096673 \tabularnewline
14 & 0.142568 & 1.2097 & 0.11517 \tabularnewline
15 & 0.004774 & 0.0405 & 0.483901 \tabularnewline
16 & -0.042976 & -0.3647 & 0.358216 \tabularnewline
17 & -0.049151 & -0.4171 & 0.338937 \tabularnewline
18 & -0.096785 & -0.8212 & 0.207108 \tabularnewline
19 & 0.047135 & 0.4 & 0.345186 \tabularnewline
20 & 0.07115 & 0.6037 & 0.27396 \tabularnewline
21 & 0.109264 & 0.9271 & 0.178477 \tabularnewline
22 & -0.091568 & -0.777 & 0.219859 \tabularnewline
23 & -0.038183 & -0.324 & 0.373441 \tabularnewline
24 & -0.046599 & -0.3954 & 0.346856 \tabularnewline
25 & -0.064124 & -0.5441 & 0.294023 \tabularnewline
26 & 0.008211 & 0.0697 & 0.472323 \tabularnewline
27 & -0.090273 & -0.766 & 0.223093 \tabularnewline
28 & 0.036551 & 0.3101 & 0.378672 \tabularnewline
29 & 0.006441 & 0.0547 & 0.478283 \tabularnewline
30 & -0.082259 & -0.698 & 0.243715 \tabularnewline
31 & 0.029074 & 0.2467 & 0.402919 \tabularnewline
32 & -0.030336 & -0.2574 & 0.398797 \tabularnewline
33 & 0.019202 & 0.1629 & 0.435514 \tabularnewline
34 & 0.037926 & 0.3218 & 0.374264 \tabularnewline
35 & 0.067306 & 0.5711 & 0.28485 \tabularnewline
36 & -0.045432 & -0.3855 & 0.350499 \tabularnewline
37 & 0.009939 & 0.0843 & 0.466511 \tabularnewline
38 & -0.001157 & -0.0098 & 0.496097 \tabularnewline
39 & -0.061377 & -0.5208 & 0.302053 \tabularnewline
40 & 0.042292 & 0.3589 & 0.360374 \tabularnewline
41 & -0.022178 & -0.1882 & 0.425629 \tabularnewline
42 & 0.021128 & 0.1793 & 0.429112 \tabularnewline
43 & 0.033759 & 0.2865 & 0.387678 \tabularnewline
44 & -0.088118 & -0.7477 & 0.228537 \tabularnewline
45 & -0.02842 & -0.2412 & 0.405062 \tabularnewline
46 & -0.042554 & -0.3611 & 0.359547 \tabularnewline
47 & 0.032449 & 0.2753 & 0.391921 \tabularnewline
48 & 0.076818 & 0.6518 & 0.258295 \tabularnewline
\hline
\end{tabular}
%Source: https://freestatistics.org/blog/index.php?pk=277931&T=1

[TABLE]
[ROW][C]Autocorrelation Function[/C][/ROW]
[ROW][C]Time lag k[/C][C]ACF(k)[/C][C]T-STAT[/C][C]P-value[/C][/ROW]
[ROW][C]1[/C][C]0.177033[/C][C]1.5022[/C][C]0.068712[/C][/ROW]
[ROW][C]2[/C][C]0.060511[/C][C]0.5135[/C][C]0.304603[/C][/ROW]
[ROW][C]3[/C][C]-0.014131[/C][C]-0.1199[/C][C]0.452448[/C][/ROW]
[ROW][C]4[/C][C]-0.143296[/C][C]-1.2159[/C][C]0.113996[/C][/ROW]
[ROW][C]5[/C][C]0.06659[/C][C]0.565[/C][C]0.286903[/C][/ROW]
[ROW][C]6[/C][C]-0.019418[/C][C]-0.1648[/C][C]0.434794[/C][/ROW]
[ROW][C]7[/C][C]-0.116996[/C][C]-0.9927[/C][C]0.16208[/C][/ROW]
[ROW][C]8[/C][C]-0.178936[/C][C]-1.5183[/C][C]0.066656[/C][/ROW]
[ROW][C]9[/C][C]0.042975[/C][C]0.3647[/C][C]0.358219[/C][/ROW]
[ROW][C]10[/C][C]-0.050819[/C][C]-0.4312[/C][C]0.3338[/C][/ROW]
[ROW][C]11[/C][C]-0.033724[/C][C]-0.2862[/C][C]0.38779[/C][/ROW]
[ROW][C]12[/C][C]-0.012909[/C][C]-0.1095[/C][C]0.456541[/C][/ROW]
[ROW][C]13[/C][C]-0.154741[/C][C]-1.313[/C][C]0.096673[/C][/ROW]
[ROW][C]14[/C][C]0.142568[/C][C]1.2097[/C][C]0.11517[/C][/ROW]
[ROW][C]15[/C][C]0.004774[/C][C]0.0405[/C][C]0.483901[/C][/ROW]
[ROW][C]16[/C][C]-0.042976[/C][C]-0.3647[/C][C]0.358216[/C][/ROW]
[ROW][C]17[/C][C]-0.049151[/C][C]-0.4171[/C][C]0.338937[/C][/ROW]
[ROW][C]18[/C][C]-0.096785[/C][C]-0.8212[/C][C]0.207108[/C][/ROW]
[ROW][C]19[/C][C]0.047135[/C][C]0.4[/C][C]0.345186[/C][/ROW]
[ROW][C]20[/C][C]0.07115[/C][C]0.6037[/C][C]0.27396[/C][/ROW]
[ROW][C]21[/C][C]0.109264[/C][C]0.9271[/C][C]0.178477[/C][/ROW]
[ROW][C]22[/C][C]-0.091568[/C][C]-0.777[/C][C]0.219859[/C][/ROW]
[ROW][C]23[/C][C]-0.038183[/C][C]-0.324[/C][C]0.373441[/C][/ROW]
[ROW][C]24[/C][C]-0.046599[/C][C]-0.3954[/C][C]0.346856[/C][/ROW]
[ROW][C]25[/C][C]-0.064124[/C][C]-0.5441[/C][C]0.294023[/C][/ROW]
[ROW][C]26[/C][C]0.008211[/C][C]0.0697[/C][C]0.472323[/C][/ROW]
[ROW][C]27[/C][C]-0.090273[/C][C]-0.766[/C][C]0.223093[/C][/ROW]
[ROW][C]28[/C][C]0.036551[/C][C]0.3101[/C][C]0.378672[/C][/ROW]
[ROW][C]29[/C][C]0.006441[/C][C]0.0547[/C][C]0.478283[/C][/ROW]
[ROW][C]30[/C][C]-0.082259[/C][C]-0.698[/C][C]0.243715[/C][/ROW]
[ROW][C]31[/C][C]0.029074[/C][C]0.2467[/C][C]0.402919[/C][/ROW]
[ROW][C]32[/C][C]-0.030336[/C][C]-0.2574[/C][C]0.398797[/C][/ROW]
[ROW][C]33[/C][C]0.019202[/C][C]0.1629[/C][C]0.435514[/C][/ROW]
[ROW][C]34[/C][C]0.037926[/C][C]0.3218[/C][C]0.374264[/C][/ROW]
[ROW][C]35[/C][C]0.067306[/C][C]0.5711[/C][C]0.28485[/C][/ROW]
[ROW][C]36[/C][C]-0.045432[/C][C]-0.3855[/C][C]0.350499[/C][/ROW]
[ROW][C]37[/C][C]0.009939[/C][C]0.0843[/C][C]0.466511[/C][/ROW]
[ROW][C]38[/C][C]-0.001157[/C][C]-0.0098[/C][C]0.496097[/C][/ROW]
[ROW][C]39[/C][C]-0.061377[/C][C]-0.5208[/C][C]0.302053[/C][/ROW]
[ROW][C]40[/C][C]0.042292[/C][C]0.3589[/C][C]0.360374[/C][/ROW]
[ROW][C]41[/C][C]-0.022178[/C][C]-0.1882[/C][C]0.425629[/C][/ROW]
[ROW][C]42[/C][C]0.021128[/C][C]0.1793[/C][C]0.429112[/C][/ROW]
[ROW][C]43[/C][C]0.033759[/C][C]0.2865[/C][C]0.387678[/C][/ROW]
[ROW][C]44[/C][C]-0.088118[/C][C]-0.7477[/C][C]0.228537[/C][/ROW]
[ROW][C]45[/C][C]-0.02842[/C][C]-0.2412[/C][C]0.405062[/C][/ROW]
[ROW][C]46[/C][C]-0.042554[/C][C]-0.3611[/C][C]0.359547[/C][/ROW]
[ROW][C]47[/C][C]0.032449[/C][C]0.2753[/C][C]0.391921[/C][/ROW]
[ROW][C]48[/C][C]0.076818[/C][C]0.6518[/C][C]0.258295[/C][/ROW]
[/TABLE]
Source: https://freestatistics.org/blog/index.php?pk=277931&T=1

Globally Unique Identifier (entire table): ba.freestatistics.org/blog/index.php?pk=277931&T=1

As an alternative you can also use a QR Code:  

The GUIDs for individual cells are displayed in the table below:

Autocorrelation Function
Time lag kACF(k)T-STATP-value
10.1770331.50220.068712
20.0605110.51350.304603
3-0.014131-0.11990.452448
4-0.143296-1.21590.113996
50.066590.5650.286903
6-0.019418-0.16480.434794
7-0.116996-0.99270.16208
8-0.178936-1.51830.066656
90.0429750.36470.358219
10-0.050819-0.43120.3338
11-0.033724-0.28620.38779
12-0.012909-0.10950.456541
13-0.154741-1.3130.096673
140.1425681.20970.11517
150.0047740.04050.483901
16-0.042976-0.36470.358216
17-0.049151-0.41710.338937
18-0.096785-0.82120.207108
190.0471350.40.345186
200.071150.60370.27396
210.1092640.92710.178477
22-0.091568-0.7770.219859
23-0.038183-0.3240.373441
24-0.046599-0.39540.346856
25-0.064124-0.54410.294023
260.0082110.06970.472323
27-0.090273-0.7660.223093
280.0365510.31010.378672
290.0064410.05470.478283
30-0.082259-0.6980.243715
310.0290740.24670.402919
32-0.030336-0.25740.398797
330.0192020.16290.435514
340.0379260.32180.374264
350.0673060.57110.28485
36-0.045432-0.38550.350499
370.0099390.08430.466511
38-0.001157-0.00980.496097
39-0.061377-0.52080.302053
400.0422920.35890.360374
41-0.022178-0.18820.425629
420.0211280.17930.429112
430.0337590.28650.387678
44-0.088118-0.74770.228537
45-0.02842-0.24120.405062
46-0.042554-0.36110.359547
470.0324490.27530.391921
480.0768180.65180.258295


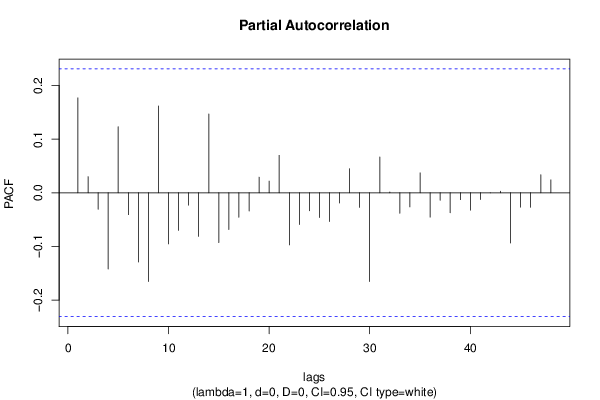
Partial Autocorrelation Function
Time lag kPACF(k)T-STATP-value
10.1770331.50220.068712
20.0301140.25550.399522
3-0.030845-0.26170.397138
4-0.142253-1.20710.115681
50.1233351.04650.149409
6-0.040748-0.34580.365267
7-0.129129-1.09570.138433
8-0.165587-1.40510.082153
90.1619981.37460.086759
10-0.095333-0.80890.210612
11-0.070085-0.59470.276957
12-0.023011-0.19530.422871
13-0.081224-0.68920.246455
140.1469781.24720.108191
15-0.092874-0.78810.216625
16-0.068558-0.58170.281283
17-0.045735-0.38810.349554
18-0.034017-0.28860.38684
190.0291880.24770.402549
200.0218410.18530.426746
210.0698820.5930.277529
22-0.097191-0.82470.206134
23-0.059286-0.50310.308231
24-0.033625-0.28530.388109
25-0.045982-0.39020.348782
26-0.053681-0.45550.325061
27-0.018928-0.16060.436424
280.0448830.38080.35222
29-0.027132-0.23020.409287
30-0.165317-1.40280.082493
310.0666510.56560.286728
320.0014450.01230.495126
33-0.038051-0.32290.373862
34-0.026249-0.22270.412187
350.0372390.3160.376465
36-0.045419-0.38540.35054
37-0.013894-0.11790.453241
38-0.037245-0.3160.376447
39-0.012725-0.1080.457159
40-0.032376-0.27470.392158
41-0.012629-0.10720.457481
423e-0600.49999
430.0028560.02420.490366
44-0.093724-0.79530.214534
45-0.026723-0.22680.41063
46-0.026997-0.22910.409728
470.0338380.28710.38742
480.024090.20440.419304

\begin{tabular}{lllllllll}
\hline
Partial Autocorrelation Function \tabularnewline
Time lag k & PACF(k) & T-STAT & P-value \tabularnewline
1 & 0.177033 & 1.5022 & 0.068712 \tabularnewline
2 & 0.030114 & 0.2555 & 0.399522 \tabularnewline
3 & -0.030845 & -0.2617 & 0.397138 \tabularnewline
4 & -0.142253 & -1.2071 & 0.115681 \tabularnewline
5 & 0.123335 & 1.0465 & 0.149409 \tabularnewline
6 & -0.040748 & -0.3458 & 0.365267 \tabularnewline
7 & -0.129129 & -1.0957 & 0.138433 \tabularnewline
8 & -0.165587 & -1.4051 & 0.082153 \tabularnewline
9 & 0.161998 & 1.3746 & 0.086759 \tabularnewline
10 & -0.095333 & -0.8089 & 0.210612 \tabularnewline
11 & -0.070085 & -0.5947 & 0.276957 \tabularnewline
12 & -0.023011 & -0.1953 & 0.422871 \tabularnewline
13 & -0.081224 & -0.6892 & 0.246455 \tabularnewline
14 & 0.146978 & 1.2472 & 0.108191 \tabularnewline
15 & -0.092874 & -0.7881 & 0.216625 \tabularnewline
16 & -0.068558 & -0.5817 & 0.281283 \tabularnewline
17 & -0.045735 & -0.3881 & 0.349554 \tabularnewline
18 & -0.034017 & -0.2886 & 0.38684 \tabularnewline
19 & 0.029188 & 0.2477 & 0.402549 \tabularnewline
20 & 0.021841 & 0.1853 & 0.426746 \tabularnewline
21 & 0.069882 & 0.593 & 0.277529 \tabularnewline
22 & -0.097191 & -0.8247 & 0.206134 \tabularnewline
23 & -0.059286 & -0.5031 & 0.308231 \tabularnewline
24 & -0.033625 & -0.2853 & 0.388109 \tabularnewline
25 & -0.045982 & -0.3902 & 0.348782 \tabularnewline
26 & -0.053681 & -0.4555 & 0.325061 \tabularnewline
27 & -0.018928 & -0.1606 & 0.436424 \tabularnewline
28 & 0.044883 & 0.3808 & 0.35222 \tabularnewline
29 & -0.027132 & -0.2302 & 0.409287 \tabularnewline
30 & -0.165317 & -1.4028 & 0.082493 \tabularnewline
31 & 0.066651 & 0.5656 & 0.286728 \tabularnewline
32 & 0.001445 & 0.0123 & 0.495126 \tabularnewline
33 & -0.038051 & -0.3229 & 0.373862 \tabularnewline
34 & -0.026249 & -0.2227 & 0.412187 \tabularnewline
35 & 0.037239 & 0.316 & 0.376465 \tabularnewline
36 & -0.045419 & -0.3854 & 0.35054 \tabularnewline
37 & -0.013894 & -0.1179 & 0.453241 \tabularnewline
38 & -0.037245 & -0.316 & 0.376447 \tabularnewline
39 & -0.012725 & -0.108 & 0.457159 \tabularnewline
40 & -0.032376 & -0.2747 & 0.392158 \tabularnewline
41 & -0.012629 & -0.1072 & 0.457481 \tabularnewline
42 & 3e-06 & 0 & 0.49999 \tabularnewline
43 & 0.002856 & 0.0242 & 0.490366 \tabularnewline
44 & -0.093724 & -0.7953 & 0.214534 \tabularnewline
45 & -0.026723 & -0.2268 & 0.41063 \tabularnewline
46 & -0.026997 & -0.2291 & 0.409728 \tabularnewline
47 & 0.033838 & 0.2871 & 0.38742 \tabularnewline
48 & 0.02409 & 0.2044 & 0.419304 \tabularnewline
\hline
\end{tabular}
%Source: https://freestatistics.org/blog/index.php?pk=277931&T=2

[TABLE]
[ROW][C]Partial Autocorrelation Function[/C][/ROW]
[ROW][C]Time lag k[/C][C]PACF(k)[/C][C]T-STAT[/C][C]P-value[/C][/ROW]
[ROW][C]1[/C][C]0.177033[/C][C]1.5022[/C][C]0.068712[/C][/ROW]
[ROW][C]2[/C][C]0.030114[/C][C]0.2555[/C][C]0.399522[/C][/ROW]
[ROW][C]3[/C][C]-0.030845[/C][C]-0.2617[/C][C]0.397138[/C][/ROW]
[ROW][C]4[/C][C]-0.142253[/C][C]-1.2071[/C][C]0.115681[/C][/ROW]
[ROW][C]5[/C][C]0.123335[/C][C]1.0465[/C][C]0.149409[/C][/ROW]
[ROW][C]6[/C][C]-0.040748[/C][C]-0.3458[/C][C]0.365267[/C][/ROW]
[ROW][C]7[/C][C]-0.129129[/C][C]-1.0957[/C][C]0.138433[/C][/ROW]
[ROW][C]8[/C][C]-0.165587[/C][C]-1.4051[/C][C]0.082153[/C][/ROW]
[ROW][C]9[/C][C]0.161998[/C][C]1.3746[/C][C]0.086759[/C][/ROW]
[ROW][C]10[/C][C]-0.095333[/C][C]-0.8089[/C][C]0.210612[/C][/ROW]
[ROW][C]11[/C][C]-0.070085[/C][C]-0.5947[/C][C]0.276957[/C][/ROW]
[ROW][C]12[/C][C]-0.023011[/C][C]-0.1953[/C][C]0.422871[/C][/ROW]
[ROW][C]13[/C][C]-0.081224[/C][C]-0.6892[/C][C]0.246455[/C][/ROW]
[ROW][C]14[/C][C]0.146978[/C][C]1.2472[/C][C]0.108191[/C][/ROW]
[ROW][C]15[/C][C]-0.092874[/C][C]-0.7881[/C][C]0.216625[/C][/ROW]
[ROW][C]16[/C][C]-0.068558[/C][C]-0.5817[/C][C]0.281283[/C][/ROW]
[ROW][C]17[/C][C]-0.045735[/C][C]-0.3881[/C][C]0.349554[/C][/ROW]
[ROW][C]18[/C][C]-0.034017[/C][C]-0.2886[/C][C]0.38684[/C][/ROW]
[ROW][C]19[/C][C]0.029188[/C][C]0.2477[/C][C]0.402549[/C][/ROW]
[ROW][C]20[/C][C]0.021841[/C][C]0.1853[/C][C]0.426746[/C][/ROW]
[ROW][C]21[/C][C]0.069882[/C][C]0.593[/C][C]0.277529[/C][/ROW]
[ROW][C]22[/C][C]-0.097191[/C][C]-0.8247[/C][C]0.206134[/C][/ROW]
[ROW][C]23[/C][C]-0.059286[/C][C]-0.5031[/C][C]0.308231[/C][/ROW]
[ROW][C]24[/C][C]-0.033625[/C][C]-0.2853[/C][C]0.388109[/C][/ROW]
[ROW][C]25[/C][C]-0.045982[/C][C]-0.3902[/C][C]0.348782[/C][/ROW]
[ROW][C]26[/C][C]-0.053681[/C][C]-0.4555[/C][C]0.325061[/C][/ROW]
[ROW][C]27[/C][C]-0.018928[/C][C]-0.1606[/C][C]0.436424[/C][/ROW]
[ROW][C]28[/C][C]0.044883[/C][C]0.3808[/C][C]0.35222[/C][/ROW]
[ROW][C]29[/C][C]-0.027132[/C][C]-0.2302[/C][C]0.409287[/C][/ROW]
[ROW][C]30[/C][C]-0.165317[/C][C]-1.4028[/C][C]0.082493[/C][/ROW]
[ROW][C]31[/C][C]0.066651[/C][C]0.5656[/C][C]0.286728[/C][/ROW]
[ROW][C]32[/C][C]0.001445[/C][C]0.0123[/C][C]0.495126[/C][/ROW]
[ROW][C]33[/C][C]-0.038051[/C][C]-0.3229[/C][C]0.373862[/C][/ROW]
[ROW][C]34[/C][C]-0.026249[/C][C]-0.2227[/C][C]0.412187[/C][/ROW]
[ROW][C]35[/C][C]0.037239[/C][C]0.316[/C][C]0.376465[/C][/ROW]
[ROW][C]36[/C][C]-0.045419[/C][C]-0.3854[/C][C]0.35054[/C][/ROW]
[ROW][C]37[/C][C]-0.013894[/C][C]-0.1179[/C][C]0.453241[/C][/ROW]
[ROW][C]38[/C][C]-0.037245[/C][C]-0.316[/C][C]0.376447[/C][/ROW]
[ROW][C]39[/C][C]-0.012725[/C][C]-0.108[/C][C]0.457159[/C][/ROW]
[ROW][C]40[/C][C]-0.032376[/C][C]-0.2747[/C][C]0.392158[/C][/ROW]
[ROW][C]41[/C][C]-0.012629[/C][C]-0.1072[/C][C]0.457481[/C][/ROW]
[ROW][C]42[/C][C]3e-06[/C][C]0[/C][C]0.49999[/C][/ROW]
[ROW][C]43[/C][C]0.002856[/C][C]0.0242[/C][C]0.490366[/C][/ROW]
[ROW][C]44[/C][C]-0.093724[/C][C]-0.7953[/C][C]0.214534[/C][/ROW]
[ROW][C]45[/C][C]-0.026723[/C][C]-0.2268[/C][C]0.41063[/C][/ROW]
[ROW][C]46[/C][C]-0.026997[/C][C]-0.2291[/C][C]0.409728[/C][/ROW]
[ROW][C]47[/C][C]0.033838[/C][C]0.2871[/C][C]0.38742[/C][/ROW]
[ROW][C]48[/C][C]0.02409[/C][C]0.2044[/C][C]0.419304[/C][/ROW]
[/TABLE]
Source: https://freestatistics.org/blog/index.php?pk=277931&T=2

Globally Unique Identifier (entire table): ba.freestatistics.org/blog/index.php?pk=277931&T=2

As an alternative you can also use a QR Code:  

The GUIDs for individual cells are displayed in the table below:

Partial Autocorrelation Function
Time lag kPACF(k)T-STATP-value
10.1770331.50220.068712
20.0301140.25550.399522
3-0.030845-0.26170.397138
4-0.142253-1.20710.115681
50.1233351.04650.149409
6-0.040748-0.34580.365267
7-0.129129-1.09570.138433
8-0.165587-1.40510.082153
90.1619981.37460.086759
10-0.095333-0.80890.210612
11-0.070085-0.59470.276957
12-0.023011-0.19530.422871
13-0.081224-0.68920.246455
140.1469781.24720.108191
15-0.092874-0.78810.216625
16-0.068558-0.58170.281283
17-0.045735-0.38810.349554
18-0.034017-0.28860.38684
190.0291880.24770.402549
200.0218410.18530.426746
210.0698820.5930.277529
22-0.097191-0.82470.206134
23-0.059286-0.50310.308231
24-0.033625-0.28530.388109
25-0.045982-0.39020.348782
26-0.053681-0.45550.325061
27-0.018928-0.16060.436424
280.0448830.38080.35222
29-0.027132-0.23020.409287
30-0.165317-1.40280.082493
310.0666510.56560.286728
320.0014450.01230.495126
33-0.038051-0.32290.373862
34-0.026249-0.22270.412187
350.0372390.3160.376465
36-0.045419-0.38540.35054
37-0.013894-0.11790.453241
38-0.037245-0.3160.376447
39-0.012725-0.1080.457159
40-0.032376-0.27470.392158
41-0.012629-0.10720.457481
423e-0600.49999
430.0028560.02420.490366
44-0.093724-0.79530.214534
45-0.026723-0.22680.41063
46-0.026997-0.22910.409728
470.0338380.28710.38742
480.024090.20440.419304


Parameters (Session):
par1 = 48 ; par2 = 1 ; par3 = 0 ; par4 = 0 ; par5 = 12 ; par6 = White Noise ; par7 = 0.95 ;
Parameters (R input):
par1 = 48 ; par2 = 1 ; par3 = 0 ; par4 = 0 ; par5 = 12 ; par6 = White Noise ; par7 = 0.95 ; par8 = ;
R code (references can be found in the software module):
par8 <- ''
par7 <- '0.95'
par6 <- 'White Noise'
par5 <- '12'
par4 <- '0'
par3 <- '0'
par2 <- '1'
par1 <- '48'
if (par1 == 'Default') {
par1 = 10*log10(length(x))
} else {
par1 <- as.numeric(par1)
}
par2 <- as.numeric(par2)
par3 <- as.numeric(par3)
par4 <- as.numeric(par4)
par5 <- as.numeric(par5)
if (par6 == 'White Noise') par6 <- 'white' else par6 <- 'ma'
par7 <- as.numeric(par7)
if (par8 != '') par8 <- as.numeric(par8)
ox <- x
if (par8 == '') {
if (par2 == 0) {
x <- log(x)
} else {
x <- (x ^ par2 - 1) / par2
}
} else {
x <- log(x,base=par8)
}
if (par3 > 0) x <- diff(x,lag=1,difference=par3)
if (par4 > 0) x <- diff(x,lag=par5,difference=par4)
bitmap(file='picts.png')
op <- par(mfrow=c(2,1))
plot(ox,type='l',main='Original Time Series',xlab='time',ylab='value')
if (par8=='') {
mytitle <- paste('Working Time Series (lambda=',par2,', d=',par3,', D=',par4,')',sep='')
mysub <- paste('(lambda=',par2,', d=',par3,', D=',par4,', CI=', par7, ', CI type=',par6,')',sep='')
} else {
mytitle <- paste('Working Time Series (base=',par8,', d=',par3,', D=',par4,')',sep='')
mysub <- paste('(base=',par8,', d=',par3,', D=',par4,', CI=', par7, ', CI type=',par6,')',sep='')
}
plot(x,type='l', main=mytitle,xlab='time',ylab='value')
par(op)
dev.off()
bitmap(file='pic1.png')
racf <- acf(x, par1, main='Autocorrelation', xlab='time lag', ylab='ACF', ci.type=par6, ci=par7, sub=mysub)
dev.off()
bitmap(file='pic2.png')
rpacf <- pacf(x,par1,main='Partial Autocorrelation',xlab='lags',ylab='PACF',sub=mysub)
dev.off()
(myacf <- c(racf$acf))
(mypacf <- c(rpacf$acf))
lengthx <- length(x)
sqrtn <- sqrt(lengthx)
load(file='createtable')
a<-table.start()
a<-table.row.start(a)
a<-table.element(a,'Autocorrelation Function',4,TRUE)
a<-table.row.end(a)
a<-table.row.start(a)
a<-table.element(a,'Time lag k',header=TRUE)
a<-table.element(a,hyperlink('basics.htm','ACF(k)','click here for more information about the Autocorrelation Function'),header=TRUE)
a<-table.element(a,'T-STAT',header=TRUE)
a<-table.element(a,'P-value',header=TRUE)
a<-table.row.end(a)
for (i in 2:(par1+1)) {
a<-table.row.start(a)
a<-table.element(a,i-1,header=TRUE)
a<-table.element(a,round(myacf[i],6))
mytstat <- myacf[i]*sqrtn
a<-table.element(a,round(mytstat,4))
a<-table.element(a,round(1-pt(abs(mytstat),lengthx),6))
a<-table.row.end(a)
}
a<-table.end(a)
table.save(a,file='mytable.tab')
a<-table.start()
a<-table.row.start(a)
a<-table.element(a,'Partial Autocorrelation Function',4,TRUE)
a<-table.row.end(a)
a<-table.row.start(a)
a<-table.element(a,'Time lag k',header=TRUE)
a<-table.element(a,hyperlink('basics.htm','PACF(k)','click here for more information about the Partial Autocorrelation Function'),header=TRUE)
a<-table.element(a,'T-STAT',header=TRUE)
a<-table.element(a,'P-value',header=TRUE)
a<-table.row.end(a)
for (i in 1:par1) {
a<-table.row.start(a)
a<-table.element(a,i,header=TRUE)
a<-table.element(a,round(mypacf[i],6))
mytstat <- mypacf[i]*sqrtn
a<-table.element(a,round(mytstat,4))
a<-table.element(a,round(1-pt(abs(mytstat),lengthx),6))
a<-table.row.end(a)
}
a<-table.end(a)
table.save(a,file='mytable1.tab')