Free Statistics

of Irreproducible Research!

Author's title

Author*Unverified author*
R Software Modulerwasp_autocorrelation.wasp
Title produced by software(Partial) Autocorrelation Function
Date of computationWed, 04 Mar 2015 23:49:43 +0000
Cite this page as followsStatistical Computations at FreeStatistics.org, Office for Research Development and Education, URL https://freestatistics.org/blog/index.php?v=date/2015/Mar/04/t1425513046mblx5z27r5dr7g7.htm/, Retrieved Sun, 19 May 2024 13:08:17 +0000
Statistical Computations at FreeStatistics.org, Office for Research Development and Education, URL https://freestatistics.org/blog/index.php?pk=277917, Retrieved Sun, 19 May 2024 13:08:17 +0000
QR Codes:

Original text written by user:
IsPrivate?No (this computation is public)
User-defined keywords
Estimated Impact168
Family? (F = Feedback message, R = changed R code, M = changed R Module, P = changed Parameters, D = changed Data)
-       [(Partial) Autocorrelation Function] [] [2015-03-04 23:49:43] [9c6f291f5313961eaf08153dbee9a7d3] [Current]
Feedback Forum

Post a new message
Dataseries X:
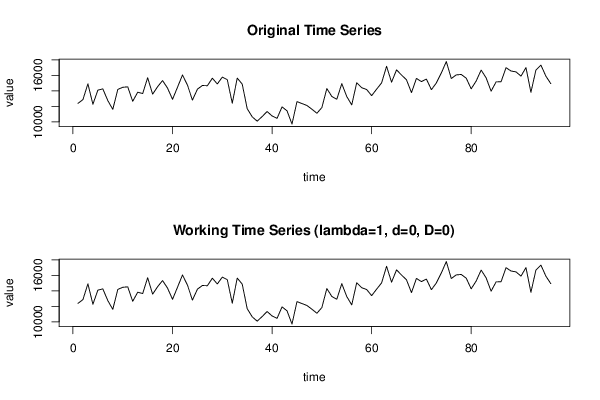
12374,6
12864,7
14905,8
12259,7
14088,9
14243,7
12732,8
11612
14176,6
14452,6
14512,7
12645,1
13820,5
13644,7
15684,1
13568,3
14531,1
15320,1
14344,2
12899,4
14462
16044,7
14731,2
12798,3
14213,1
14683,3
14652
15623,1
14880,4
15765,7
15433,1
12402,6
15639,8
14861,7
11699,4
10651,9
10086,9
10676,9
11332,1
10756,1
10450,5
11930,2
11419,9
9713,1
12608,5
12357,2
12107,9
11627,2
11105,9
11841,6
14290,8
13271,7
12909,4
14924,1
13257,4
12184,4
15035,5
14401
14165
13375,6
14210,8
15017,5
17157,8
15106,2
16696,1
16035,9
15418,9
13763,9
15595,2
15183,1
15515,9
14142,8
15012,7
16293,2
17771,4
15582,8
16049,9
16105,8
15623,6
14254,9
15266,8
16671
15665,4
13949,5
15146,9
15172,9
16981,4
16553,8
16438,5
15895,1
16989
13803,5
16678,3
17315,1
15895,4
14912,1


Summary of computational transaction
Raw Inputview raw input (R code)
Raw Outputview raw output of R engine
Computing time2 seconds
R Server'Sir Maurice George Kendall' @ kendall.wessa.net

\begin{tabular}{lllllllll}
\hline
Summary of computational transaction \tabularnewline
Raw Input & view raw input (R code)  \tabularnewline
Raw Output & view raw output of R engine  \tabularnewline
Computing time & 2 seconds \tabularnewline
R Server & 'Sir Maurice George Kendall' @ kendall.wessa.net \tabularnewline
\hline
\end{tabular}
%Source: https://freestatistics.org/blog/index.php?pk=277917&T=0

[TABLE]
[ROW][C]Summary of computational transaction[/C][/ROW]
[ROW][C]Raw Input[/C][C]view raw input (R code) [/C][/ROW]
[ROW][C]Raw Output[/C][C]view raw output of R engine [/C][/ROW]
[ROW][C]Computing time[/C][C]2 seconds[/C][/ROW]
[ROW][C]R Server[/C][C]'Sir Maurice George Kendall' @ kendall.wessa.net[/C][/ROW]
[/TABLE]
Source: https://freestatistics.org/blog/index.php?pk=277917&T=0

Globally Unique Identifier (entire table): ba.freestatistics.org/blog/index.php?pk=277917&T=0

As an alternative you can also use a QR Code:  

The GUIDs for individual cells are displayed in the table below:

Summary of computational transaction
Raw Inputview raw input (R code)
Raw Outputview raw output of R engine
Computing time2 seconds
R Server'Sir Maurice George Kendall' @ kendall.wessa.net


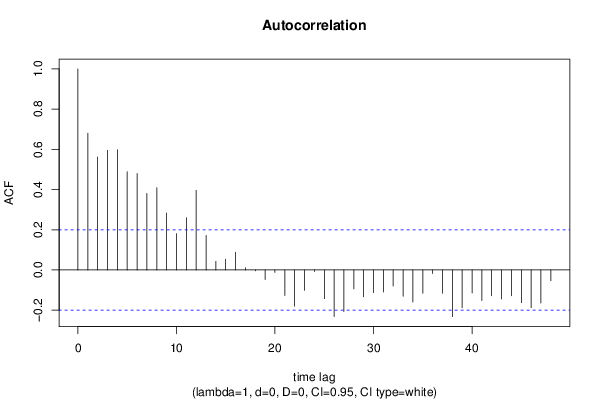
Autocorrelation Function
Time lag kACF(k)T-STATP-value
10.6799766.66240
20.5616975.50350
30.5952065.83180
40.5977975.85720
50.4885874.78723e-06
60.4796084.69924e-06
70.3804873.7280.000163
80.4092224.00956e-05
90.2836792.77950.003276
100.1810371.77380.039634
110.2599712.54720.006224
120.3962273.88229.5e-05
130.1719841.68510.04761
140.0429890.42120.337273
150.0533580.52280.301159
160.0882320.86450.194737
170.0113240.11090.455945
18-0.004298-0.04210.48325
19-0.047619-0.46660.320934
20-0.012149-0.1190.452749
21-0.127265-1.24690.107727
22-0.180029-1.76390.040463
23-0.101458-0.99410.161342
24-0.007676-0.07520.470102
25-0.142632-1.39750.082742
26-0.231527-2.26850.01277
27-0.206765-2.02590.022777
28-0.094175-0.92270.179234
29-0.133508-1.30810.09698
30-0.112572-1.1030.136398
31-0.109703-1.07490.142564
32-0.079492-0.77890.218988
33-0.130732-1.28090.101656
34-0.158897-1.55690.061397
35-0.115751-1.13410.129784
36-0.01748-0.17130.432188
37-0.115777-1.13440.12973
38-0.232151-2.27460.012578
39-0.187731-1.83940.034475
40-0.114236-1.11930.132906
41-0.152139-1.49070.069666
42-0.128162-1.25570.106131
43-0.144088-1.41180.080625
44-0.128429-1.25830.105659
45-0.162981-1.59690.05679
46-0.187376-1.83590.034733
47-0.164304-1.60980.055358
48-0.054004-0.52910.298968

\begin{tabular}{lllllllll}
\hline
Autocorrelation Function \tabularnewline
Time lag k & ACF(k) & T-STAT & P-value \tabularnewline
1 & 0.679976 & 6.6624 & 0 \tabularnewline
2 & 0.561697 & 5.5035 & 0 \tabularnewline
3 & 0.595206 & 5.8318 & 0 \tabularnewline
4 & 0.597797 & 5.8572 & 0 \tabularnewline
5 & 0.488587 & 4.7872 & 3e-06 \tabularnewline
6 & 0.479608 & 4.6992 & 4e-06 \tabularnewline
7 & 0.380487 & 3.728 & 0.000163 \tabularnewline
8 & 0.409222 & 4.0095 & 6e-05 \tabularnewline
9 & 0.283679 & 2.7795 & 0.003276 \tabularnewline
10 & 0.181037 & 1.7738 & 0.039634 \tabularnewline
11 & 0.259971 & 2.5472 & 0.006224 \tabularnewline
12 & 0.396227 & 3.8822 & 9.5e-05 \tabularnewline
13 & 0.171984 & 1.6851 & 0.04761 \tabularnewline
14 & 0.042989 & 0.4212 & 0.337273 \tabularnewline
15 & 0.053358 & 0.5228 & 0.301159 \tabularnewline
16 & 0.088232 & 0.8645 & 0.194737 \tabularnewline
17 & 0.011324 & 0.1109 & 0.455945 \tabularnewline
18 & -0.004298 & -0.0421 & 0.48325 \tabularnewline
19 & -0.047619 & -0.4666 & 0.320934 \tabularnewline
20 & -0.012149 & -0.119 & 0.452749 \tabularnewline
21 & -0.127265 & -1.2469 & 0.107727 \tabularnewline
22 & -0.180029 & -1.7639 & 0.040463 \tabularnewline
23 & -0.101458 & -0.9941 & 0.161342 \tabularnewline
24 & -0.007676 & -0.0752 & 0.470102 \tabularnewline
25 & -0.142632 & -1.3975 & 0.082742 \tabularnewline
26 & -0.231527 & -2.2685 & 0.01277 \tabularnewline
27 & -0.206765 & -2.0259 & 0.022777 \tabularnewline
28 & -0.094175 & -0.9227 & 0.179234 \tabularnewline
29 & -0.133508 & -1.3081 & 0.09698 \tabularnewline
30 & -0.112572 & -1.103 & 0.136398 \tabularnewline
31 & -0.109703 & -1.0749 & 0.142564 \tabularnewline
32 & -0.079492 & -0.7789 & 0.218988 \tabularnewline
33 & -0.130732 & -1.2809 & 0.101656 \tabularnewline
34 & -0.158897 & -1.5569 & 0.061397 \tabularnewline
35 & -0.115751 & -1.1341 & 0.129784 \tabularnewline
36 & -0.01748 & -0.1713 & 0.432188 \tabularnewline
37 & -0.115777 & -1.1344 & 0.12973 \tabularnewline
38 & -0.232151 & -2.2746 & 0.012578 \tabularnewline
39 & -0.187731 & -1.8394 & 0.034475 \tabularnewline
40 & -0.114236 & -1.1193 & 0.132906 \tabularnewline
41 & -0.152139 & -1.4907 & 0.069666 \tabularnewline
42 & -0.128162 & -1.2557 & 0.106131 \tabularnewline
43 & -0.144088 & -1.4118 & 0.080625 \tabularnewline
44 & -0.128429 & -1.2583 & 0.105659 \tabularnewline
45 & -0.162981 & -1.5969 & 0.05679 \tabularnewline
46 & -0.187376 & -1.8359 & 0.034733 \tabularnewline
47 & -0.164304 & -1.6098 & 0.055358 \tabularnewline
48 & -0.054004 & -0.5291 & 0.298968 \tabularnewline
\hline
\end{tabular}
%Source: https://freestatistics.org/blog/index.php?pk=277917&T=1

[TABLE]
[ROW][C]Autocorrelation Function[/C][/ROW]
[ROW][C]Time lag k[/C][C]ACF(k)[/C][C]T-STAT[/C][C]P-value[/C][/ROW]
[ROW][C]1[/C][C]0.679976[/C][C]6.6624[/C][C]0[/C][/ROW]
[ROW][C]2[/C][C]0.561697[/C][C]5.5035[/C][C]0[/C][/ROW]
[ROW][C]3[/C][C]0.595206[/C][C]5.8318[/C][C]0[/C][/ROW]
[ROW][C]4[/C][C]0.597797[/C][C]5.8572[/C][C]0[/C][/ROW]
[ROW][C]5[/C][C]0.488587[/C][C]4.7872[/C][C]3e-06[/C][/ROW]
[ROW][C]6[/C][C]0.479608[/C][C]4.6992[/C][C]4e-06[/C][/ROW]
[ROW][C]7[/C][C]0.380487[/C][C]3.728[/C][C]0.000163[/C][/ROW]
[ROW][C]8[/C][C]0.409222[/C][C]4.0095[/C][C]6e-05[/C][/ROW]
[ROW][C]9[/C][C]0.283679[/C][C]2.7795[/C][C]0.003276[/C][/ROW]
[ROW][C]10[/C][C]0.181037[/C][C]1.7738[/C][C]0.039634[/C][/ROW]
[ROW][C]11[/C][C]0.259971[/C][C]2.5472[/C][C]0.006224[/C][/ROW]
[ROW][C]12[/C][C]0.396227[/C][C]3.8822[/C][C]9.5e-05[/C][/ROW]
[ROW][C]13[/C][C]0.171984[/C][C]1.6851[/C][C]0.04761[/C][/ROW]
[ROW][C]14[/C][C]0.042989[/C][C]0.4212[/C][C]0.337273[/C][/ROW]
[ROW][C]15[/C][C]0.053358[/C][C]0.5228[/C][C]0.301159[/C][/ROW]
[ROW][C]16[/C][C]0.088232[/C][C]0.8645[/C][C]0.194737[/C][/ROW]
[ROW][C]17[/C][C]0.011324[/C][C]0.1109[/C][C]0.455945[/C][/ROW]
[ROW][C]18[/C][C]-0.004298[/C][C]-0.0421[/C][C]0.48325[/C][/ROW]
[ROW][C]19[/C][C]-0.047619[/C][C]-0.4666[/C][C]0.320934[/C][/ROW]
[ROW][C]20[/C][C]-0.012149[/C][C]-0.119[/C][C]0.452749[/C][/ROW]
[ROW][C]21[/C][C]-0.127265[/C][C]-1.2469[/C][C]0.107727[/C][/ROW]
[ROW][C]22[/C][C]-0.180029[/C][C]-1.7639[/C][C]0.040463[/C][/ROW]
[ROW][C]23[/C][C]-0.101458[/C][C]-0.9941[/C][C]0.161342[/C][/ROW]
[ROW][C]24[/C][C]-0.007676[/C][C]-0.0752[/C][C]0.470102[/C][/ROW]
[ROW][C]25[/C][C]-0.142632[/C][C]-1.3975[/C][C]0.082742[/C][/ROW]
[ROW][C]26[/C][C]-0.231527[/C][C]-2.2685[/C][C]0.01277[/C][/ROW]
[ROW][C]27[/C][C]-0.206765[/C][C]-2.0259[/C][C]0.022777[/C][/ROW]
[ROW][C]28[/C][C]-0.094175[/C][C]-0.9227[/C][C]0.179234[/C][/ROW]
[ROW][C]29[/C][C]-0.133508[/C][C]-1.3081[/C][C]0.09698[/C][/ROW]
[ROW][C]30[/C][C]-0.112572[/C][C]-1.103[/C][C]0.136398[/C][/ROW]
[ROW][C]31[/C][C]-0.109703[/C][C]-1.0749[/C][C]0.142564[/C][/ROW]
[ROW][C]32[/C][C]-0.079492[/C][C]-0.7789[/C][C]0.218988[/C][/ROW]
[ROW][C]33[/C][C]-0.130732[/C][C]-1.2809[/C][C]0.101656[/C][/ROW]
[ROW][C]34[/C][C]-0.158897[/C][C]-1.5569[/C][C]0.061397[/C][/ROW]
[ROW][C]35[/C][C]-0.115751[/C][C]-1.1341[/C][C]0.129784[/C][/ROW]
[ROW][C]36[/C][C]-0.01748[/C][C]-0.1713[/C][C]0.432188[/C][/ROW]
[ROW][C]37[/C][C]-0.115777[/C][C]-1.1344[/C][C]0.12973[/C][/ROW]
[ROW][C]38[/C][C]-0.232151[/C][C]-2.2746[/C][C]0.012578[/C][/ROW]
[ROW][C]39[/C][C]-0.187731[/C][C]-1.8394[/C][C]0.034475[/C][/ROW]
[ROW][C]40[/C][C]-0.114236[/C][C]-1.1193[/C][C]0.132906[/C][/ROW]
[ROW][C]41[/C][C]-0.152139[/C][C]-1.4907[/C][C]0.069666[/C][/ROW]
[ROW][C]42[/C][C]-0.128162[/C][C]-1.2557[/C][C]0.106131[/C][/ROW]
[ROW][C]43[/C][C]-0.144088[/C][C]-1.4118[/C][C]0.080625[/C][/ROW]
[ROW][C]44[/C][C]-0.128429[/C][C]-1.2583[/C][C]0.105659[/C][/ROW]
[ROW][C]45[/C][C]-0.162981[/C][C]-1.5969[/C][C]0.05679[/C][/ROW]
[ROW][C]46[/C][C]-0.187376[/C][C]-1.8359[/C][C]0.034733[/C][/ROW]
[ROW][C]47[/C][C]-0.164304[/C][C]-1.6098[/C][C]0.055358[/C][/ROW]
[ROW][C]48[/C][C]-0.054004[/C][C]-0.5291[/C][C]0.298968[/C][/ROW]
[/TABLE]
Source: https://freestatistics.org/blog/index.php?pk=277917&T=1

Globally Unique Identifier (entire table): ba.freestatistics.org/blog/index.php?pk=277917&T=1

As an alternative you can also use a QR Code:  

The GUIDs for individual cells are displayed in the table below:

Autocorrelation Function
Time lag kACF(k)T-STATP-value
10.6799766.66240
20.5616975.50350
30.5952065.83180
40.5977975.85720
50.4885874.78723e-06
60.4796084.69924e-06
70.3804873.7280.000163
80.4092224.00956e-05
90.2836792.77950.003276
100.1810371.77380.039634
110.2599712.54720.006224
120.3962273.88229.5e-05
130.1719841.68510.04761
140.0429890.42120.337273
150.0533580.52280.301159
160.0882320.86450.194737
170.0113240.11090.455945
18-0.004298-0.04210.48325
19-0.047619-0.46660.320934
20-0.012149-0.1190.452749
21-0.127265-1.24690.107727
22-0.180029-1.76390.040463
23-0.101458-0.99410.161342
24-0.007676-0.07520.470102
25-0.142632-1.39750.082742
26-0.231527-2.26850.01277
27-0.206765-2.02590.022777
28-0.094175-0.92270.179234
29-0.133508-1.30810.09698
30-0.112572-1.1030.136398
31-0.109703-1.07490.142564
32-0.079492-0.77890.218988
33-0.130732-1.28090.101656
34-0.158897-1.55690.061397
35-0.115751-1.13410.129784
36-0.01748-0.17130.432188
37-0.115777-1.13440.12973
38-0.232151-2.27460.012578
39-0.187731-1.83940.034475
40-0.114236-1.11930.132906
41-0.152139-1.49070.069666
42-0.128162-1.25570.106131
43-0.144088-1.41180.080625
44-0.128429-1.25830.105659
45-0.162981-1.59690.05679
46-0.187376-1.83590.034733
47-0.164304-1.60980.055358
48-0.054004-0.52910.298968


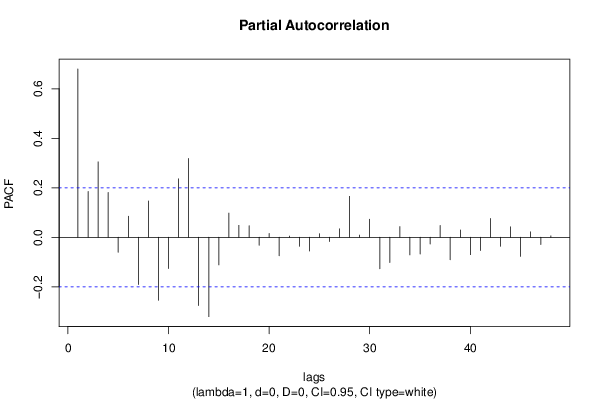
Partial Autocorrelation Function
Time lag kPACF(k)T-STATP-value
10.6799766.66240
20.1847541.81020.036696
30.3046562.9850.001799
40.1810211.77360.039647
5-0.060336-0.59120.277897
60.0849510.83230.20364
7-0.190816-1.86960.032293
80.1462281.43270.077591
9-0.254374-2.49230.007202
10-0.126543-1.23990.109024
110.235972.3120.011457
120.3180783.11650.001207
13-0.275887-2.70310.004062
14-0.320689-3.14210.001116
15-0.111596-1.09340.138475
160.0977090.95740.170398
170.0480980.47130.31926
180.0465190.45580.324786
19-0.032221-0.31570.376457
200.015180.14870.44104
21-0.075009-0.73490.232085
220.0047080.04610.481651
23-0.036198-0.35470.36181
24-0.055368-0.54250.294368
250.0144710.14180.443774
26-0.017029-0.16690.433919
270.0339310.33250.370136
280.1652451.61910.054357
290.0087710.08590.465846
300.0725730.71110.239383
31-0.127262-1.24690.107733
32-0.102215-1.00150.159551
330.0430190.42150.337167
34-0.071076-0.69640.243931
35-0.067785-0.66420.254091
36-0.02698-0.26430.39604
370.0478660.4690.320071
38-0.090602-0.88770.188456
390.0292590.28670.38749
40-0.070056-0.68640.247054
41-0.053486-0.52410.300724
420.0756490.74120.23019
43-0.03612-0.35390.362096
440.041920.41070.341092
45-0.077277-0.75720.225405
460.0219110.21470.415235
47-0.02898-0.28390.388534
480.0055940.05480.478201

\begin{tabular}{lllllllll}
\hline
Partial Autocorrelation Function \tabularnewline
Time lag k & PACF(k) & T-STAT & P-value \tabularnewline
1 & 0.679976 & 6.6624 & 0 \tabularnewline
2 & 0.184754 & 1.8102 & 0.036696 \tabularnewline
3 & 0.304656 & 2.985 & 0.001799 \tabularnewline
4 & 0.181021 & 1.7736 & 0.039647 \tabularnewline
5 & -0.060336 & -0.5912 & 0.277897 \tabularnewline
6 & 0.084951 & 0.8323 & 0.20364 \tabularnewline
7 & -0.190816 & -1.8696 & 0.032293 \tabularnewline
8 & 0.146228 & 1.4327 & 0.077591 \tabularnewline
9 & -0.254374 & -2.4923 & 0.007202 \tabularnewline
10 & -0.126543 & -1.2399 & 0.109024 \tabularnewline
11 & 0.23597 & 2.312 & 0.011457 \tabularnewline
12 & 0.318078 & 3.1165 & 0.001207 \tabularnewline
13 & -0.275887 & -2.7031 & 0.004062 \tabularnewline
14 & -0.320689 & -3.1421 & 0.001116 \tabularnewline
15 & -0.111596 & -1.0934 & 0.138475 \tabularnewline
16 & 0.097709 & 0.9574 & 0.170398 \tabularnewline
17 & 0.048098 & 0.4713 & 0.31926 \tabularnewline
18 & 0.046519 & 0.4558 & 0.324786 \tabularnewline
19 & -0.032221 & -0.3157 & 0.376457 \tabularnewline
20 & 0.01518 & 0.1487 & 0.44104 \tabularnewline
21 & -0.075009 & -0.7349 & 0.232085 \tabularnewline
22 & 0.004708 & 0.0461 & 0.481651 \tabularnewline
23 & -0.036198 & -0.3547 & 0.36181 \tabularnewline
24 & -0.055368 & -0.5425 & 0.294368 \tabularnewline
25 & 0.014471 & 0.1418 & 0.443774 \tabularnewline
26 & -0.017029 & -0.1669 & 0.433919 \tabularnewline
27 & 0.033931 & 0.3325 & 0.370136 \tabularnewline
28 & 0.165245 & 1.6191 & 0.054357 \tabularnewline
29 & 0.008771 & 0.0859 & 0.465846 \tabularnewline
30 & 0.072573 & 0.7111 & 0.239383 \tabularnewline
31 & -0.127262 & -1.2469 & 0.107733 \tabularnewline
32 & -0.102215 & -1.0015 & 0.159551 \tabularnewline
33 & 0.043019 & 0.4215 & 0.337167 \tabularnewline
34 & -0.071076 & -0.6964 & 0.243931 \tabularnewline
35 & -0.067785 & -0.6642 & 0.254091 \tabularnewline
36 & -0.02698 & -0.2643 & 0.39604 \tabularnewline
37 & 0.047866 & 0.469 & 0.320071 \tabularnewline
38 & -0.090602 & -0.8877 & 0.188456 \tabularnewline
39 & 0.029259 & 0.2867 & 0.38749 \tabularnewline
40 & -0.070056 & -0.6864 & 0.247054 \tabularnewline
41 & -0.053486 & -0.5241 & 0.300724 \tabularnewline
42 & 0.075649 & 0.7412 & 0.23019 \tabularnewline
43 & -0.03612 & -0.3539 & 0.362096 \tabularnewline
44 & 0.04192 & 0.4107 & 0.341092 \tabularnewline
45 & -0.077277 & -0.7572 & 0.225405 \tabularnewline
46 & 0.021911 & 0.2147 & 0.415235 \tabularnewline
47 & -0.02898 & -0.2839 & 0.388534 \tabularnewline
48 & 0.005594 & 0.0548 & 0.478201 \tabularnewline
\hline
\end{tabular}
%Source: https://freestatistics.org/blog/index.php?pk=277917&T=2

[TABLE]
[ROW][C]Partial Autocorrelation Function[/C][/ROW]
[ROW][C]Time lag k[/C][C]PACF(k)[/C][C]T-STAT[/C][C]P-value[/C][/ROW]
[ROW][C]1[/C][C]0.679976[/C][C]6.6624[/C][C]0[/C][/ROW]
[ROW][C]2[/C][C]0.184754[/C][C]1.8102[/C][C]0.036696[/C][/ROW]
[ROW][C]3[/C][C]0.304656[/C][C]2.985[/C][C]0.001799[/C][/ROW]
[ROW][C]4[/C][C]0.181021[/C][C]1.7736[/C][C]0.039647[/C][/ROW]
[ROW][C]5[/C][C]-0.060336[/C][C]-0.5912[/C][C]0.277897[/C][/ROW]
[ROW][C]6[/C][C]0.084951[/C][C]0.8323[/C][C]0.20364[/C][/ROW]
[ROW][C]7[/C][C]-0.190816[/C][C]-1.8696[/C][C]0.032293[/C][/ROW]
[ROW][C]8[/C][C]0.146228[/C][C]1.4327[/C][C]0.077591[/C][/ROW]
[ROW][C]9[/C][C]-0.254374[/C][C]-2.4923[/C][C]0.007202[/C][/ROW]
[ROW][C]10[/C][C]-0.126543[/C][C]-1.2399[/C][C]0.109024[/C][/ROW]
[ROW][C]11[/C][C]0.23597[/C][C]2.312[/C][C]0.011457[/C][/ROW]
[ROW][C]12[/C][C]0.318078[/C][C]3.1165[/C][C]0.001207[/C][/ROW]
[ROW][C]13[/C][C]-0.275887[/C][C]-2.7031[/C][C]0.004062[/C][/ROW]
[ROW][C]14[/C][C]-0.320689[/C][C]-3.1421[/C][C]0.001116[/C][/ROW]
[ROW][C]15[/C][C]-0.111596[/C][C]-1.0934[/C][C]0.138475[/C][/ROW]
[ROW][C]16[/C][C]0.097709[/C][C]0.9574[/C][C]0.170398[/C][/ROW]
[ROW][C]17[/C][C]0.048098[/C][C]0.4713[/C][C]0.31926[/C][/ROW]
[ROW][C]18[/C][C]0.046519[/C][C]0.4558[/C][C]0.324786[/C][/ROW]
[ROW][C]19[/C][C]-0.032221[/C][C]-0.3157[/C][C]0.376457[/C][/ROW]
[ROW][C]20[/C][C]0.01518[/C][C]0.1487[/C][C]0.44104[/C][/ROW]
[ROW][C]21[/C][C]-0.075009[/C][C]-0.7349[/C][C]0.232085[/C][/ROW]
[ROW][C]22[/C][C]0.004708[/C][C]0.0461[/C][C]0.481651[/C][/ROW]
[ROW][C]23[/C][C]-0.036198[/C][C]-0.3547[/C][C]0.36181[/C][/ROW]
[ROW][C]24[/C][C]-0.055368[/C][C]-0.5425[/C][C]0.294368[/C][/ROW]
[ROW][C]25[/C][C]0.014471[/C][C]0.1418[/C][C]0.443774[/C][/ROW]
[ROW][C]26[/C][C]-0.017029[/C][C]-0.1669[/C][C]0.433919[/C][/ROW]
[ROW][C]27[/C][C]0.033931[/C][C]0.3325[/C][C]0.370136[/C][/ROW]
[ROW][C]28[/C][C]0.165245[/C][C]1.6191[/C][C]0.054357[/C][/ROW]
[ROW][C]29[/C][C]0.008771[/C][C]0.0859[/C][C]0.465846[/C][/ROW]
[ROW][C]30[/C][C]0.072573[/C][C]0.7111[/C][C]0.239383[/C][/ROW]
[ROW][C]31[/C][C]-0.127262[/C][C]-1.2469[/C][C]0.107733[/C][/ROW]
[ROW][C]32[/C][C]-0.102215[/C][C]-1.0015[/C][C]0.159551[/C][/ROW]
[ROW][C]33[/C][C]0.043019[/C][C]0.4215[/C][C]0.337167[/C][/ROW]
[ROW][C]34[/C][C]-0.071076[/C][C]-0.6964[/C][C]0.243931[/C][/ROW]
[ROW][C]35[/C][C]-0.067785[/C][C]-0.6642[/C][C]0.254091[/C][/ROW]
[ROW][C]36[/C][C]-0.02698[/C][C]-0.2643[/C][C]0.39604[/C][/ROW]
[ROW][C]37[/C][C]0.047866[/C][C]0.469[/C][C]0.320071[/C][/ROW]
[ROW][C]38[/C][C]-0.090602[/C][C]-0.8877[/C][C]0.188456[/C][/ROW]
[ROW][C]39[/C][C]0.029259[/C][C]0.2867[/C][C]0.38749[/C][/ROW]
[ROW][C]40[/C][C]-0.070056[/C][C]-0.6864[/C][C]0.247054[/C][/ROW]
[ROW][C]41[/C][C]-0.053486[/C][C]-0.5241[/C][C]0.300724[/C][/ROW]
[ROW][C]42[/C][C]0.075649[/C][C]0.7412[/C][C]0.23019[/C][/ROW]
[ROW][C]43[/C][C]-0.03612[/C][C]-0.3539[/C][C]0.362096[/C][/ROW]
[ROW][C]44[/C][C]0.04192[/C][C]0.4107[/C][C]0.341092[/C][/ROW]
[ROW][C]45[/C][C]-0.077277[/C][C]-0.7572[/C][C]0.225405[/C][/ROW]
[ROW][C]46[/C][C]0.021911[/C][C]0.2147[/C][C]0.415235[/C][/ROW]
[ROW][C]47[/C][C]-0.02898[/C][C]-0.2839[/C][C]0.388534[/C][/ROW]
[ROW][C]48[/C][C]0.005594[/C][C]0.0548[/C][C]0.478201[/C][/ROW]
[/TABLE]
Source: https://freestatistics.org/blog/index.php?pk=277917&T=2

Globally Unique Identifier (entire table): ba.freestatistics.org/blog/index.php?pk=277917&T=2

As an alternative you can also use a QR Code:  

The GUIDs for individual cells are displayed in the table below:

Partial Autocorrelation Function
Time lag kPACF(k)T-STATP-value
10.6799766.66240
20.1847541.81020.036696
30.3046562.9850.001799
40.1810211.77360.039647
5-0.060336-0.59120.277897
60.0849510.83230.20364
7-0.190816-1.86960.032293
80.1462281.43270.077591
9-0.254374-2.49230.007202
10-0.126543-1.23990.109024
110.235972.3120.011457
120.3180783.11650.001207
13-0.275887-2.70310.004062
14-0.320689-3.14210.001116
15-0.111596-1.09340.138475
160.0977090.95740.170398
170.0480980.47130.31926
180.0465190.45580.324786
19-0.032221-0.31570.376457
200.015180.14870.44104
21-0.075009-0.73490.232085
220.0047080.04610.481651
23-0.036198-0.35470.36181
24-0.055368-0.54250.294368
250.0144710.14180.443774
26-0.017029-0.16690.433919
270.0339310.33250.370136
280.1652451.61910.054357
290.0087710.08590.465846
300.0725730.71110.239383
31-0.127262-1.24690.107733
32-0.102215-1.00150.159551
330.0430190.42150.337167
34-0.071076-0.69640.243931
35-0.067785-0.66420.254091
36-0.02698-0.26430.39604
370.0478660.4690.320071
38-0.090602-0.88770.188456
390.0292590.28670.38749
40-0.070056-0.68640.247054
41-0.053486-0.52410.300724
420.0756490.74120.23019
43-0.03612-0.35390.362096
440.041920.41070.341092
45-0.077277-0.75720.225405
460.0219110.21470.415235
47-0.02898-0.28390.388534
480.0055940.05480.478201


Parameters (Session):
par1 = 48 ; par2 = 1 ; par3 = 0 ; par4 = 0 ; par5 = 12 ; par6 = White Noise ; par7 = 0.95 ;
Parameters (R input):
par1 = 48 ; par2 = 1 ; par3 = 0 ; par4 = 0 ; par5 = 12 ; par6 = White Noise ; par7 = 0.95 ; par8 = ;
R code (references can be found in the software module):
if (par1 == 'Default') {
par1 = 10*log10(length(x))
} else {
par1 <- as.numeric(par1)
}
par2 <- as.numeric(par2)
par3 <- as.numeric(par3)
par4 <- as.numeric(par4)
par5 <- as.numeric(par5)
if (par6 == 'White Noise') par6 <- 'white' else par6 <- 'ma'
par7 <- as.numeric(par7)
if (par8 != '') par8 <- as.numeric(par8)
ox <- x
if (par8 == '') {
if (par2 == 0) {
x <- log(x)
} else {
x <- (x ^ par2 - 1) / par2
}
} else {
x <- log(x,base=par8)
}
if (par3 > 0) x <- diff(x,lag=1,difference=par3)
if (par4 > 0) x <- diff(x,lag=par5,difference=par4)
bitmap(file='picts.png')
op <- par(mfrow=c(2,1))
plot(ox,type='l',main='Original Time Series',xlab='time',ylab='value')
if (par8=='') {
mytitle <- paste('Working Time Series (lambda=',par2,', d=',par3,', D=',par4,')',sep='')
mysub <- paste('(lambda=',par2,', d=',par3,', D=',par4,', CI=', par7, ', CI type=',par6,')',sep='')
} else {
mytitle <- paste('Working Time Series (base=',par8,', d=',par3,', D=',par4,')',sep='')
mysub <- paste('(base=',par8,', d=',par3,', D=',par4,', CI=', par7, ', CI type=',par6,')',sep='')
}
plot(x,type='l', main=mytitle,xlab='time',ylab='value')
par(op)
dev.off()
bitmap(file='pic1.png')
racf <- acf(x, par1, main='Autocorrelation', xlab='time lag', ylab='ACF', ci.type=par6, ci=par7, sub=mysub)
dev.off()
bitmap(file='pic2.png')
rpacf <- pacf(x,par1,main='Partial Autocorrelation',xlab='lags',ylab='PACF',sub=mysub)
dev.off()
(myacf <- c(racf$acf))
(mypacf <- c(rpacf$acf))
lengthx <- length(x)
sqrtn <- sqrt(lengthx)
load(file='createtable')
a<-table.start()
a<-table.row.start(a)
a<-table.element(a,'Autocorrelation Function',4,TRUE)
a<-table.row.end(a)
a<-table.row.start(a)
a<-table.element(a,'Time lag k',header=TRUE)
a<-table.element(a,hyperlink('basics.htm','ACF(k)','click here for more information about the Autocorrelation Function'),header=TRUE)
a<-table.element(a,'T-STAT',header=TRUE)
a<-table.element(a,'P-value',header=TRUE)
a<-table.row.end(a)
for (i in 2:(par1+1)) {
a<-table.row.start(a)
a<-table.element(a,i-1,header=TRUE)
a<-table.element(a,round(myacf[i],6))
mytstat <- myacf[i]*sqrtn
a<-table.element(a,round(mytstat,4))
a<-table.element(a,round(1-pt(abs(mytstat),lengthx),6))
a<-table.row.end(a)
}
a<-table.end(a)
table.save(a,file='mytable.tab')
a<-table.start()
a<-table.row.start(a)
a<-table.element(a,'Partial Autocorrelation Function',4,TRUE)
a<-table.row.end(a)
a<-table.row.start(a)
a<-table.element(a,'Time lag k',header=TRUE)
a<-table.element(a,hyperlink('basics.htm','PACF(k)','click here for more information about the Partial Autocorrelation Function'),header=TRUE)
a<-table.element(a,'T-STAT',header=TRUE)
a<-table.element(a,'P-value',header=TRUE)
a<-table.row.end(a)
for (i in 1:par1) {
a<-table.row.start(a)
a<-table.element(a,i,header=TRUE)
a<-table.element(a,round(mypacf[i],6))
mytstat <- mypacf[i]*sqrtn
a<-table.element(a,round(mytstat,4))
a<-table.element(a,round(1-pt(abs(mytstat),lengthx),6))
a<-table.row.end(a)
}
a<-table.end(a)
table.save(a,file='mytable1.tab')