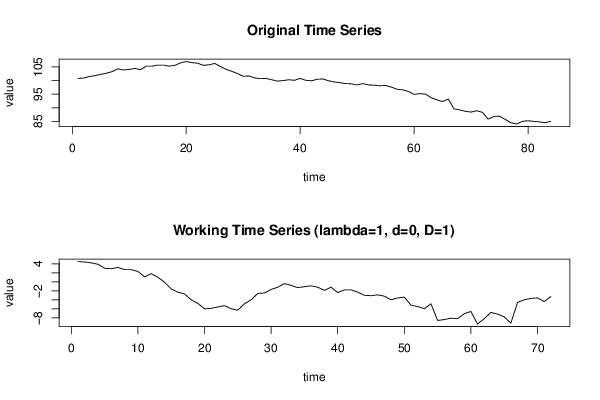
Free Statistics

of Irreproducible Research!

Author's title

Author*Unverified author*
R Software Modulerwasp_autocorrelation.wasp
Title produced by software(Partial) Autocorrelation Function
Date of computationWed, 04 Mar 2015 19:25:42 +0000
Cite this page as followsStatistical Computations at FreeStatistics.org, Office for Research Development and Education, URL https://freestatistics.org/blog/index.php?v=date/2015/Mar/04/t1425497158nlnmnzbfvg567ld.htm/, Retrieved Sun, 19 May 2024 15:27:55 +0000
Statistical Computations at FreeStatistics.org, Office for Research Development and Education, URL https://freestatistics.org/blog/index.php?pk=277901, Retrieved Sun, 19 May 2024 15:27:55 +0000
QR Codes:

Original text written by user:
IsPrivate?No (this computation is public)
User-defined keywords
Estimated Impact157
Family? (F = Feedback message, R = changed R code, M = changed R Module, P = changed Parameters, D = changed Data)
-       [(Partial) Autocorrelation Function] [] [2015-03-04 19:25:42] [aed7930eb470b174eb4d45bdfa14c6e0] [Current]
Feedback Forum

Post a new message
Dataseries X:
100.8
100.9
101.5
101.8
102.3
102.7
103.3
104.3
103.9
104.1
104.5
104
105.3
105.3
105.7
105.7
105.3
105.6
106.5
107
106.6
106.4
105.6
105.8
106.3
105.2
104.1
103.4
102.6
101.6
101.7
101
100.7
100.8
100.3
99.8
100
100.3
100.1
100.8
100.1
99.9
100.5
100.6
99.9
99.5
99.2
98.9
98.8
98.4
98.9
98.4
98.3
98.1
98.2
97.6
96.8
96.6
96
94.9
95.2
95
93.7
92.9
92.3
93.2
89.6
89.2
88.7
88.4
88.9
88.3
85.8
86.8
86.9
85.7
84.5
84
85
85.2
85
84.8
84.5
85


Summary of computational transaction
Raw Inputview raw input (R code)
Raw Outputview raw output of R engine
Computing time1 seconds
R Server'George Udny Yule' @ yule.wessa.net

\begin{tabular}{lllllllll}
\hline
Summary of computational transaction \tabularnewline
Raw Input & view raw input (R code)  \tabularnewline
Raw Output & view raw output of R engine  \tabularnewline
Computing time & 1 seconds \tabularnewline
R Server & 'George Udny Yule' @ yule.wessa.net \tabularnewline
\hline
\end{tabular}
%Source: https://freestatistics.org/blog/index.php?pk=277901&T=0

[TABLE]
[ROW][C]Summary of computational transaction[/C][/ROW]
[ROW][C]Raw Input[/C][C]view raw input (R code) [/C][/ROW]
[ROW][C]Raw Output[/C][C]view raw output of R engine [/C][/ROW]
[ROW][C]Computing time[/C][C]1 seconds[/C][/ROW]
[ROW][C]R Server[/C][C]'George Udny Yule' @ yule.wessa.net[/C][/ROW]
[/TABLE]
Source: https://freestatistics.org/blog/index.php?pk=277901&T=0

Globally Unique Identifier (entire table): ba.freestatistics.org/blog/index.php?pk=277901&T=0

As an alternative you can also use a QR Code:  

The GUIDs for individual cells are displayed in the table below:

Summary of computational transaction
Raw Inputview raw input (R code)
Raw Outputview raw output of R engine
Computing time1 seconds
R Server'George Udny Yule' @ yule.wessa.net


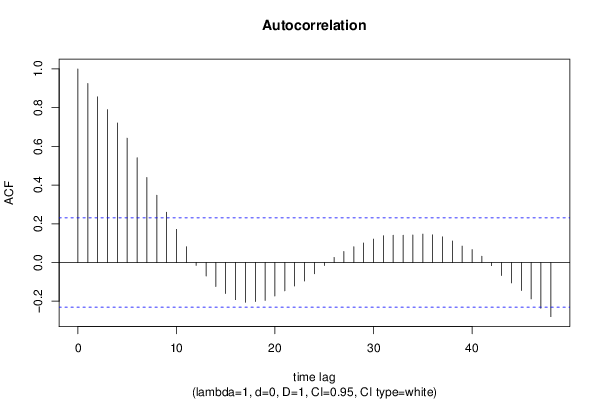
Autocorrelation Function
Time lag kACF(k)T-STATP-value
10.9252027.85060
20.8556437.26040
30.7899856.70320
40.7208256.11640
50.6423975.45090
60.5407464.58849e-06
70.4389483.72460.000193
80.3472712.94670.002163
90.2594622.20160.015449
100.1712041.45270.075324
110.0812330.68930.24643
12-0.014996-0.12720.449551
13-0.069627-0.59080.27825
14-0.123814-1.05060.148479
15-0.160125-1.35870.08924
16-0.191895-1.62830.053916
17-0.206015-1.74810.042355
18-0.201847-1.71270.045533
19-0.196062-1.66360.050265
20-0.173059-1.46850.073168
21-0.146669-1.24450.108671
22-0.121437-1.03040.153129
23-0.095506-0.81040.210192
24-0.058652-0.49770.310114
25-0.015688-0.13310.447237
260.026210.22240.412317
270.0570440.4840.314917
280.0811930.68890.246536
290.100420.85210.198495
300.1206831.0240.154626
310.1379571.17060.122809
320.140361.1910.118784
330.1403521.19090.118797
340.1423371.20780.115544
350.146551.24350.108856
360.1426421.21040.11505
370.1322971.12260.132673
380.1109220.94120.174874
390.0845820.71770.237632
400.0664320.56370.287357
410.0323310.27430.392307
42-0.016537-0.14030.444398
43-0.067508-0.57280.284273
44-0.105599-0.8960.186608
45-0.144877-1.22930.111476
46-0.188048-1.59560.057475
47-0.236665-2.00820.024189
48-0.279979-2.37570.01009

\begin{tabular}{lllllllll}
\hline
Autocorrelation Function \tabularnewline
Time lag k & ACF(k) & T-STAT & P-value \tabularnewline
1 & 0.925202 & 7.8506 & 0 \tabularnewline
2 & 0.855643 & 7.2604 & 0 \tabularnewline
3 & 0.789985 & 6.7032 & 0 \tabularnewline
4 & 0.720825 & 6.1164 & 0 \tabularnewline
5 & 0.642397 & 5.4509 & 0 \tabularnewline
6 & 0.540746 & 4.5884 & 9e-06 \tabularnewline
7 & 0.438948 & 3.7246 & 0.000193 \tabularnewline
8 & 0.347271 & 2.9467 & 0.002163 \tabularnewline
9 & 0.259462 & 2.2016 & 0.015449 \tabularnewline
10 & 0.171204 & 1.4527 & 0.075324 \tabularnewline
11 & 0.081233 & 0.6893 & 0.24643 \tabularnewline
12 & -0.014996 & -0.1272 & 0.449551 \tabularnewline
13 & -0.069627 & -0.5908 & 0.27825 \tabularnewline
14 & -0.123814 & -1.0506 & 0.148479 \tabularnewline
15 & -0.160125 & -1.3587 & 0.08924 \tabularnewline
16 & -0.191895 & -1.6283 & 0.053916 \tabularnewline
17 & -0.206015 & -1.7481 & 0.042355 \tabularnewline
18 & -0.201847 & -1.7127 & 0.045533 \tabularnewline
19 & -0.196062 & -1.6636 & 0.050265 \tabularnewline
20 & -0.173059 & -1.4685 & 0.073168 \tabularnewline
21 & -0.146669 & -1.2445 & 0.108671 \tabularnewline
22 & -0.121437 & -1.0304 & 0.153129 \tabularnewline
23 & -0.095506 & -0.8104 & 0.210192 \tabularnewline
24 & -0.058652 & -0.4977 & 0.310114 \tabularnewline
25 & -0.015688 & -0.1331 & 0.447237 \tabularnewline
26 & 0.02621 & 0.2224 & 0.412317 \tabularnewline
27 & 0.057044 & 0.484 & 0.314917 \tabularnewline
28 & 0.081193 & 0.6889 & 0.246536 \tabularnewline
29 & 0.10042 & 0.8521 & 0.198495 \tabularnewline
30 & 0.120683 & 1.024 & 0.154626 \tabularnewline
31 & 0.137957 & 1.1706 & 0.122809 \tabularnewline
32 & 0.14036 & 1.191 & 0.118784 \tabularnewline
33 & 0.140352 & 1.1909 & 0.118797 \tabularnewline
34 & 0.142337 & 1.2078 & 0.115544 \tabularnewline
35 & 0.14655 & 1.2435 & 0.108856 \tabularnewline
36 & 0.142642 & 1.2104 & 0.11505 \tabularnewline
37 & 0.132297 & 1.1226 & 0.132673 \tabularnewline
38 & 0.110922 & 0.9412 & 0.174874 \tabularnewline
39 & 0.084582 & 0.7177 & 0.237632 \tabularnewline
40 & 0.066432 & 0.5637 & 0.287357 \tabularnewline
41 & 0.032331 & 0.2743 & 0.392307 \tabularnewline
42 & -0.016537 & -0.1403 & 0.444398 \tabularnewline
43 & -0.067508 & -0.5728 & 0.284273 \tabularnewline
44 & -0.105599 & -0.896 & 0.186608 \tabularnewline
45 & -0.144877 & -1.2293 & 0.111476 \tabularnewline
46 & -0.188048 & -1.5956 & 0.057475 \tabularnewline
47 & -0.236665 & -2.0082 & 0.024189 \tabularnewline
48 & -0.279979 & -2.3757 & 0.01009 \tabularnewline
\hline
\end{tabular}
%Source: https://freestatistics.org/blog/index.php?pk=277901&T=1

[TABLE]
[ROW][C]Autocorrelation Function[/C][/ROW]
[ROW][C]Time lag k[/C][C]ACF(k)[/C][C]T-STAT[/C][C]P-value[/C][/ROW]
[ROW][C]1[/C][C]0.925202[/C][C]7.8506[/C][C]0[/C][/ROW]
[ROW][C]2[/C][C]0.855643[/C][C]7.2604[/C][C]0[/C][/ROW]
[ROW][C]3[/C][C]0.789985[/C][C]6.7032[/C][C]0[/C][/ROW]
[ROW][C]4[/C][C]0.720825[/C][C]6.1164[/C][C]0[/C][/ROW]
[ROW][C]5[/C][C]0.642397[/C][C]5.4509[/C][C]0[/C][/ROW]
[ROW][C]6[/C][C]0.540746[/C][C]4.5884[/C][C]9e-06[/C][/ROW]
[ROW][C]7[/C][C]0.438948[/C][C]3.7246[/C][C]0.000193[/C][/ROW]
[ROW][C]8[/C][C]0.347271[/C][C]2.9467[/C][C]0.002163[/C][/ROW]
[ROW][C]9[/C][C]0.259462[/C][C]2.2016[/C][C]0.015449[/C][/ROW]
[ROW][C]10[/C][C]0.171204[/C][C]1.4527[/C][C]0.075324[/C][/ROW]
[ROW][C]11[/C][C]0.081233[/C][C]0.6893[/C][C]0.24643[/C][/ROW]
[ROW][C]12[/C][C]-0.014996[/C][C]-0.1272[/C][C]0.449551[/C][/ROW]
[ROW][C]13[/C][C]-0.069627[/C][C]-0.5908[/C][C]0.27825[/C][/ROW]
[ROW][C]14[/C][C]-0.123814[/C][C]-1.0506[/C][C]0.148479[/C][/ROW]
[ROW][C]15[/C][C]-0.160125[/C][C]-1.3587[/C][C]0.08924[/C][/ROW]
[ROW][C]16[/C][C]-0.191895[/C][C]-1.6283[/C][C]0.053916[/C][/ROW]
[ROW][C]17[/C][C]-0.206015[/C][C]-1.7481[/C][C]0.042355[/C][/ROW]
[ROW][C]18[/C][C]-0.201847[/C][C]-1.7127[/C][C]0.045533[/C][/ROW]
[ROW][C]19[/C][C]-0.196062[/C][C]-1.6636[/C][C]0.050265[/C][/ROW]
[ROW][C]20[/C][C]-0.173059[/C][C]-1.4685[/C][C]0.073168[/C][/ROW]
[ROW][C]21[/C][C]-0.146669[/C][C]-1.2445[/C][C]0.108671[/C][/ROW]
[ROW][C]22[/C][C]-0.121437[/C][C]-1.0304[/C][C]0.153129[/C][/ROW]
[ROW][C]23[/C][C]-0.095506[/C][C]-0.8104[/C][C]0.210192[/C][/ROW]
[ROW][C]24[/C][C]-0.058652[/C][C]-0.4977[/C][C]0.310114[/C][/ROW]
[ROW][C]25[/C][C]-0.015688[/C][C]-0.1331[/C][C]0.447237[/C][/ROW]
[ROW][C]26[/C][C]0.02621[/C][C]0.2224[/C][C]0.412317[/C][/ROW]
[ROW][C]27[/C][C]0.057044[/C][C]0.484[/C][C]0.314917[/C][/ROW]
[ROW][C]28[/C][C]0.081193[/C][C]0.6889[/C][C]0.246536[/C][/ROW]
[ROW][C]29[/C][C]0.10042[/C][C]0.8521[/C][C]0.198495[/C][/ROW]
[ROW][C]30[/C][C]0.120683[/C][C]1.024[/C][C]0.154626[/C][/ROW]
[ROW][C]31[/C][C]0.137957[/C][C]1.1706[/C][C]0.122809[/C][/ROW]
[ROW][C]32[/C][C]0.14036[/C][C]1.191[/C][C]0.118784[/C][/ROW]
[ROW][C]33[/C][C]0.140352[/C][C]1.1909[/C][C]0.118797[/C][/ROW]
[ROW][C]34[/C][C]0.142337[/C][C]1.2078[/C][C]0.115544[/C][/ROW]
[ROW][C]35[/C][C]0.14655[/C][C]1.2435[/C][C]0.108856[/C][/ROW]
[ROW][C]36[/C][C]0.142642[/C][C]1.2104[/C][C]0.11505[/C][/ROW]
[ROW][C]37[/C][C]0.132297[/C][C]1.1226[/C][C]0.132673[/C][/ROW]
[ROW][C]38[/C][C]0.110922[/C][C]0.9412[/C][C]0.174874[/C][/ROW]
[ROW][C]39[/C][C]0.084582[/C][C]0.7177[/C][C]0.237632[/C][/ROW]
[ROW][C]40[/C][C]0.066432[/C][C]0.5637[/C][C]0.287357[/C][/ROW]
[ROW][C]41[/C][C]0.032331[/C][C]0.2743[/C][C]0.392307[/C][/ROW]
[ROW][C]42[/C][C]-0.016537[/C][C]-0.1403[/C][C]0.444398[/C][/ROW]
[ROW][C]43[/C][C]-0.067508[/C][C]-0.5728[/C][C]0.284273[/C][/ROW]
[ROW][C]44[/C][C]-0.105599[/C][C]-0.896[/C][C]0.186608[/C][/ROW]
[ROW][C]45[/C][C]-0.144877[/C][C]-1.2293[/C][C]0.111476[/C][/ROW]
[ROW][C]46[/C][C]-0.188048[/C][C]-1.5956[/C][C]0.057475[/C][/ROW]
[ROW][C]47[/C][C]-0.236665[/C][C]-2.0082[/C][C]0.024189[/C][/ROW]
[ROW][C]48[/C][C]-0.279979[/C][C]-2.3757[/C][C]0.01009[/C][/ROW]
[/TABLE]
Source: https://freestatistics.org/blog/index.php?pk=277901&T=1

Globally Unique Identifier (entire table): ba.freestatistics.org/blog/index.php?pk=277901&T=1

As an alternative you can also use a QR Code:  

The GUIDs for individual cells are displayed in the table below:

Autocorrelation Function
Time lag kACF(k)T-STATP-value
10.9252027.85060
20.8556437.26040
30.7899856.70320
40.7208256.11640
50.6423975.45090
60.5407464.58849e-06
70.4389483.72460.000193
80.3472712.94670.002163
90.2594622.20160.015449
100.1712041.45270.075324
110.0812330.68930.24643
12-0.014996-0.12720.449551
13-0.069627-0.59080.27825
14-0.123814-1.05060.148479
15-0.160125-1.35870.08924
16-0.191895-1.62830.053916
17-0.206015-1.74810.042355
18-0.201847-1.71270.045533
19-0.196062-1.66360.050265
20-0.173059-1.46850.073168
21-0.146669-1.24450.108671
22-0.121437-1.03040.153129
23-0.095506-0.81040.210192
24-0.058652-0.49770.310114
25-0.015688-0.13310.447237
260.026210.22240.412317
270.0570440.4840.314917
280.0811930.68890.246536
290.100420.85210.198495
300.1206831.0240.154626
310.1379571.17060.122809
320.140361.1910.118784
330.1403521.19090.118797
340.1423371.20780.115544
350.146551.24350.108856
360.1426421.21040.11505
370.1322971.12260.132673
380.1109220.94120.174874
390.0845820.71770.237632
400.0664320.56370.287357
410.0323310.27430.392307
42-0.016537-0.14030.444398
43-0.067508-0.57280.284273
44-0.105599-0.8960.186608
45-0.144877-1.22930.111476
46-0.188048-1.59560.057475
47-0.236665-2.00820.024189
48-0.279979-2.37570.01009


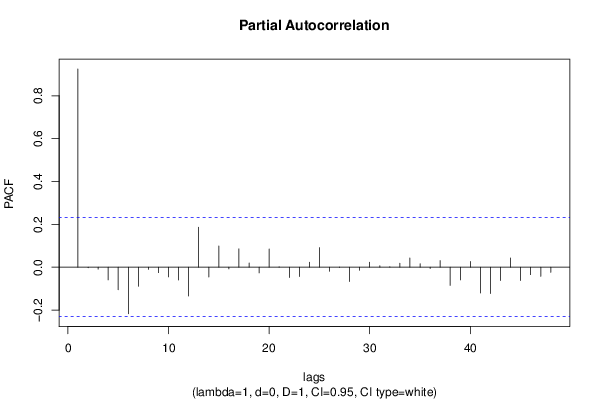
Partial Autocorrelation Function
Time lag kPACF(k)T-STATP-value
10.9252027.85060
2-0.00247-0.0210.491669
3-0.009223-0.07830.46892
4-0.059248-0.50270.308341
5-0.10559-0.8960.186629
6-0.217286-1.84370.034669
7-0.089362-0.75830.225385
8-0.010463-0.08880.46475
9-0.025567-0.21690.414433
10-0.045405-0.38530.350584
11-0.059805-0.50750.306691
12-0.134777-1.14360.128284
130.1864561.58210.059001
14-0.046224-0.39220.348026
150.0984870.83570.203048
16-0.007909-0.06710.473341
170.0853090.72390.235744
180.0197460.16750.433704
19-0.026792-0.22730.410404
200.0851760.72270.236089
210.00150.01270.494939
22-0.0481-0.40810.342191
23-0.043607-0.370.356229
240.022930.19460.42314
250.0911870.77370.220808
26-0.018977-0.1610.436261
27-0.001025-0.00870.496544
28-0.066559-0.56480.286992
29-0.014138-0.120.452421
300.0233230.19790.421839
310.0064140.05440.478375
320.002210.01880.492545
330.0179270.15210.43976
340.0431330.3660.357722
350.0156820.13310.447257
36-0.006179-0.05240.479166
370.030630.25990.39784
38-0.084906-0.72050.236789
39-0.059345-0.50360.308053
400.0266850.22640.410754
41-0.120377-1.02140.155235
42-0.12322-1.04560.149632
43-0.061965-0.52580.300324
440.0425780.36130.359473
45-0.062466-0.530.298857
46-0.035034-0.29730.383557
47-0.042863-0.36370.358571
48-0.024205-0.20540.418924

\begin{tabular}{lllllllll}
\hline
Partial Autocorrelation Function \tabularnewline
Time lag k & PACF(k) & T-STAT & P-value \tabularnewline
1 & 0.925202 & 7.8506 & 0 \tabularnewline
2 & -0.00247 & -0.021 & 0.491669 \tabularnewline
3 & -0.009223 & -0.0783 & 0.46892 \tabularnewline
4 & -0.059248 & -0.5027 & 0.308341 \tabularnewline
5 & -0.10559 & -0.896 & 0.186629 \tabularnewline
6 & -0.217286 & -1.8437 & 0.034669 \tabularnewline
7 & -0.089362 & -0.7583 & 0.225385 \tabularnewline
8 & -0.010463 & -0.0888 & 0.46475 \tabularnewline
9 & -0.025567 & -0.2169 & 0.414433 \tabularnewline
10 & -0.045405 & -0.3853 & 0.350584 \tabularnewline
11 & -0.059805 & -0.5075 & 0.306691 \tabularnewline
12 & -0.134777 & -1.1436 & 0.128284 \tabularnewline
13 & 0.186456 & 1.5821 & 0.059001 \tabularnewline
14 & -0.046224 & -0.3922 & 0.348026 \tabularnewline
15 & 0.098487 & 0.8357 & 0.203048 \tabularnewline
16 & -0.007909 & -0.0671 & 0.473341 \tabularnewline
17 & 0.085309 & 0.7239 & 0.235744 \tabularnewline
18 & 0.019746 & 0.1675 & 0.433704 \tabularnewline
19 & -0.026792 & -0.2273 & 0.410404 \tabularnewline
20 & 0.085176 & 0.7227 & 0.236089 \tabularnewline
21 & 0.0015 & 0.0127 & 0.494939 \tabularnewline
22 & -0.0481 & -0.4081 & 0.342191 \tabularnewline
23 & -0.043607 & -0.37 & 0.356229 \tabularnewline
24 & 0.02293 & 0.1946 & 0.42314 \tabularnewline
25 & 0.091187 & 0.7737 & 0.220808 \tabularnewline
26 & -0.018977 & -0.161 & 0.436261 \tabularnewline
27 & -0.001025 & -0.0087 & 0.496544 \tabularnewline
28 & -0.066559 & -0.5648 & 0.286992 \tabularnewline
29 & -0.014138 & -0.12 & 0.452421 \tabularnewline
30 & 0.023323 & 0.1979 & 0.421839 \tabularnewline
31 & 0.006414 & 0.0544 & 0.478375 \tabularnewline
32 & 0.00221 & 0.0188 & 0.492545 \tabularnewline
33 & 0.017927 & 0.1521 & 0.43976 \tabularnewline
34 & 0.043133 & 0.366 & 0.357722 \tabularnewline
35 & 0.015682 & 0.1331 & 0.447257 \tabularnewline
36 & -0.006179 & -0.0524 & 0.479166 \tabularnewline
37 & 0.03063 & 0.2599 & 0.39784 \tabularnewline
38 & -0.084906 & -0.7205 & 0.236789 \tabularnewline
39 & -0.059345 & -0.5036 & 0.308053 \tabularnewline
40 & 0.026685 & 0.2264 & 0.410754 \tabularnewline
41 & -0.120377 & -1.0214 & 0.155235 \tabularnewline
42 & -0.12322 & -1.0456 & 0.149632 \tabularnewline
43 & -0.061965 & -0.5258 & 0.300324 \tabularnewline
44 & 0.042578 & 0.3613 & 0.359473 \tabularnewline
45 & -0.062466 & -0.53 & 0.298857 \tabularnewline
46 & -0.035034 & -0.2973 & 0.383557 \tabularnewline
47 & -0.042863 & -0.3637 & 0.358571 \tabularnewline
48 & -0.024205 & -0.2054 & 0.418924 \tabularnewline
\hline
\end{tabular}
%Source: https://freestatistics.org/blog/index.php?pk=277901&T=2

[TABLE]
[ROW][C]Partial Autocorrelation Function[/C][/ROW]
[ROW][C]Time lag k[/C][C]PACF(k)[/C][C]T-STAT[/C][C]P-value[/C][/ROW]
[ROW][C]1[/C][C]0.925202[/C][C]7.8506[/C][C]0[/C][/ROW]
[ROW][C]2[/C][C]-0.00247[/C][C]-0.021[/C][C]0.491669[/C][/ROW]
[ROW][C]3[/C][C]-0.009223[/C][C]-0.0783[/C][C]0.46892[/C][/ROW]
[ROW][C]4[/C][C]-0.059248[/C][C]-0.5027[/C][C]0.308341[/C][/ROW]
[ROW][C]5[/C][C]-0.10559[/C][C]-0.896[/C][C]0.186629[/C][/ROW]
[ROW][C]6[/C][C]-0.217286[/C][C]-1.8437[/C][C]0.034669[/C][/ROW]
[ROW][C]7[/C][C]-0.089362[/C][C]-0.7583[/C][C]0.225385[/C][/ROW]
[ROW][C]8[/C][C]-0.010463[/C][C]-0.0888[/C][C]0.46475[/C][/ROW]
[ROW][C]9[/C][C]-0.025567[/C][C]-0.2169[/C][C]0.414433[/C][/ROW]
[ROW][C]10[/C][C]-0.045405[/C][C]-0.3853[/C][C]0.350584[/C][/ROW]
[ROW][C]11[/C][C]-0.059805[/C][C]-0.5075[/C][C]0.306691[/C][/ROW]
[ROW][C]12[/C][C]-0.134777[/C][C]-1.1436[/C][C]0.128284[/C][/ROW]
[ROW][C]13[/C][C]0.186456[/C][C]1.5821[/C][C]0.059001[/C][/ROW]
[ROW][C]14[/C][C]-0.046224[/C][C]-0.3922[/C][C]0.348026[/C][/ROW]
[ROW][C]15[/C][C]0.098487[/C][C]0.8357[/C][C]0.203048[/C][/ROW]
[ROW][C]16[/C][C]-0.007909[/C][C]-0.0671[/C][C]0.473341[/C][/ROW]
[ROW][C]17[/C][C]0.085309[/C][C]0.7239[/C][C]0.235744[/C][/ROW]
[ROW][C]18[/C][C]0.019746[/C][C]0.1675[/C][C]0.433704[/C][/ROW]
[ROW][C]19[/C][C]-0.026792[/C][C]-0.2273[/C][C]0.410404[/C][/ROW]
[ROW][C]20[/C][C]0.085176[/C][C]0.7227[/C][C]0.236089[/C][/ROW]
[ROW][C]21[/C][C]0.0015[/C][C]0.0127[/C][C]0.494939[/C][/ROW]
[ROW][C]22[/C][C]-0.0481[/C][C]-0.4081[/C][C]0.342191[/C][/ROW]
[ROW][C]23[/C][C]-0.043607[/C][C]-0.37[/C][C]0.356229[/C][/ROW]
[ROW][C]24[/C][C]0.02293[/C][C]0.1946[/C][C]0.42314[/C][/ROW]
[ROW][C]25[/C][C]0.091187[/C][C]0.7737[/C][C]0.220808[/C][/ROW]
[ROW][C]26[/C][C]-0.018977[/C][C]-0.161[/C][C]0.436261[/C][/ROW]
[ROW][C]27[/C][C]-0.001025[/C][C]-0.0087[/C][C]0.496544[/C][/ROW]
[ROW][C]28[/C][C]-0.066559[/C][C]-0.5648[/C][C]0.286992[/C][/ROW]
[ROW][C]29[/C][C]-0.014138[/C][C]-0.12[/C][C]0.452421[/C][/ROW]
[ROW][C]30[/C][C]0.023323[/C][C]0.1979[/C][C]0.421839[/C][/ROW]
[ROW][C]31[/C][C]0.006414[/C][C]0.0544[/C][C]0.478375[/C][/ROW]
[ROW][C]32[/C][C]0.00221[/C][C]0.0188[/C][C]0.492545[/C][/ROW]
[ROW][C]33[/C][C]0.017927[/C][C]0.1521[/C][C]0.43976[/C][/ROW]
[ROW][C]34[/C][C]0.043133[/C][C]0.366[/C][C]0.357722[/C][/ROW]
[ROW][C]35[/C][C]0.015682[/C][C]0.1331[/C][C]0.447257[/C][/ROW]
[ROW][C]36[/C][C]-0.006179[/C][C]-0.0524[/C][C]0.479166[/C][/ROW]
[ROW][C]37[/C][C]0.03063[/C][C]0.2599[/C][C]0.39784[/C][/ROW]
[ROW][C]38[/C][C]-0.084906[/C][C]-0.7205[/C][C]0.236789[/C][/ROW]
[ROW][C]39[/C][C]-0.059345[/C][C]-0.5036[/C][C]0.308053[/C][/ROW]
[ROW][C]40[/C][C]0.026685[/C][C]0.2264[/C][C]0.410754[/C][/ROW]
[ROW][C]41[/C][C]-0.120377[/C][C]-1.0214[/C][C]0.155235[/C][/ROW]
[ROW][C]42[/C][C]-0.12322[/C][C]-1.0456[/C][C]0.149632[/C][/ROW]
[ROW][C]43[/C][C]-0.061965[/C][C]-0.5258[/C][C]0.300324[/C][/ROW]
[ROW][C]44[/C][C]0.042578[/C][C]0.3613[/C][C]0.359473[/C][/ROW]
[ROW][C]45[/C][C]-0.062466[/C][C]-0.53[/C][C]0.298857[/C][/ROW]
[ROW][C]46[/C][C]-0.035034[/C][C]-0.2973[/C][C]0.383557[/C][/ROW]
[ROW][C]47[/C][C]-0.042863[/C][C]-0.3637[/C][C]0.358571[/C][/ROW]
[ROW][C]48[/C][C]-0.024205[/C][C]-0.2054[/C][C]0.418924[/C][/ROW]
[/TABLE]
Source: https://freestatistics.org/blog/index.php?pk=277901&T=2

Globally Unique Identifier (entire table): ba.freestatistics.org/blog/index.php?pk=277901&T=2

As an alternative you can also use a QR Code:  

The GUIDs for individual cells are displayed in the table below:

Partial Autocorrelation Function
Time lag kPACF(k)T-STATP-value
10.9252027.85060
2-0.00247-0.0210.491669
3-0.009223-0.07830.46892
4-0.059248-0.50270.308341
5-0.10559-0.8960.186629
6-0.217286-1.84370.034669
7-0.089362-0.75830.225385
8-0.010463-0.08880.46475
9-0.025567-0.21690.414433
10-0.045405-0.38530.350584
11-0.059805-0.50750.306691
12-0.134777-1.14360.128284
130.1864561.58210.059001
14-0.046224-0.39220.348026
150.0984870.83570.203048
16-0.007909-0.06710.473341
170.0853090.72390.235744
180.0197460.16750.433704
19-0.026792-0.22730.410404
200.0851760.72270.236089
210.00150.01270.494939
22-0.0481-0.40810.342191
23-0.043607-0.370.356229
240.022930.19460.42314
250.0911870.77370.220808
26-0.018977-0.1610.436261
27-0.001025-0.00870.496544
28-0.066559-0.56480.286992
29-0.014138-0.120.452421
300.0233230.19790.421839
310.0064140.05440.478375
320.002210.01880.492545
330.0179270.15210.43976
340.0431330.3660.357722
350.0156820.13310.447257
36-0.006179-0.05240.479166
370.030630.25990.39784
38-0.084906-0.72050.236789
39-0.059345-0.50360.308053
400.0266850.22640.410754
41-0.120377-1.02140.155235
42-0.12322-1.04560.149632
43-0.061965-0.52580.300324
440.0425780.36130.359473
45-0.062466-0.530.298857
46-0.035034-0.29730.383557
47-0.042863-0.36370.358571
48-0.024205-0.20540.418924


Parameters (Session):
par1 = 48 ; par2 = 1 ; par3 = 0 ; par4 = 1 ; par5 = 12 ; par6 = White Noise ; par7 = 0.95 ;
Parameters (R input):
par1 = 48 ; par2 = 1 ; par3 = 0 ; par4 = 1 ; par5 = 12 ; par6 = White Noise ; par7 = 0.95 ; par8 = ;
R code (references can be found in the software module):
par8 <- ''
par7 <- '0.95'
par6 <- 'White Noise'
par5 <- '12'
par4 <- '0'
par3 <- '0'
par2 <- '1'
par1 <- '48'
if (par1 == 'Default') {
par1 = 10*log10(length(x))
} else {
par1 <- as.numeric(par1)
}
par2 <- as.numeric(par2)
par3 <- as.numeric(par3)
par4 <- as.numeric(par4)
par5 <- as.numeric(par5)
if (par6 == 'White Noise') par6 <- 'white' else par6 <- 'ma'
par7 <- as.numeric(par7)
if (par8 != '') par8 <- as.numeric(par8)
ox <- x
if (par8 == '') {
if (par2 == 0) {
x <- log(x)
} else {
x <- (x ^ par2 - 1) / par2
}
} else {
x <- log(x,base=par8)
}
if (par3 > 0) x <- diff(x,lag=1,difference=par3)
if (par4 > 0) x <- diff(x,lag=par5,difference=par4)
bitmap(file='picts.png')
op <- par(mfrow=c(2,1))
plot(ox,type='l',main='Original Time Series',xlab='time',ylab='value')
if (par8=='') {
mytitle <- paste('Working Time Series (lambda=',par2,', d=',par3,', D=',par4,')',sep='')
mysub <- paste('(lambda=',par2,', d=',par3,', D=',par4,', CI=', par7, ', CI type=',par6,')',sep='')
} else {
mytitle <- paste('Working Time Series (base=',par8,', d=',par3,', D=',par4,')',sep='')
mysub <- paste('(base=',par8,', d=',par3,', D=',par4,', CI=', par7, ', CI type=',par6,')',sep='')
}
plot(x,type='l', main=mytitle,xlab='time',ylab='value')
par(op)
dev.off()
bitmap(file='pic1.png')
racf <- acf(x, par1, main='Autocorrelation', xlab='time lag', ylab='ACF', ci.type=par6, ci=par7, sub=mysub)
dev.off()
bitmap(file='pic2.png')
rpacf <- pacf(x,par1,main='Partial Autocorrelation',xlab='lags',ylab='PACF',sub=mysub)
dev.off()
(myacf <- c(racf$acf))
(mypacf <- c(rpacf$acf))
lengthx <- length(x)
sqrtn <- sqrt(lengthx)
load(file='createtable')
a<-table.start()
a<-table.row.start(a)
a<-table.element(a,'Autocorrelation Function',4,TRUE)
a<-table.row.end(a)
a<-table.row.start(a)
a<-table.element(a,'Time lag k',header=TRUE)
a<-table.element(a,hyperlink('basics.htm','ACF(k)','click here for more information about the Autocorrelation Function'),header=TRUE)
a<-table.element(a,'T-STAT',header=TRUE)
a<-table.element(a,'P-value',header=TRUE)
a<-table.row.end(a)
for (i in 2:(par1+1)) {
a<-table.row.start(a)
a<-table.element(a,i-1,header=TRUE)
a<-table.element(a,round(myacf[i],6))
mytstat <- myacf[i]*sqrtn
a<-table.element(a,round(mytstat,4))
a<-table.element(a,round(1-pt(abs(mytstat),lengthx),6))
a<-table.row.end(a)
}
a<-table.end(a)
table.save(a,file='mytable.tab')
a<-table.start()
a<-table.row.start(a)
a<-table.element(a,'Partial Autocorrelation Function',4,TRUE)
a<-table.row.end(a)
a<-table.row.start(a)
a<-table.element(a,'Time lag k',header=TRUE)
a<-table.element(a,hyperlink('basics.htm','PACF(k)','click here for more information about the Partial Autocorrelation Function'),header=TRUE)
a<-table.element(a,'T-STAT',header=TRUE)
a<-table.element(a,'P-value',header=TRUE)
a<-table.row.end(a)
for (i in 1:par1) {
a<-table.row.start(a)
a<-table.element(a,i,header=TRUE)
a<-table.element(a,round(mypacf[i],6))
mytstat <- mypacf[i]*sqrtn
a<-table.element(a,round(mytstat,4))
a<-table.element(a,round(1-pt(abs(mytstat),lengthx),6))
a<-table.row.end(a)
}
a<-table.end(a)
table.save(a,file='mytable1.tab')