Free Statistics

of Irreproducible Research!

Author's title

Author*Unverified author*
R Software Modulerwasp_autocorrelation.wasp
Title produced by software(Partial) Autocorrelation Function
Date of computationWed, 04 Mar 2015 19:23:55 +0000
Cite this page as followsStatistical Computations at FreeStatistics.org, Office for Research Development and Education, URL https://freestatistics.org/blog/index.php?v=date/2015/Mar/04/t14254970580saezwp8auhrsqb.htm/, Retrieved Sun, 19 May 2024 14:11:32 +0000
Statistical Computations at FreeStatistics.org, Office for Research Development and Education, URL https://freestatistics.org/blog/index.php?pk=277899, Retrieved Sun, 19 May 2024 14:11:32 +0000
QR Codes:

Original text written by user:
IsPrivate?No (this computation is public)
User-defined keywords
Estimated Impact169
Family? (F = Feedback message, R = changed R code, M = changed R Module, P = changed Parameters, D = changed Data)
-       [(Partial) Autocorrelation Function] [] [2015-03-04 19:23:55] [aed7930eb470b174eb4d45bdfa14c6e0] [Current]
Feedback Forum

Post a new message
Dataseries X:
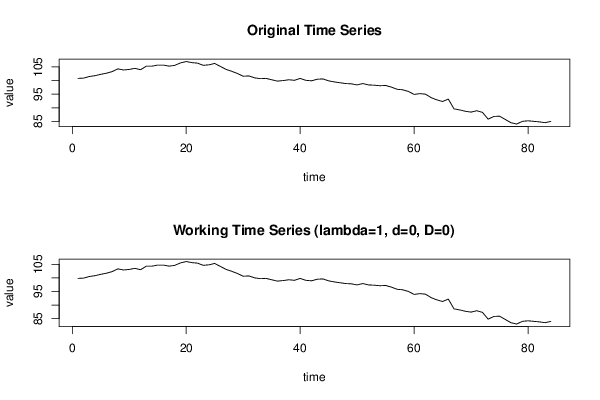
100,8
100,9
101,5
101,8
102,3
102,7
103,3
104,3
103,9
104,1
104,5
104
105,3
105,3
105,7
105,7
105,3
105,6
106,5
107
106,6
106,4
105,6
105,8
106,3
105,2
104,1
103,4
102,6
101,6
101,7
101
100,7
100,8
100,3
99,8
100
100,3
100,1
100,8
100,1
99,9
100,5
100,6
99,9
99,5
99,2
98,9
98,8
98,4
98,9
98,4
98,3
98,1
98,2
97,6
96,8
96,6
96
94,9
95,2
95
93,7
92,9
92,3
93,2
89,6
89,2
88,7
88,4
88,9
88,3
85,8
86,8
86,9
85,7
84,5
84
85
85,2
85
84,8
84,5
85


Summary of computational transaction
Raw Inputview raw input (R code)
Raw Outputview raw output of R engine
Computing time1 seconds
R Server'Herman Ole Andreas Wold' @ wold.wessa.net

\begin{tabular}{lllllllll}
\hline
Summary of computational transaction \tabularnewline
Raw Input & view raw input (R code)  \tabularnewline
Raw Output & view raw output of R engine  \tabularnewline
Computing time & 1 seconds \tabularnewline
R Server & 'Herman Ole Andreas Wold' @ wold.wessa.net \tabularnewline
\hline
\end{tabular}
%Source: https://freestatistics.org/blog/index.php?pk=277899&T=0

[TABLE]
[ROW][C]Summary of computational transaction[/C][/ROW]
[ROW][C]Raw Input[/C][C]view raw input (R code) [/C][/ROW]
[ROW][C]Raw Output[/C][C]view raw output of R engine [/C][/ROW]
[ROW][C]Computing time[/C][C]1 seconds[/C][/ROW]
[ROW][C]R Server[/C][C]'Herman Ole Andreas Wold' @ wold.wessa.net[/C][/ROW]
[/TABLE]
Source: https://freestatistics.org/blog/index.php?pk=277899&T=0

Globally Unique Identifier (entire table): ba.freestatistics.org/blog/index.php?pk=277899&T=0

As an alternative you can also use a QR Code:  

The GUIDs for individual cells are displayed in the table below:

Summary of computational transaction
Raw Inputview raw input (R code)
Raw Outputview raw output of R engine
Computing time1 seconds
R Server'Herman Ole Andreas Wold' @ wold.wessa.net


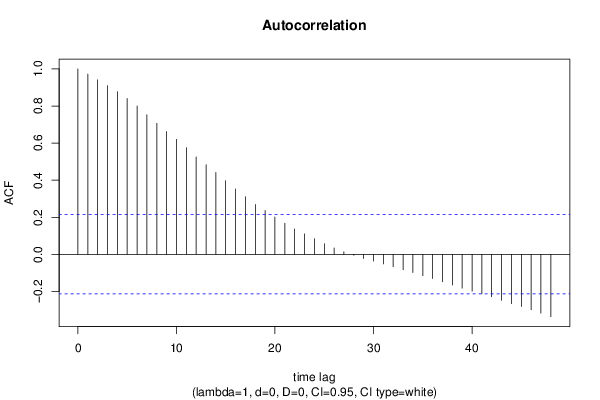
Autocorrelation Function
Time lag kACF(k)T-STATP-value
10.9719488.90810
20.9411548.62580
30.9101848.3420
40.8768018.0360
50.840787.70590
60.8001057.33310
70.7528026.89950
80.7063286.47360
90.6626726.07350
100.6201185.68350
110.5745365.26571e-06
120.5253024.81453e-06
130.4834284.43071.4e-05
140.441554.04695.7e-05
150.3971633.64010.000235
160.3526923.23250.000877
170.3102852.84380.002798
180.2688282.46390.007893
190.2368532.17080.016384
200.2011841.84390.034363
210.1675551.53570.064189
220.1363591.24980.10743
230.1102331.01030.157627
240.0844060.77360.220671
250.0572270.52450.300658
260.034590.3170.376006
270.0141570.12980.448535
28-0.005175-0.04740.481141
29-0.022183-0.20330.419693
30-0.03652-0.33470.36934
31-0.051684-0.47370.318475
32-0.067297-0.61680.269523
33-0.083582-0.7660.2229
34-0.098332-0.90120.185022
35-0.114875-1.05280.147716
36-0.130865-1.19940.116874
37-0.147567-1.35250.089926
38-0.165234-1.51440.06684
39-0.182284-1.67070.049256
40-0.198346-1.81790.036325
41-0.212826-1.95060.027221
42-0.229224-2.10090.019325
43-0.247849-2.27160.012834
44-0.265987-2.43780.008443
45-0.281655-2.58140.005788
46-0.299232-2.74250.003725
47-0.317176-2.9070.002333
48-0.336149-3.08090.001395

\begin{tabular}{lllllllll}
\hline
Autocorrelation Function \tabularnewline
Time lag k & ACF(k) & T-STAT & P-value \tabularnewline
1 & 0.971948 & 8.9081 & 0 \tabularnewline
2 & 0.941154 & 8.6258 & 0 \tabularnewline
3 & 0.910184 & 8.342 & 0 \tabularnewline
4 & 0.876801 & 8.036 & 0 \tabularnewline
5 & 0.84078 & 7.7059 & 0 \tabularnewline
6 & 0.800105 & 7.3331 & 0 \tabularnewline
7 & 0.752802 & 6.8995 & 0 \tabularnewline
8 & 0.706328 & 6.4736 & 0 \tabularnewline
9 & 0.662672 & 6.0735 & 0 \tabularnewline
10 & 0.620118 & 5.6835 & 0 \tabularnewline
11 & 0.574536 & 5.2657 & 1e-06 \tabularnewline
12 & 0.525302 & 4.8145 & 3e-06 \tabularnewline
13 & 0.483428 & 4.4307 & 1.4e-05 \tabularnewline
14 & 0.44155 & 4.0469 & 5.7e-05 \tabularnewline
15 & 0.397163 & 3.6401 & 0.000235 \tabularnewline
16 & 0.352692 & 3.2325 & 0.000877 \tabularnewline
17 & 0.310285 & 2.8438 & 0.002798 \tabularnewline
18 & 0.268828 & 2.4639 & 0.007893 \tabularnewline
19 & 0.236853 & 2.1708 & 0.016384 \tabularnewline
20 & 0.201184 & 1.8439 & 0.034363 \tabularnewline
21 & 0.167555 & 1.5357 & 0.064189 \tabularnewline
22 & 0.136359 & 1.2498 & 0.10743 \tabularnewline
23 & 0.110233 & 1.0103 & 0.157627 \tabularnewline
24 & 0.084406 & 0.7736 & 0.220671 \tabularnewline
25 & 0.057227 & 0.5245 & 0.300658 \tabularnewline
26 & 0.03459 & 0.317 & 0.376006 \tabularnewline
27 & 0.014157 & 0.1298 & 0.448535 \tabularnewline
28 & -0.005175 & -0.0474 & 0.481141 \tabularnewline
29 & -0.022183 & -0.2033 & 0.419693 \tabularnewline
30 & -0.03652 & -0.3347 & 0.36934 \tabularnewline
31 & -0.051684 & -0.4737 & 0.318475 \tabularnewline
32 & -0.067297 & -0.6168 & 0.269523 \tabularnewline
33 & -0.083582 & -0.766 & 0.2229 \tabularnewline
34 & -0.098332 & -0.9012 & 0.185022 \tabularnewline
35 & -0.114875 & -1.0528 & 0.147716 \tabularnewline
36 & -0.130865 & -1.1994 & 0.116874 \tabularnewline
37 & -0.147567 & -1.3525 & 0.089926 \tabularnewline
38 & -0.165234 & -1.5144 & 0.06684 \tabularnewline
39 & -0.182284 & -1.6707 & 0.049256 \tabularnewline
40 & -0.198346 & -1.8179 & 0.036325 \tabularnewline
41 & -0.212826 & -1.9506 & 0.027221 \tabularnewline
42 & -0.229224 & -2.1009 & 0.019325 \tabularnewline
43 & -0.247849 & -2.2716 & 0.012834 \tabularnewline
44 & -0.265987 & -2.4378 & 0.008443 \tabularnewline
45 & -0.281655 & -2.5814 & 0.005788 \tabularnewline
46 & -0.299232 & -2.7425 & 0.003725 \tabularnewline
47 & -0.317176 & -2.907 & 0.002333 \tabularnewline
48 & -0.336149 & -3.0809 & 0.001395 \tabularnewline
\hline
\end{tabular}
%Source: https://freestatistics.org/blog/index.php?pk=277899&T=1

[TABLE]
[ROW][C]Autocorrelation Function[/C][/ROW]
[ROW][C]Time lag k[/C][C]ACF(k)[/C][C]T-STAT[/C][C]P-value[/C][/ROW]
[ROW][C]1[/C][C]0.971948[/C][C]8.9081[/C][C]0[/C][/ROW]
[ROW][C]2[/C][C]0.941154[/C][C]8.6258[/C][C]0[/C][/ROW]
[ROW][C]3[/C][C]0.910184[/C][C]8.342[/C][C]0[/C][/ROW]
[ROW][C]4[/C][C]0.876801[/C][C]8.036[/C][C]0[/C][/ROW]
[ROW][C]5[/C][C]0.84078[/C][C]7.7059[/C][C]0[/C][/ROW]
[ROW][C]6[/C][C]0.800105[/C][C]7.3331[/C][C]0[/C][/ROW]
[ROW][C]7[/C][C]0.752802[/C][C]6.8995[/C][C]0[/C][/ROW]
[ROW][C]8[/C][C]0.706328[/C][C]6.4736[/C][C]0[/C][/ROW]
[ROW][C]9[/C][C]0.662672[/C][C]6.0735[/C][C]0[/C][/ROW]
[ROW][C]10[/C][C]0.620118[/C][C]5.6835[/C][C]0[/C][/ROW]
[ROW][C]11[/C][C]0.574536[/C][C]5.2657[/C][C]1e-06[/C][/ROW]
[ROW][C]12[/C][C]0.525302[/C][C]4.8145[/C][C]3e-06[/C][/ROW]
[ROW][C]13[/C][C]0.483428[/C][C]4.4307[/C][C]1.4e-05[/C][/ROW]
[ROW][C]14[/C][C]0.44155[/C][C]4.0469[/C][C]5.7e-05[/C][/ROW]
[ROW][C]15[/C][C]0.397163[/C][C]3.6401[/C][C]0.000235[/C][/ROW]
[ROW][C]16[/C][C]0.352692[/C][C]3.2325[/C][C]0.000877[/C][/ROW]
[ROW][C]17[/C][C]0.310285[/C][C]2.8438[/C][C]0.002798[/C][/ROW]
[ROW][C]18[/C][C]0.268828[/C][C]2.4639[/C][C]0.007893[/C][/ROW]
[ROW][C]19[/C][C]0.236853[/C][C]2.1708[/C][C]0.016384[/C][/ROW]
[ROW][C]20[/C][C]0.201184[/C][C]1.8439[/C][C]0.034363[/C][/ROW]
[ROW][C]21[/C][C]0.167555[/C][C]1.5357[/C][C]0.064189[/C][/ROW]
[ROW][C]22[/C][C]0.136359[/C][C]1.2498[/C][C]0.10743[/C][/ROW]
[ROW][C]23[/C][C]0.110233[/C][C]1.0103[/C][C]0.157627[/C][/ROW]
[ROW][C]24[/C][C]0.084406[/C][C]0.7736[/C][C]0.220671[/C][/ROW]
[ROW][C]25[/C][C]0.057227[/C][C]0.5245[/C][C]0.300658[/C][/ROW]
[ROW][C]26[/C][C]0.03459[/C][C]0.317[/C][C]0.376006[/C][/ROW]
[ROW][C]27[/C][C]0.014157[/C][C]0.1298[/C][C]0.448535[/C][/ROW]
[ROW][C]28[/C][C]-0.005175[/C][C]-0.0474[/C][C]0.481141[/C][/ROW]
[ROW][C]29[/C][C]-0.022183[/C][C]-0.2033[/C][C]0.419693[/C][/ROW]
[ROW][C]30[/C][C]-0.03652[/C][C]-0.3347[/C][C]0.36934[/C][/ROW]
[ROW][C]31[/C][C]-0.051684[/C][C]-0.4737[/C][C]0.318475[/C][/ROW]
[ROW][C]32[/C][C]-0.067297[/C][C]-0.6168[/C][C]0.269523[/C][/ROW]
[ROW][C]33[/C][C]-0.083582[/C][C]-0.766[/C][C]0.2229[/C][/ROW]
[ROW][C]34[/C][C]-0.098332[/C][C]-0.9012[/C][C]0.185022[/C][/ROW]
[ROW][C]35[/C][C]-0.114875[/C][C]-1.0528[/C][C]0.147716[/C][/ROW]
[ROW][C]36[/C][C]-0.130865[/C][C]-1.1994[/C][C]0.116874[/C][/ROW]
[ROW][C]37[/C][C]-0.147567[/C][C]-1.3525[/C][C]0.089926[/C][/ROW]
[ROW][C]38[/C][C]-0.165234[/C][C]-1.5144[/C][C]0.06684[/C][/ROW]
[ROW][C]39[/C][C]-0.182284[/C][C]-1.6707[/C][C]0.049256[/C][/ROW]
[ROW][C]40[/C][C]-0.198346[/C][C]-1.8179[/C][C]0.036325[/C][/ROW]
[ROW][C]41[/C][C]-0.212826[/C][C]-1.9506[/C][C]0.027221[/C][/ROW]
[ROW][C]42[/C][C]-0.229224[/C][C]-2.1009[/C][C]0.019325[/C][/ROW]
[ROW][C]43[/C][C]-0.247849[/C][C]-2.2716[/C][C]0.012834[/C][/ROW]
[ROW][C]44[/C][C]-0.265987[/C][C]-2.4378[/C][C]0.008443[/C][/ROW]
[ROW][C]45[/C][C]-0.281655[/C][C]-2.5814[/C][C]0.005788[/C][/ROW]
[ROW][C]46[/C][C]-0.299232[/C][C]-2.7425[/C][C]0.003725[/C][/ROW]
[ROW][C]47[/C][C]-0.317176[/C][C]-2.907[/C][C]0.002333[/C][/ROW]
[ROW][C]48[/C][C]-0.336149[/C][C]-3.0809[/C][C]0.001395[/C][/ROW]
[/TABLE]
Source: https://freestatistics.org/blog/index.php?pk=277899&T=1

Globally Unique Identifier (entire table): ba.freestatistics.org/blog/index.php?pk=277899&T=1

As an alternative you can also use a QR Code:  

The GUIDs for individual cells are displayed in the table below:

Autocorrelation Function
Time lag kACF(k)T-STATP-value
10.9719488.90810
20.9411548.62580
30.9101848.3420
40.8768018.0360
50.840787.70590
60.8001057.33310
70.7528026.89950
80.7063286.47360
90.6626726.07350
100.6201185.68350
110.5745365.26571e-06
120.5253024.81453e-06
130.4834284.43071.4e-05
140.441554.04695.7e-05
150.3971633.64010.000235
160.3526923.23250.000877
170.3102852.84380.002798
180.2688282.46390.007893
190.2368532.17080.016384
200.2011841.84390.034363
210.1675551.53570.064189
220.1363591.24980.10743
230.1102331.01030.157627
240.0844060.77360.220671
250.0572270.52450.300658
260.034590.3170.376006
270.0141570.12980.448535
28-0.005175-0.04740.481141
29-0.022183-0.20330.419693
30-0.03652-0.33470.36934
31-0.051684-0.47370.318475
32-0.067297-0.61680.269523
33-0.083582-0.7660.2229
34-0.098332-0.90120.185022
35-0.114875-1.05280.147716
36-0.130865-1.19940.116874
37-0.147567-1.35250.089926
38-0.165234-1.51440.06684
39-0.182284-1.67070.049256
40-0.198346-1.81790.036325
41-0.212826-1.95060.027221
42-0.229224-2.10090.019325
43-0.247849-2.27160.012834
44-0.265987-2.43780.008443
45-0.281655-2.58140.005788
46-0.299232-2.74250.003725
47-0.317176-2.9070.002333
48-0.336149-3.08090.001395


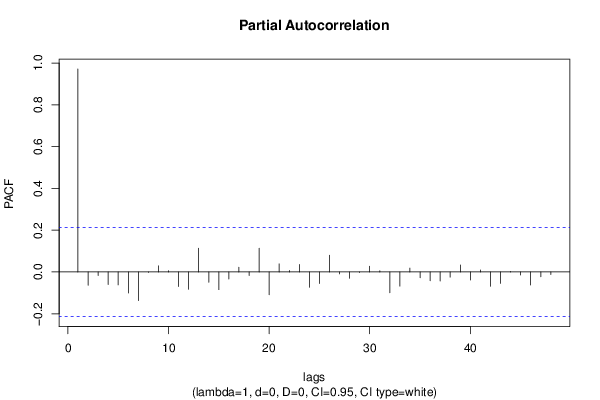
Partial Autocorrelation Function
Time lag kPACF(k)T-STATP-value
10.9719488.90810
2-0.063791-0.58470.280172
3-0.016706-0.15310.439337
4-0.059853-0.54860.292382
5-0.061754-0.5660.286456
6-0.100641-0.92240.179483
7-0.136997-1.25560.106372
8-0.002128-0.01950.492244
90.0291580.26720.394972
100.0060830.05580.477837
11-0.069883-0.64050.261798
12-0.08275-0.75840.225162
130.1135751.04090.150447
14-0.04918-0.45070.32667
15-0.084511-0.77460.220388
16-0.033733-0.30920.37898
170.0229470.21030.416966
18-0.01672-0.15320.439289
190.1132771.03820.151078
20-0.109314-1.00190.159639
210.0387570.35520.361659
220.0067550.06190.475392
230.0356650.32690.372289
24-0.073103-0.670.252348
25-0.054854-0.50270.308231
260.0800730.73390.232531
27-0.009186-0.08420.466551
28-0.030029-0.27520.391911
29-0.00239-0.02190.491286
300.0273210.25040.401443
310.0058870.0540.47855
32-0.09977-0.91440.18156
33-0.067824-0.62160.267939
340.0185510.170.432702
35-0.027668-0.25360.40022
36-0.041745-0.38260.351491
37-0.042989-0.3940.34729
38-0.024657-0.2260.41088
390.0335490.30750.379619
40-0.038172-0.34990.363662
410.0096370.08830.464914
42-0.068447-0.62730.266073
43-0.054697-0.50130.308735
440.0026920.02470.490189
45-0.014196-0.13010.448397
46-0.06198-0.56810.285757
47-0.022644-0.20750.418047
48-0.011894-0.1090.456727

\begin{tabular}{lllllllll}
\hline
Partial Autocorrelation Function \tabularnewline
Time lag k & PACF(k) & T-STAT & P-value \tabularnewline
1 & 0.971948 & 8.9081 & 0 \tabularnewline
2 & -0.063791 & -0.5847 & 0.280172 \tabularnewline
3 & -0.016706 & -0.1531 & 0.439337 \tabularnewline
4 & -0.059853 & -0.5486 & 0.292382 \tabularnewline
5 & -0.061754 & -0.566 & 0.286456 \tabularnewline
6 & -0.100641 & -0.9224 & 0.179483 \tabularnewline
7 & -0.136997 & -1.2556 & 0.106372 \tabularnewline
8 & -0.002128 & -0.0195 & 0.492244 \tabularnewline
9 & 0.029158 & 0.2672 & 0.394972 \tabularnewline
10 & 0.006083 & 0.0558 & 0.477837 \tabularnewline
11 & -0.069883 & -0.6405 & 0.261798 \tabularnewline
12 & -0.08275 & -0.7584 & 0.225162 \tabularnewline
13 & 0.113575 & 1.0409 & 0.150447 \tabularnewline
14 & -0.04918 & -0.4507 & 0.32667 \tabularnewline
15 & -0.084511 & -0.7746 & 0.220388 \tabularnewline
16 & -0.033733 & -0.3092 & 0.37898 \tabularnewline
17 & 0.022947 & 0.2103 & 0.416966 \tabularnewline
18 & -0.01672 & -0.1532 & 0.439289 \tabularnewline
19 & 0.113277 & 1.0382 & 0.151078 \tabularnewline
20 & -0.109314 & -1.0019 & 0.159639 \tabularnewline
21 & 0.038757 & 0.3552 & 0.361659 \tabularnewline
22 & 0.006755 & 0.0619 & 0.475392 \tabularnewline
23 & 0.035665 & 0.3269 & 0.372289 \tabularnewline
24 & -0.073103 & -0.67 & 0.252348 \tabularnewline
25 & -0.054854 & -0.5027 & 0.308231 \tabularnewline
26 & 0.080073 & 0.7339 & 0.232531 \tabularnewline
27 & -0.009186 & -0.0842 & 0.466551 \tabularnewline
28 & -0.030029 & -0.2752 & 0.391911 \tabularnewline
29 & -0.00239 & -0.0219 & 0.491286 \tabularnewline
30 & 0.027321 & 0.2504 & 0.401443 \tabularnewline
31 & 0.005887 & 0.054 & 0.47855 \tabularnewline
32 & -0.09977 & -0.9144 & 0.18156 \tabularnewline
33 & -0.067824 & -0.6216 & 0.267939 \tabularnewline
34 & 0.018551 & 0.17 & 0.432702 \tabularnewline
35 & -0.027668 & -0.2536 & 0.40022 \tabularnewline
36 & -0.041745 & -0.3826 & 0.351491 \tabularnewline
37 & -0.042989 & -0.394 & 0.34729 \tabularnewline
38 & -0.024657 & -0.226 & 0.41088 \tabularnewline
39 & 0.033549 & 0.3075 & 0.379619 \tabularnewline
40 & -0.038172 & -0.3499 & 0.363662 \tabularnewline
41 & 0.009637 & 0.0883 & 0.464914 \tabularnewline
42 & -0.068447 & -0.6273 & 0.266073 \tabularnewline
43 & -0.054697 & -0.5013 & 0.308735 \tabularnewline
44 & 0.002692 & 0.0247 & 0.490189 \tabularnewline
45 & -0.014196 & -0.1301 & 0.448397 \tabularnewline
46 & -0.06198 & -0.5681 & 0.285757 \tabularnewline
47 & -0.022644 & -0.2075 & 0.418047 \tabularnewline
48 & -0.011894 & -0.109 & 0.456727 \tabularnewline
\hline
\end{tabular}
%Source: https://freestatistics.org/blog/index.php?pk=277899&T=2

[TABLE]
[ROW][C]Partial Autocorrelation Function[/C][/ROW]
[ROW][C]Time lag k[/C][C]PACF(k)[/C][C]T-STAT[/C][C]P-value[/C][/ROW]
[ROW][C]1[/C][C]0.971948[/C][C]8.9081[/C][C]0[/C][/ROW]
[ROW][C]2[/C][C]-0.063791[/C][C]-0.5847[/C][C]0.280172[/C][/ROW]
[ROW][C]3[/C][C]-0.016706[/C][C]-0.1531[/C][C]0.439337[/C][/ROW]
[ROW][C]4[/C][C]-0.059853[/C][C]-0.5486[/C][C]0.292382[/C][/ROW]
[ROW][C]5[/C][C]-0.061754[/C][C]-0.566[/C][C]0.286456[/C][/ROW]
[ROW][C]6[/C][C]-0.100641[/C][C]-0.9224[/C][C]0.179483[/C][/ROW]
[ROW][C]7[/C][C]-0.136997[/C][C]-1.2556[/C][C]0.106372[/C][/ROW]
[ROW][C]8[/C][C]-0.002128[/C][C]-0.0195[/C][C]0.492244[/C][/ROW]
[ROW][C]9[/C][C]0.029158[/C][C]0.2672[/C][C]0.394972[/C][/ROW]
[ROW][C]10[/C][C]0.006083[/C][C]0.0558[/C][C]0.477837[/C][/ROW]
[ROW][C]11[/C][C]-0.069883[/C][C]-0.6405[/C][C]0.261798[/C][/ROW]
[ROW][C]12[/C][C]-0.08275[/C][C]-0.7584[/C][C]0.225162[/C][/ROW]
[ROW][C]13[/C][C]0.113575[/C][C]1.0409[/C][C]0.150447[/C][/ROW]
[ROW][C]14[/C][C]-0.04918[/C][C]-0.4507[/C][C]0.32667[/C][/ROW]
[ROW][C]15[/C][C]-0.084511[/C][C]-0.7746[/C][C]0.220388[/C][/ROW]
[ROW][C]16[/C][C]-0.033733[/C][C]-0.3092[/C][C]0.37898[/C][/ROW]
[ROW][C]17[/C][C]0.022947[/C][C]0.2103[/C][C]0.416966[/C][/ROW]
[ROW][C]18[/C][C]-0.01672[/C][C]-0.1532[/C][C]0.439289[/C][/ROW]
[ROW][C]19[/C][C]0.113277[/C][C]1.0382[/C][C]0.151078[/C][/ROW]
[ROW][C]20[/C][C]-0.109314[/C][C]-1.0019[/C][C]0.159639[/C][/ROW]
[ROW][C]21[/C][C]0.038757[/C][C]0.3552[/C][C]0.361659[/C][/ROW]
[ROW][C]22[/C][C]0.006755[/C][C]0.0619[/C][C]0.475392[/C][/ROW]
[ROW][C]23[/C][C]0.035665[/C][C]0.3269[/C][C]0.372289[/C][/ROW]
[ROW][C]24[/C][C]-0.073103[/C][C]-0.67[/C][C]0.252348[/C][/ROW]
[ROW][C]25[/C][C]-0.054854[/C][C]-0.5027[/C][C]0.308231[/C][/ROW]
[ROW][C]26[/C][C]0.080073[/C][C]0.7339[/C][C]0.232531[/C][/ROW]
[ROW][C]27[/C][C]-0.009186[/C][C]-0.0842[/C][C]0.466551[/C][/ROW]
[ROW][C]28[/C][C]-0.030029[/C][C]-0.2752[/C][C]0.391911[/C][/ROW]
[ROW][C]29[/C][C]-0.00239[/C][C]-0.0219[/C][C]0.491286[/C][/ROW]
[ROW][C]30[/C][C]0.027321[/C][C]0.2504[/C][C]0.401443[/C][/ROW]
[ROW][C]31[/C][C]0.005887[/C][C]0.054[/C][C]0.47855[/C][/ROW]
[ROW][C]32[/C][C]-0.09977[/C][C]-0.9144[/C][C]0.18156[/C][/ROW]
[ROW][C]33[/C][C]-0.067824[/C][C]-0.6216[/C][C]0.267939[/C][/ROW]
[ROW][C]34[/C][C]0.018551[/C][C]0.17[/C][C]0.432702[/C][/ROW]
[ROW][C]35[/C][C]-0.027668[/C][C]-0.2536[/C][C]0.40022[/C][/ROW]
[ROW][C]36[/C][C]-0.041745[/C][C]-0.3826[/C][C]0.351491[/C][/ROW]
[ROW][C]37[/C][C]-0.042989[/C][C]-0.394[/C][C]0.34729[/C][/ROW]
[ROW][C]38[/C][C]-0.024657[/C][C]-0.226[/C][C]0.41088[/C][/ROW]
[ROW][C]39[/C][C]0.033549[/C][C]0.3075[/C][C]0.379619[/C][/ROW]
[ROW][C]40[/C][C]-0.038172[/C][C]-0.3499[/C][C]0.363662[/C][/ROW]
[ROW][C]41[/C][C]0.009637[/C][C]0.0883[/C][C]0.464914[/C][/ROW]
[ROW][C]42[/C][C]-0.068447[/C][C]-0.6273[/C][C]0.266073[/C][/ROW]
[ROW][C]43[/C][C]-0.054697[/C][C]-0.5013[/C][C]0.308735[/C][/ROW]
[ROW][C]44[/C][C]0.002692[/C][C]0.0247[/C][C]0.490189[/C][/ROW]
[ROW][C]45[/C][C]-0.014196[/C][C]-0.1301[/C][C]0.448397[/C][/ROW]
[ROW][C]46[/C][C]-0.06198[/C][C]-0.5681[/C][C]0.285757[/C][/ROW]
[ROW][C]47[/C][C]-0.022644[/C][C]-0.2075[/C][C]0.418047[/C][/ROW]
[ROW][C]48[/C][C]-0.011894[/C][C]-0.109[/C][C]0.456727[/C][/ROW]
[/TABLE]
Source: https://freestatistics.org/blog/index.php?pk=277899&T=2

Globally Unique Identifier (entire table): ba.freestatistics.org/blog/index.php?pk=277899&T=2

As an alternative you can also use a QR Code:  

The GUIDs for individual cells are displayed in the table below:

Partial Autocorrelation Function
Time lag kPACF(k)T-STATP-value
10.9719488.90810
2-0.063791-0.58470.280172
3-0.016706-0.15310.439337
4-0.059853-0.54860.292382
5-0.061754-0.5660.286456
6-0.100641-0.92240.179483
7-0.136997-1.25560.106372
8-0.002128-0.01950.492244
90.0291580.26720.394972
100.0060830.05580.477837
11-0.069883-0.64050.261798
12-0.08275-0.75840.225162
130.1135751.04090.150447
14-0.04918-0.45070.32667
15-0.084511-0.77460.220388
16-0.033733-0.30920.37898
170.0229470.21030.416966
18-0.01672-0.15320.439289
190.1132771.03820.151078
20-0.109314-1.00190.159639
210.0387570.35520.361659
220.0067550.06190.475392
230.0356650.32690.372289
24-0.073103-0.670.252348
25-0.054854-0.50270.308231
260.0800730.73390.232531
27-0.009186-0.08420.466551
28-0.030029-0.27520.391911
29-0.00239-0.02190.491286
300.0273210.25040.401443
310.0058870.0540.47855
32-0.09977-0.91440.18156
33-0.067824-0.62160.267939
340.0185510.170.432702
35-0.027668-0.25360.40022
36-0.041745-0.38260.351491
37-0.042989-0.3940.34729
38-0.024657-0.2260.41088
390.0335490.30750.379619
40-0.038172-0.34990.363662
410.0096370.08830.464914
42-0.068447-0.62730.266073
43-0.054697-0.50130.308735
440.0026920.02470.490189
45-0.014196-0.13010.448397
46-0.06198-0.56810.285757
47-0.022644-0.20750.418047
48-0.011894-0.1090.456727


Parameters (Session):
par1 = 48 ; par2 = 1 ; par3 = 0 ; par4 = 0 ; par5 = 12 ; par6 = White Noise ; par7 = 0.95 ;
Parameters (R input):
par1 = 48 ; par2 = 1 ; par3 = 0 ; par4 = 0 ; par5 = 12 ; par6 = White Noise ; par7 = 0.95 ; par8 = ;
R code (references can be found in the software module):
par8 <- ''
par7 <- '0.95'
par6 <- 'White Noise'
par5 <- '12'
par4 <- '1'
par3 <- '0'
par2 <- '1'
par1 <- '48'
if (par1 == 'Default') {
par1 = 10*log10(length(x))
} else {
par1 <- as.numeric(par1)
}
par2 <- as.numeric(par2)
par3 <- as.numeric(par3)
par4 <- as.numeric(par4)
par5 <- as.numeric(par5)
if (par6 == 'White Noise') par6 <- 'white' else par6 <- 'ma'
par7 <- as.numeric(par7)
if (par8 != '') par8 <- as.numeric(par8)
ox <- x
if (par8 == '') {
if (par2 == 0) {
x <- log(x)
} else {
x <- (x ^ par2 - 1) / par2
}
} else {
x <- log(x,base=par8)
}
if (par3 > 0) x <- diff(x,lag=1,difference=par3)
if (par4 > 0) x <- diff(x,lag=par5,difference=par4)
bitmap(file='picts.png')
op <- par(mfrow=c(2,1))
plot(ox,type='l',main='Original Time Series',xlab='time',ylab='value')
if (par8=='') {
mytitle <- paste('Working Time Series (lambda=',par2,', d=',par3,', D=',par4,')',sep='')
mysub <- paste('(lambda=',par2,', d=',par3,', D=',par4,', CI=', par7, ', CI type=',par6,')',sep='')
} else {
mytitle <- paste('Working Time Series (base=',par8,', d=',par3,', D=',par4,')',sep='')
mysub <- paste('(base=',par8,', d=',par3,', D=',par4,', CI=', par7, ', CI type=',par6,')',sep='')
}
plot(x,type='l', main=mytitle,xlab='time',ylab='value')
par(op)
dev.off()
bitmap(file='pic1.png')
racf <- acf(x, par1, main='Autocorrelation', xlab='time lag', ylab='ACF', ci.type=par6, ci=par7, sub=mysub)
dev.off()
bitmap(file='pic2.png')
rpacf <- pacf(x,par1,main='Partial Autocorrelation',xlab='lags',ylab='PACF',sub=mysub)
dev.off()
(myacf <- c(racf$acf))
(mypacf <- c(rpacf$acf))
lengthx <- length(x)
sqrtn <- sqrt(lengthx)
load(file='createtable')
a<-table.start()
a<-table.row.start(a)
a<-table.element(a,'Autocorrelation Function',4,TRUE)
a<-table.row.end(a)
a<-table.row.start(a)
a<-table.element(a,'Time lag k',header=TRUE)
a<-table.element(a,hyperlink('basics.htm','ACF(k)','click here for more information about the Autocorrelation Function'),header=TRUE)
a<-table.element(a,'T-STAT',header=TRUE)
a<-table.element(a,'P-value',header=TRUE)
a<-table.row.end(a)
for (i in 2:(par1+1)) {
a<-table.row.start(a)
a<-table.element(a,i-1,header=TRUE)
a<-table.element(a,round(myacf[i],6))
mytstat <- myacf[i]*sqrtn
a<-table.element(a,round(mytstat,4))
a<-table.element(a,round(1-pt(abs(mytstat),lengthx),6))
a<-table.row.end(a)
}
a<-table.end(a)
table.save(a,file='mytable.tab')
a<-table.start()
a<-table.row.start(a)
a<-table.element(a,'Partial Autocorrelation Function',4,TRUE)
a<-table.row.end(a)
a<-table.row.start(a)
a<-table.element(a,'Time lag k',header=TRUE)
a<-table.element(a,hyperlink('basics.htm','PACF(k)','click here for more information about the Partial Autocorrelation Function'),header=TRUE)
a<-table.element(a,'T-STAT',header=TRUE)
a<-table.element(a,'P-value',header=TRUE)
a<-table.row.end(a)
for (i in 1:par1) {
a<-table.row.start(a)
a<-table.element(a,i,header=TRUE)
a<-table.element(a,round(mypacf[i],6))
mytstat <- mypacf[i]*sqrtn
a<-table.element(a,round(mytstat,4))
a<-table.element(a,round(1-pt(abs(mytstat),lengthx),6))
a<-table.row.end(a)
}
a<-table.end(a)
table.save(a,file='mytable1.tab')