Free Statistics

of Irreproducible Research!

Author's title

Author*Unverified author*
R Software Modulerwasp_autocorrelation.wasp
Title produced by software(Partial) Autocorrelation Function
Date of computationWed, 04 Mar 2015 16:08:27 +0000
Cite this page as followsStatistical Computations at FreeStatistics.org, Office for Research Development and Education, URL https://freestatistics.org/blog/index.php?v=date/2015/Mar/04/t142548549175q2zznbmb260oh.htm/, Retrieved Sun, 19 May 2024 15:21:23 +0000
Statistical Computations at FreeStatistics.org, Office for Research Development and Education, URL https://freestatistics.org/blog/index.php?pk=277888, Retrieved Sun, 19 May 2024 15:21:23 +0000
QR Codes:

Original text written by user:
IsPrivate?No (this computation is public)
User-defined keywords
Estimated Impact165
Family? (F = Feedback message, R = changed R code, M = changed R Module, P = changed Parameters, D = changed Data)
-       [(Partial) Autocorrelation Function] [autocorrelation f...] [2015-03-04 16:08:27] [ab73e159a571dceeee45078a19254ea4] [Current]
Feedback Forum

Post a new message
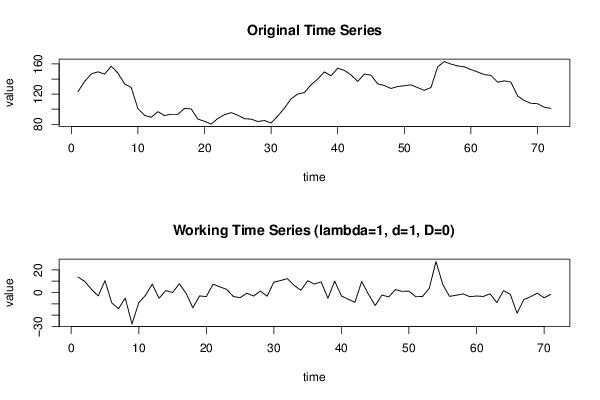
Dataseries X:
123,2
136,9
146,8
149,6
146,5
157
147,9
133,6
128,7
100,8
91,8
89,3
96,7
91,6
93,3
93,3
101
100,4
86,9
83,9
80,3
87,7
92,7
95,5
92
87,4
86,8
83,7
85
81,7
90,9
101,5
113,8
120,1
122,1
132,5
140
149,4
144,3
154,4
151,4
145,5
136,8
146,6
145,1
133,6
131,4
127,5
130,1
131,1
132,3
128,6
125,1
128,7
156,1
163,2
159,8
157,4
156,2
152,5
149,4
145,9
144,8
135,9
137,6
136
117,7
111,5
107,8
107,3
102,6
101


Summary of computational transaction
Raw Inputview raw input (R code)
Raw Outputview raw output of R engine
Computing time2 seconds
R Server'George Udny Yule' @ yule.wessa.net

\begin{tabular}{lllllllll}
\hline
Summary of computational transaction \tabularnewline
Raw Input & view raw input (R code)  \tabularnewline
Raw Output & view raw output of R engine  \tabularnewline
Computing time & 2 seconds \tabularnewline
R Server & 'George Udny Yule' @ yule.wessa.net \tabularnewline
\hline
\end{tabular}
%Source: https://freestatistics.org/blog/index.php?pk=277888&T=0

[TABLE]
[ROW][C]Summary of computational transaction[/C][/ROW]
[ROW][C]Raw Input[/C][C]view raw input (R code) [/C][/ROW]
[ROW][C]Raw Output[/C][C]view raw output of R engine [/C][/ROW]
[ROW][C]Computing time[/C][C]2 seconds[/C][/ROW]
[ROW][C]R Server[/C][C]'George Udny Yule' @ yule.wessa.net[/C][/ROW]
[/TABLE]
Source: https://freestatistics.org/blog/index.php?pk=277888&T=0

Globally Unique Identifier (entire table): ba.freestatistics.org/blog/index.php?pk=277888&T=0

As an alternative you can also use a QR Code:  

The GUIDs for individual cells are displayed in the table below:

Summary of computational transaction
Raw Inputview raw input (R code)
Raw Outputview raw output of R engine
Computing time2 seconds
R Server'George Udny Yule' @ yule.wessa.net


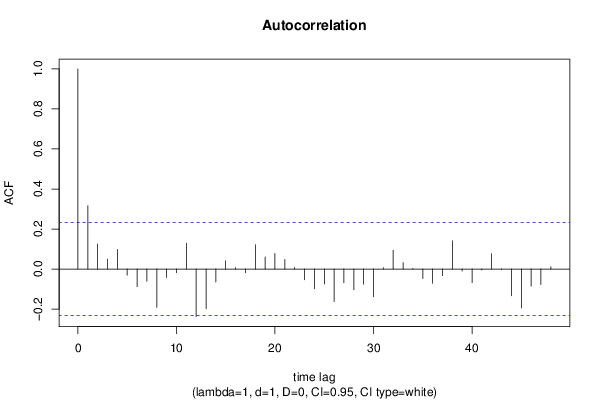
Autocorrelation Function
Time lag kACF(k)T-STATP-value
10.3161182.66370.004779
20.1254251.05680.147082
30.0497420.41910.338191
40.0976140.82250.206769
5-0.030495-0.2570.398979
6-0.087733-0.73930.231095
7-0.060747-0.51190.305168
8-0.191301-1.61190.055707
9-0.042099-0.35470.361922
10-0.018023-0.15190.439863
110.1290211.08720.140323
12-0.237798-2.00370.024458
13-0.198083-1.66910.049753
14-0.06458-0.54420.294019
150.0410670.3460.36517
160.0073120.06160.475521
17-0.018205-0.15340.439258
180.1215961.02460.154518
190.0602970.50810.30649
200.0779020.65640.256841
210.0480720.40510.343325
220.0080860.06810.472936
23-0.053519-0.4510.326697
24-0.098894-0.83330.203736
25-0.074751-0.62990.265402
26-0.162061-1.36560.088195
27-0.068543-0.57760.282697
28-0.103586-0.87280.192849
29-0.075983-0.64020.262037
30-0.13851-1.16710.123536
310.0064760.05460.478317
320.0937240.78970.216157
330.0323120.27230.393104
340.0027890.02350.490658
35-0.047573-0.40090.344865
36-0.070856-0.5970.276189
37-0.032741-0.27590.39172
380.1415881.1930.118412
39-0.009885-0.08330.466926
40-0.067889-0.5720.284549
41-0.0049-0.04130.483592
420.0773730.6520.258267
43-0.002036-0.01720.49318
44-0.133355-1.12370.13247
45-0.194998-1.64310.052394
46-0.085249-0.71830.237457
47-0.077444-0.65260.258074
480.0120250.10130.45979

\begin{tabular}{lllllllll}
\hline
Autocorrelation Function \tabularnewline
Time lag k & ACF(k) & T-STAT & P-value \tabularnewline
1 & 0.316118 & 2.6637 & 0.004779 \tabularnewline
2 & 0.125425 & 1.0568 & 0.147082 \tabularnewline
3 & 0.049742 & 0.4191 & 0.338191 \tabularnewline
4 & 0.097614 & 0.8225 & 0.206769 \tabularnewline
5 & -0.030495 & -0.257 & 0.398979 \tabularnewline
6 & -0.087733 & -0.7393 & 0.231095 \tabularnewline
7 & -0.060747 & -0.5119 & 0.305168 \tabularnewline
8 & -0.191301 & -1.6119 & 0.055707 \tabularnewline
9 & -0.042099 & -0.3547 & 0.361922 \tabularnewline
10 & -0.018023 & -0.1519 & 0.439863 \tabularnewline
11 & 0.129021 & 1.0872 & 0.140323 \tabularnewline
12 & -0.237798 & -2.0037 & 0.024458 \tabularnewline
13 & -0.198083 & -1.6691 & 0.049753 \tabularnewline
14 & -0.06458 & -0.5442 & 0.294019 \tabularnewline
15 & 0.041067 & 0.346 & 0.36517 \tabularnewline
16 & 0.007312 & 0.0616 & 0.475521 \tabularnewline
17 & -0.018205 & -0.1534 & 0.439258 \tabularnewline
18 & 0.121596 & 1.0246 & 0.154518 \tabularnewline
19 & 0.060297 & 0.5081 & 0.30649 \tabularnewline
20 & 0.077902 & 0.6564 & 0.256841 \tabularnewline
21 & 0.048072 & 0.4051 & 0.343325 \tabularnewline
22 & 0.008086 & 0.0681 & 0.472936 \tabularnewline
23 & -0.053519 & -0.451 & 0.326697 \tabularnewline
24 & -0.098894 & -0.8333 & 0.203736 \tabularnewline
25 & -0.074751 & -0.6299 & 0.265402 \tabularnewline
26 & -0.162061 & -1.3656 & 0.088195 \tabularnewline
27 & -0.068543 & -0.5776 & 0.282697 \tabularnewline
28 & -0.103586 & -0.8728 & 0.192849 \tabularnewline
29 & -0.075983 & -0.6402 & 0.262037 \tabularnewline
30 & -0.13851 & -1.1671 & 0.123536 \tabularnewline
31 & 0.006476 & 0.0546 & 0.478317 \tabularnewline
32 & 0.093724 & 0.7897 & 0.216157 \tabularnewline
33 & 0.032312 & 0.2723 & 0.393104 \tabularnewline
34 & 0.002789 & 0.0235 & 0.490658 \tabularnewline
35 & -0.047573 & -0.4009 & 0.344865 \tabularnewline
36 & -0.070856 & -0.597 & 0.276189 \tabularnewline
37 & -0.032741 & -0.2759 & 0.39172 \tabularnewline
38 & 0.141588 & 1.193 & 0.118412 \tabularnewline
39 & -0.009885 & -0.0833 & 0.466926 \tabularnewline
40 & -0.067889 & -0.572 & 0.284549 \tabularnewline
41 & -0.0049 & -0.0413 & 0.483592 \tabularnewline
42 & 0.077373 & 0.652 & 0.258267 \tabularnewline
43 & -0.002036 & -0.0172 & 0.49318 \tabularnewline
44 & -0.133355 & -1.1237 & 0.13247 \tabularnewline
45 & -0.194998 & -1.6431 & 0.052394 \tabularnewline
46 & -0.085249 & -0.7183 & 0.237457 \tabularnewline
47 & -0.077444 & -0.6526 & 0.258074 \tabularnewline
48 & 0.012025 & 0.1013 & 0.45979 \tabularnewline
\hline
\end{tabular}
%Source: https://freestatistics.org/blog/index.php?pk=277888&T=1

[TABLE]
[ROW][C]Autocorrelation Function[/C][/ROW]
[ROW][C]Time lag k[/C][C]ACF(k)[/C][C]T-STAT[/C][C]P-value[/C][/ROW]
[ROW][C]1[/C][C]0.316118[/C][C]2.6637[/C][C]0.004779[/C][/ROW]
[ROW][C]2[/C][C]0.125425[/C][C]1.0568[/C][C]0.147082[/C][/ROW]
[ROW][C]3[/C][C]0.049742[/C][C]0.4191[/C][C]0.338191[/C][/ROW]
[ROW][C]4[/C][C]0.097614[/C][C]0.8225[/C][C]0.206769[/C][/ROW]
[ROW][C]5[/C][C]-0.030495[/C][C]-0.257[/C][C]0.398979[/C][/ROW]
[ROW][C]6[/C][C]-0.087733[/C][C]-0.7393[/C][C]0.231095[/C][/ROW]
[ROW][C]7[/C][C]-0.060747[/C][C]-0.5119[/C][C]0.305168[/C][/ROW]
[ROW][C]8[/C][C]-0.191301[/C][C]-1.6119[/C][C]0.055707[/C][/ROW]
[ROW][C]9[/C][C]-0.042099[/C][C]-0.3547[/C][C]0.361922[/C][/ROW]
[ROW][C]10[/C][C]-0.018023[/C][C]-0.1519[/C][C]0.439863[/C][/ROW]
[ROW][C]11[/C][C]0.129021[/C][C]1.0872[/C][C]0.140323[/C][/ROW]
[ROW][C]12[/C][C]-0.237798[/C][C]-2.0037[/C][C]0.024458[/C][/ROW]
[ROW][C]13[/C][C]-0.198083[/C][C]-1.6691[/C][C]0.049753[/C][/ROW]
[ROW][C]14[/C][C]-0.06458[/C][C]-0.5442[/C][C]0.294019[/C][/ROW]
[ROW][C]15[/C][C]0.041067[/C][C]0.346[/C][C]0.36517[/C][/ROW]
[ROW][C]16[/C][C]0.007312[/C][C]0.0616[/C][C]0.475521[/C][/ROW]
[ROW][C]17[/C][C]-0.018205[/C][C]-0.1534[/C][C]0.439258[/C][/ROW]
[ROW][C]18[/C][C]0.121596[/C][C]1.0246[/C][C]0.154518[/C][/ROW]
[ROW][C]19[/C][C]0.060297[/C][C]0.5081[/C][C]0.30649[/C][/ROW]
[ROW][C]20[/C][C]0.077902[/C][C]0.6564[/C][C]0.256841[/C][/ROW]
[ROW][C]21[/C][C]0.048072[/C][C]0.4051[/C][C]0.343325[/C][/ROW]
[ROW][C]22[/C][C]0.008086[/C][C]0.0681[/C][C]0.472936[/C][/ROW]
[ROW][C]23[/C][C]-0.053519[/C][C]-0.451[/C][C]0.326697[/C][/ROW]
[ROW][C]24[/C][C]-0.098894[/C][C]-0.8333[/C][C]0.203736[/C][/ROW]
[ROW][C]25[/C][C]-0.074751[/C][C]-0.6299[/C][C]0.265402[/C][/ROW]
[ROW][C]26[/C][C]-0.162061[/C][C]-1.3656[/C][C]0.088195[/C][/ROW]
[ROW][C]27[/C][C]-0.068543[/C][C]-0.5776[/C][C]0.282697[/C][/ROW]
[ROW][C]28[/C][C]-0.103586[/C][C]-0.8728[/C][C]0.192849[/C][/ROW]
[ROW][C]29[/C][C]-0.075983[/C][C]-0.6402[/C][C]0.262037[/C][/ROW]
[ROW][C]30[/C][C]-0.13851[/C][C]-1.1671[/C][C]0.123536[/C][/ROW]
[ROW][C]31[/C][C]0.006476[/C][C]0.0546[/C][C]0.478317[/C][/ROW]
[ROW][C]32[/C][C]0.093724[/C][C]0.7897[/C][C]0.216157[/C][/ROW]
[ROW][C]33[/C][C]0.032312[/C][C]0.2723[/C][C]0.393104[/C][/ROW]
[ROW][C]34[/C][C]0.002789[/C][C]0.0235[/C][C]0.490658[/C][/ROW]
[ROW][C]35[/C][C]-0.047573[/C][C]-0.4009[/C][C]0.344865[/C][/ROW]
[ROW][C]36[/C][C]-0.070856[/C][C]-0.597[/C][C]0.276189[/C][/ROW]
[ROW][C]37[/C][C]-0.032741[/C][C]-0.2759[/C][C]0.39172[/C][/ROW]
[ROW][C]38[/C][C]0.141588[/C][C]1.193[/C][C]0.118412[/C][/ROW]
[ROW][C]39[/C][C]-0.009885[/C][C]-0.0833[/C][C]0.466926[/C][/ROW]
[ROW][C]40[/C][C]-0.067889[/C][C]-0.572[/C][C]0.284549[/C][/ROW]
[ROW][C]41[/C][C]-0.0049[/C][C]-0.0413[/C][C]0.483592[/C][/ROW]
[ROW][C]42[/C][C]0.077373[/C][C]0.652[/C][C]0.258267[/C][/ROW]
[ROW][C]43[/C][C]-0.002036[/C][C]-0.0172[/C][C]0.49318[/C][/ROW]
[ROW][C]44[/C][C]-0.133355[/C][C]-1.1237[/C][C]0.13247[/C][/ROW]
[ROW][C]45[/C][C]-0.194998[/C][C]-1.6431[/C][C]0.052394[/C][/ROW]
[ROW][C]46[/C][C]-0.085249[/C][C]-0.7183[/C][C]0.237457[/C][/ROW]
[ROW][C]47[/C][C]-0.077444[/C][C]-0.6526[/C][C]0.258074[/C][/ROW]
[ROW][C]48[/C][C]0.012025[/C][C]0.1013[/C][C]0.45979[/C][/ROW]
[/TABLE]
Source: https://freestatistics.org/blog/index.php?pk=277888&T=1

Globally Unique Identifier (entire table): ba.freestatistics.org/blog/index.php?pk=277888&T=1

As an alternative you can also use a QR Code:  

The GUIDs for individual cells are displayed in the table below:

Autocorrelation Function
Time lag kACF(k)T-STATP-value
10.3161182.66370.004779
20.1254251.05680.147082
30.0497420.41910.338191
40.0976140.82250.206769
5-0.030495-0.2570.398979
6-0.087733-0.73930.231095
7-0.060747-0.51190.305168
8-0.191301-1.61190.055707
9-0.042099-0.35470.361922
10-0.018023-0.15190.439863
110.1290211.08720.140323
12-0.237798-2.00370.024458
13-0.198083-1.66910.049753
14-0.06458-0.54420.294019
150.0410670.3460.36517
160.0073120.06160.475521
17-0.018205-0.15340.439258
180.1215961.02460.154518
190.0602970.50810.30649
200.0779020.65640.256841
210.0480720.40510.343325
220.0080860.06810.472936
23-0.053519-0.4510.326697
24-0.098894-0.83330.203736
25-0.074751-0.62990.265402
26-0.162061-1.36560.088195
27-0.068543-0.57760.282697
28-0.103586-0.87280.192849
29-0.075983-0.64020.262037
30-0.13851-1.16710.123536
310.0064760.05460.478317
320.0937240.78970.216157
330.0323120.27230.393104
340.0027890.02350.490658
35-0.047573-0.40090.344865
36-0.070856-0.5970.276189
37-0.032741-0.27590.39172
380.1415881.1930.118412
39-0.009885-0.08330.466926
40-0.067889-0.5720.284549
41-0.0049-0.04130.483592
420.0773730.6520.258267
43-0.002036-0.01720.49318
44-0.133355-1.12370.13247
45-0.194998-1.64310.052394
46-0.085249-0.71830.237457
47-0.077444-0.65260.258074
480.0120250.10130.45979


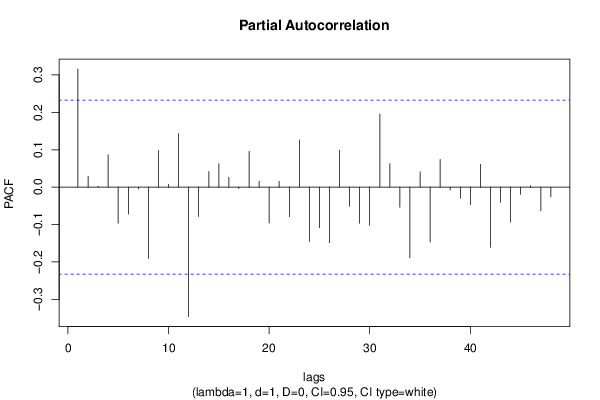
Partial Autocorrelation Function
Time lag kPACF(k)T-STATP-value
10.3161182.66370.004779
20.0283240.23870.406026
30.0025160.02120.491574
40.0868280.73160.233403
5-0.096487-0.8130.209464
6-0.071666-0.60390.273928
7-0.005027-0.04240.483165
8-0.191028-1.60960.055958
90.0981670.82720.205457
100.0076140.06420.474513
110.1431951.20660.1158
12-0.34636-2.91850.002354
13-0.078102-0.65810.256301
140.0416750.35120.363255
150.0627020.52830.299456
160.0262840.22150.412679
17-0.003662-0.03090.487736
180.0962010.81060.21015
190.0157810.1330.447295
20-0.095839-0.80760.211022
210.0158150.13330.447184
22-0.079117-0.66670.253578
230.1262081.06340.145592
24-0.14552-1.22620.112092
25-0.108379-0.91320.18211
26-0.148349-1.250.107699
270.0985230.83020.204613
28-0.050924-0.42910.334576
29-0.096701-0.81480.208952
30-0.102188-0.8610.196055
310.195261.64530.052166
320.0625120.52670.300008
33-0.053705-0.45250.326134
34-0.188929-1.59190.05792
350.0408290.3440.36592
36-0.146682-1.2360.110273
370.0740430.62390.267348
38-0.007715-0.0650.474175
39-0.029601-0.24940.401877
40-0.046725-0.39370.347487
410.0612550.51610.303678
42-0.160646-1.35360.090075
43-0.040249-0.33910.367753
44-0.093298-0.78610.217199
45-0.018905-0.15930.436945
460.0041890.03530.485972
47-0.063266-0.53310.297818
48-0.025542-0.21520.415107

\begin{tabular}{lllllllll}
\hline
Partial Autocorrelation Function \tabularnewline
Time lag k & PACF(k) & T-STAT & P-value \tabularnewline
1 & 0.316118 & 2.6637 & 0.004779 \tabularnewline
2 & 0.028324 & 0.2387 & 0.406026 \tabularnewline
3 & 0.002516 & 0.0212 & 0.491574 \tabularnewline
4 & 0.086828 & 0.7316 & 0.233403 \tabularnewline
5 & -0.096487 & -0.813 & 0.209464 \tabularnewline
6 & -0.071666 & -0.6039 & 0.273928 \tabularnewline
7 & -0.005027 & -0.0424 & 0.483165 \tabularnewline
8 & -0.191028 & -1.6096 & 0.055958 \tabularnewline
9 & 0.098167 & 0.8272 & 0.205457 \tabularnewline
10 & 0.007614 & 0.0642 & 0.474513 \tabularnewline
11 & 0.143195 & 1.2066 & 0.1158 \tabularnewline
12 & -0.34636 & -2.9185 & 0.002354 \tabularnewline
13 & -0.078102 & -0.6581 & 0.256301 \tabularnewline
14 & 0.041675 & 0.3512 & 0.363255 \tabularnewline
15 & 0.062702 & 0.5283 & 0.299456 \tabularnewline
16 & 0.026284 & 0.2215 & 0.412679 \tabularnewline
17 & -0.003662 & -0.0309 & 0.487736 \tabularnewline
18 & 0.096201 & 0.8106 & 0.21015 \tabularnewline
19 & 0.015781 & 0.133 & 0.447295 \tabularnewline
20 & -0.095839 & -0.8076 & 0.211022 \tabularnewline
21 & 0.015815 & 0.1333 & 0.447184 \tabularnewline
22 & -0.079117 & -0.6667 & 0.253578 \tabularnewline
23 & 0.126208 & 1.0634 & 0.145592 \tabularnewline
24 & -0.14552 & -1.2262 & 0.112092 \tabularnewline
25 & -0.108379 & -0.9132 & 0.18211 \tabularnewline
26 & -0.148349 & -1.25 & 0.107699 \tabularnewline
27 & 0.098523 & 0.8302 & 0.204613 \tabularnewline
28 & -0.050924 & -0.4291 & 0.334576 \tabularnewline
29 & -0.096701 & -0.8148 & 0.208952 \tabularnewline
30 & -0.102188 & -0.861 & 0.196055 \tabularnewline
31 & 0.19526 & 1.6453 & 0.052166 \tabularnewline
32 & 0.062512 & 0.5267 & 0.300008 \tabularnewline
33 & -0.053705 & -0.4525 & 0.326134 \tabularnewline
34 & -0.188929 & -1.5919 & 0.05792 \tabularnewline
35 & 0.040829 & 0.344 & 0.36592 \tabularnewline
36 & -0.146682 & -1.236 & 0.110273 \tabularnewline
37 & 0.074043 & 0.6239 & 0.267348 \tabularnewline
38 & -0.007715 & -0.065 & 0.474175 \tabularnewline
39 & -0.029601 & -0.2494 & 0.401877 \tabularnewline
40 & -0.046725 & -0.3937 & 0.347487 \tabularnewline
41 & 0.061255 & 0.5161 & 0.303678 \tabularnewline
42 & -0.160646 & -1.3536 & 0.090075 \tabularnewline
43 & -0.040249 & -0.3391 & 0.367753 \tabularnewline
44 & -0.093298 & -0.7861 & 0.217199 \tabularnewline
45 & -0.018905 & -0.1593 & 0.436945 \tabularnewline
46 & 0.004189 & 0.0353 & 0.485972 \tabularnewline
47 & -0.063266 & -0.5331 & 0.297818 \tabularnewline
48 & -0.025542 & -0.2152 & 0.415107 \tabularnewline
\hline
\end{tabular}
%Source: https://freestatistics.org/blog/index.php?pk=277888&T=2

[TABLE]
[ROW][C]Partial Autocorrelation Function[/C][/ROW]
[ROW][C]Time lag k[/C][C]PACF(k)[/C][C]T-STAT[/C][C]P-value[/C][/ROW]
[ROW][C]1[/C][C]0.316118[/C][C]2.6637[/C][C]0.004779[/C][/ROW]
[ROW][C]2[/C][C]0.028324[/C][C]0.2387[/C][C]0.406026[/C][/ROW]
[ROW][C]3[/C][C]0.002516[/C][C]0.0212[/C][C]0.491574[/C][/ROW]
[ROW][C]4[/C][C]0.086828[/C][C]0.7316[/C][C]0.233403[/C][/ROW]
[ROW][C]5[/C][C]-0.096487[/C][C]-0.813[/C][C]0.209464[/C][/ROW]
[ROW][C]6[/C][C]-0.071666[/C][C]-0.6039[/C][C]0.273928[/C][/ROW]
[ROW][C]7[/C][C]-0.005027[/C][C]-0.0424[/C][C]0.483165[/C][/ROW]
[ROW][C]8[/C][C]-0.191028[/C][C]-1.6096[/C][C]0.055958[/C][/ROW]
[ROW][C]9[/C][C]0.098167[/C][C]0.8272[/C][C]0.205457[/C][/ROW]
[ROW][C]10[/C][C]0.007614[/C][C]0.0642[/C][C]0.474513[/C][/ROW]
[ROW][C]11[/C][C]0.143195[/C][C]1.2066[/C][C]0.1158[/C][/ROW]
[ROW][C]12[/C][C]-0.34636[/C][C]-2.9185[/C][C]0.002354[/C][/ROW]
[ROW][C]13[/C][C]-0.078102[/C][C]-0.6581[/C][C]0.256301[/C][/ROW]
[ROW][C]14[/C][C]0.041675[/C][C]0.3512[/C][C]0.363255[/C][/ROW]
[ROW][C]15[/C][C]0.062702[/C][C]0.5283[/C][C]0.299456[/C][/ROW]
[ROW][C]16[/C][C]0.026284[/C][C]0.2215[/C][C]0.412679[/C][/ROW]
[ROW][C]17[/C][C]-0.003662[/C][C]-0.0309[/C][C]0.487736[/C][/ROW]
[ROW][C]18[/C][C]0.096201[/C][C]0.8106[/C][C]0.21015[/C][/ROW]
[ROW][C]19[/C][C]0.015781[/C][C]0.133[/C][C]0.447295[/C][/ROW]
[ROW][C]20[/C][C]-0.095839[/C][C]-0.8076[/C][C]0.211022[/C][/ROW]
[ROW][C]21[/C][C]0.015815[/C][C]0.1333[/C][C]0.447184[/C][/ROW]
[ROW][C]22[/C][C]-0.079117[/C][C]-0.6667[/C][C]0.253578[/C][/ROW]
[ROW][C]23[/C][C]0.126208[/C][C]1.0634[/C][C]0.145592[/C][/ROW]
[ROW][C]24[/C][C]-0.14552[/C][C]-1.2262[/C][C]0.112092[/C][/ROW]
[ROW][C]25[/C][C]-0.108379[/C][C]-0.9132[/C][C]0.18211[/C][/ROW]
[ROW][C]26[/C][C]-0.148349[/C][C]-1.25[/C][C]0.107699[/C][/ROW]
[ROW][C]27[/C][C]0.098523[/C][C]0.8302[/C][C]0.204613[/C][/ROW]
[ROW][C]28[/C][C]-0.050924[/C][C]-0.4291[/C][C]0.334576[/C][/ROW]
[ROW][C]29[/C][C]-0.096701[/C][C]-0.8148[/C][C]0.208952[/C][/ROW]
[ROW][C]30[/C][C]-0.102188[/C][C]-0.861[/C][C]0.196055[/C][/ROW]
[ROW][C]31[/C][C]0.19526[/C][C]1.6453[/C][C]0.052166[/C][/ROW]
[ROW][C]32[/C][C]0.062512[/C][C]0.5267[/C][C]0.300008[/C][/ROW]
[ROW][C]33[/C][C]-0.053705[/C][C]-0.4525[/C][C]0.326134[/C][/ROW]
[ROW][C]34[/C][C]-0.188929[/C][C]-1.5919[/C][C]0.05792[/C][/ROW]
[ROW][C]35[/C][C]0.040829[/C][C]0.344[/C][C]0.36592[/C][/ROW]
[ROW][C]36[/C][C]-0.146682[/C][C]-1.236[/C][C]0.110273[/C][/ROW]
[ROW][C]37[/C][C]0.074043[/C][C]0.6239[/C][C]0.267348[/C][/ROW]
[ROW][C]38[/C][C]-0.007715[/C][C]-0.065[/C][C]0.474175[/C][/ROW]
[ROW][C]39[/C][C]-0.029601[/C][C]-0.2494[/C][C]0.401877[/C][/ROW]
[ROW][C]40[/C][C]-0.046725[/C][C]-0.3937[/C][C]0.347487[/C][/ROW]
[ROW][C]41[/C][C]0.061255[/C][C]0.5161[/C][C]0.303678[/C][/ROW]
[ROW][C]42[/C][C]-0.160646[/C][C]-1.3536[/C][C]0.090075[/C][/ROW]
[ROW][C]43[/C][C]-0.040249[/C][C]-0.3391[/C][C]0.367753[/C][/ROW]
[ROW][C]44[/C][C]-0.093298[/C][C]-0.7861[/C][C]0.217199[/C][/ROW]
[ROW][C]45[/C][C]-0.018905[/C][C]-0.1593[/C][C]0.436945[/C][/ROW]
[ROW][C]46[/C][C]0.004189[/C][C]0.0353[/C][C]0.485972[/C][/ROW]
[ROW][C]47[/C][C]-0.063266[/C][C]-0.5331[/C][C]0.297818[/C][/ROW]
[ROW][C]48[/C][C]-0.025542[/C][C]-0.2152[/C][C]0.415107[/C][/ROW]
[/TABLE]
Source: https://freestatistics.org/blog/index.php?pk=277888&T=2

Globally Unique Identifier (entire table): ba.freestatistics.org/blog/index.php?pk=277888&T=2

As an alternative you can also use a QR Code:  

The GUIDs for individual cells are displayed in the table below:

Partial Autocorrelation Function
Time lag kPACF(k)T-STATP-value
10.3161182.66370.004779
20.0283240.23870.406026
30.0025160.02120.491574
40.0868280.73160.233403
5-0.096487-0.8130.209464
6-0.071666-0.60390.273928
7-0.005027-0.04240.483165
8-0.191028-1.60960.055958
90.0981670.82720.205457
100.0076140.06420.474513
110.1431951.20660.1158
12-0.34636-2.91850.002354
13-0.078102-0.65810.256301
140.0416750.35120.363255
150.0627020.52830.299456
160.0262840.22150.412679
17-0.003662-0.03090.487736
180.0962010.81060.21015
190.0157810.1330.447295
20-0.095839-0.80760.211022
210.0158150.13330.447184
22-0.079117-0.66670.253578
230.1262081.06340.145592
24-0.14552-1.22620.112092
25-0.108379-0.91320.18211
26-0.148349-1.250.107699
270.0985230.83020.204613
28-0.050924-0.42910.334576
29-0.096701-0.81480.208952
30-0.102188-0.8610.196055
310.195261.64530.052166
320.0625120.52670.300008
33-0.053705-0.45250.326134
34-0.188929-1.59190.05792
350.0408290.3440.36592
36-0.146682-1.2360.110273
370.0740430.62390.267348
38-0.007715-0.0650.474175
39-0.029601-0.24940.401877
40-0.046725-0.39370.347487
410.0612550.51610.303678
42-0.160646-1.35360.090075
43-0.040249-0.33910.367753
44-0.093298-0.78610.217199
45-0.018905-0.15930.436945
460.0041890.03530.485972
47-0.063266-0.53310.297818
48-0.025542-0.21520.415107


Parameters (Session):
par1 = 48 ; par2 = 1 ; par3 = 1 ; par4 = 0 ; par5 = 12 ; par6 = White Noise ; par7 = 0.95 ;
Parameters (R input):
par1 = 48 ; par2 = 1 ; par3 = 1 ; par4 = 0 ; par5 = 12 ; par6 = White Noise ; par7 = 0.95 ; par8 = ;
R code (references can be found in the software module):
if (par1 == 'Default') {
par1 = 10*log10(length(x))
} else {
par1 <- as.numeric(par1)
}
par2 <- as.numeric(par2)
par3 <- as.numeric(par3)
par4 <- as.numeric(par4)
par5 <- as.numeric(par5)
if (par6 == 'White Noise') par6 <- 'white' else par6 <- 'ma'
par7 <- as.numeric(par7)
if (par8 != '') par8 <- as.numeric(par8)
ox <- x
if (par8 == '') {
if (par2 == 0) {
x <- log(x)
} else {
x <- (x ^ par2 - 1) / par2
}
} else {
x <- log(x,base=par8)
}
if (par3 > 0) x <- diff(x,lag=1,difference=par3)
if (par4 > 0) x <- diff(x,lag=par5,difference=par4)
bitmap(file='picts.png')
op <- par(mfrow=c(2,1))
plot(ox,type='l',main='Original Time Series',xlab='time',ylab='value')
if (par8=='') {
mytitle <- paste('Working Time Series (lambda=',par2,', d=',par3,', D=',par4,')',sep='')
mysub <- paste('(lambda=',par2,', d=',par3,', D=',par4,', CI=', par7, ', CI type=',par6,')',sep='')
} else {
mytitle <- paste('Working Time Series (base=',par8,', d=',par3,', D=',par4,')',sep='')
mysub <- paste('(base=',par8,', d=',par3,', D=',par4,', CI=', par7, ', CI type=',par6,')',sep='')
}
plot(x,type='l', main=mytitle,xlab='time',ylab='value')
par(op)
dev.off()
bitmap(file='pic1.png')
racf <- acf(x, par1, main='Autocorrelation', xlab='time lag', ylab='ACF', ci.type=par6, ci=par7, sub=mysub)
dev.off()
bitmap(file='pic2.png')
rpacf <- pacf(x,par1,main='Partial Autocorrelation',xlab='lags',ylab='PACF',sub=mysub)
dev.off()
(myacf <- c(racf$acf))
(mypacf <- c(rpacf$acf))
lengthx <- length(x)
sqrtn <- sqrt(lengthx)
load(file='createtable')
a<-table.start()
a<-table.row.start(a)
a<-table.element(a,'Autocorrelation Function',4,TRUE)
a<-table.row.end(a)
a<-table.row.start(a)
a<-table.element(a,'Time lag k',header=TRUE)
a<-table.element(a,hyperlink('basics.htm','ACF(k)','click here for more information about the Autocorrelation Function'),header=TRUE)
a<-table.element(a,'T-STAT',header=TRUE)
a<-table.element(a,'P-value',header=TRUE)
a<-table.row.end(a)
for (i in 2:(par1+1)) {
a<-table.row.start(a)
a<-table.element(a,i-1,header=TRUE)
a<-table.element(a,round(myacf[i],6))
mytstat <- myacf[i]*sqrtn
a<-table.element(a,round(mytstat,4))
a<-table.element(a,round(1-pt(abs(mytstat),lengthx),6))
a<-table.row.end(a)
}
a<-table.end(a)
table.save(a,file='mytable.tab')
a<-table.start()
a<-table.row.start(a)
a<-table.element(a,'Partial Autocorrelation Function',4,TRUE)
a<-table.row.end(a)
a<-table.row.start(a)
a<-table.element(a,'Time lag k',header=TRUE)
a<-table.element(a,hyperlink('basics.htm','PACF(k)','click here for more information about the Partial Autocorrelation Function'),header=TRUE)
a<-table.element(a,'T-STAT',header=TRUE)
a<-table.element(a,'P-value',header=TRUE)
a<-table.row.end(a)
for (i in 1:par1) {
a<-table.row.start(a)
a<-table.element(a,i,header=TRUE)
a<-table.element(a,round(mypacf[i],6))
mytstat <- mypacf[i]*sqrtn
a<-table.element(a,round(mytstat,4))
a<-table.element(a,round(1-pt(abs(mytstat),lengthx),6))
a<-table.row.end(a)
}
a<-table.end(a)
table.save(a,file='mytable1.tab')