Free Statistics

of Irreproducible Research!

Author's title

Author*Unverified author*
R Software Modulerwasp_autocorrelation.wasp
Title produced by software(Partial) Autocorrelation Function
Date of computationWed, 04 Mar 2015 15:13:57 +0000
Cite this page as followsStatistical Computations at FreeStatistics.org, Office for Research Development and Education, URL https://freestatistics.org/blog/index.php?v=date/2015/Mar/04/t14254820647uy89kt8q7zrvhz.htm/, Retrieved Sun, 19 May 2024 13:55:52 +0000
Statistical Computations at FreeStatistics.org, Office for Research Development and Education, URL https://freestatistics.org/blog/index.php?pk=277884, Retrieved Sun, 19 May 2024 13:55:52 +0000
QR Codes:

Original text written by user:
IsPrivate?No (this computation is public)
User-defined keywords
Estimated Impact173
Family? (F = Feedback message, R = changed R code, M = changed R Module, P = changed Parameters, D = changed Data)
-       [(Partial) Autocorrelation Function] [Autocorrelation b...] [2015-03-04 15:13:57] [d41d8cd98f00b204e9800998ecf8427e] [Current]
Feedback Forum

Post a new message
Dataseries X:
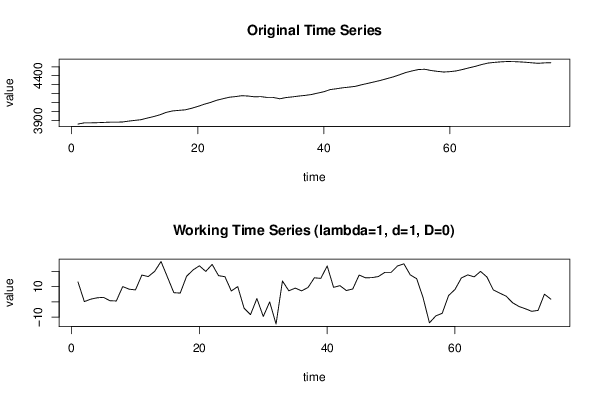
3862.5
3875.7
3875.9
3877.7
3880.4
3883.4
3884.2
3884.8
3894.9
3903.3
3911.2
3928.9
3945.6
3965.7
3992.3
4008.7
4014.8
4020.6
4037.5
4058.5
4082.3
4102.4
4127.1
4144.4
4161
4168.2
4178.3
4174.1
4165.7
4167.9
4158.3
4158.3
4143.7
4157.5
4164.8
4173.9
4181.2
4190.7
4206.6
4222.1
4245.8
4255.4
4266.1
4273.6
4282.1
4299.8
4315.7
4331.7
4348.4
4367.8
4387.2
4410.9
4436
4453.8
4469.1
4472
4458.2
4449
4441.5
4445.7
4453.9
4469.7
4487.5
4504
4524.1
4540.5
4548.4
4554.2
4558
4557.5
4554.5
4550
4543.8
4538.2
4543.3
4545.1


Summary of computational transaction
Raw Inputview raw input (R code)
Raw Outputview raw output of R engine
Computing time1 seconds
R Server'George Udny Yule' @ yule.wessa.net

\begin{tabular}{lllllllll}
\hline
Summary of computational transaction \tabularnewline
Raw Input & view raw input (R code)  \tabularnewline
Raw Output & view raw output of R engine  \tabularnewline
Computing time & 1 seconds \tabularnewline
R Server & 'George Udny Yule' @ yule.wessa.net \tabularnewline
\hline
\end{tabular}
%Source: https://freestatistics.org/blog/index.php?pk=277884&T=0

[TABLE]
[ROW][C]Summary of computational transaction[/C][/ROW]
[ROW][C]Raw Input[/C][C]view raw input (R code) [/C][/ROW]
[ROW][C]Raw Output[/C][C]view raw output of R engine [/C][/ROW]
[ROW][C]Computing time[/C][C]1 seconds[/C][/ROW]
[ROW][C]R Server[/C][C]'George Udny Yule' @ yule.wessa.net[/C][/ROW]
[/TABLE]
Source: https://freestatistics.org/blog/index.php?pk=277884&T=0

Globally Unique Identifier (entire table): ba.freestatistics.org/blog/index.php?pk=277884&T=0

As an alternative you can also use a QR Code:  

The GUIDs for individual cells are displayed in the table below:

Summary of computational transaction
Raw Inputview raw input (R code)
Raw Outputview raw output of R engine
Computing time1 seconds
R Server'George Udny Yule' @ yule.wessa.net


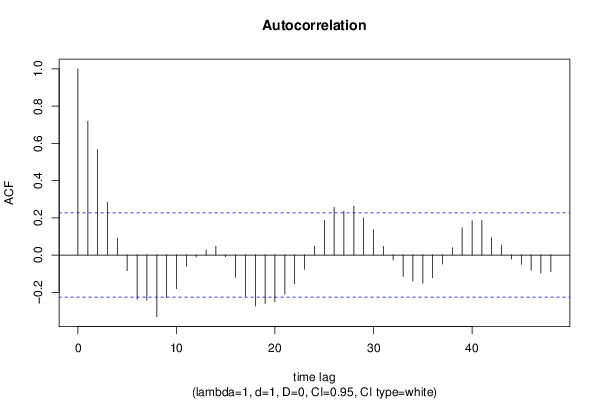
Autocorrelation Function
Time lag kACF(k)T-STATP-value
10.7197186.23290
20.5656894.8993e-06
30.2830332.45110.008285
40.0890240.7710.221573
5-0.084756-0.7340.232617
6-0.236869-2.05130.021863
7-0.242433-2.09950.019567
8-0.330862-2.86530.002701
9-0.228001-1.97450.026001
10-0.180586-1.56390.061023
11-0.060025-0.51980.302357
12-0.010744-0.0930.463059
130.0273740.23710.406627
140.0471650.40850.342049
15-0.008279-0.07170.471516
16-0.119428-1.03430.152164
17-0.220889-1.9130.029785
18-0.273738-2.37060.010164
19-0.260345-2.25470.013537
20-0.251236-2.17580.016361
21-0.209143-1.81120.037055
22-0.153839-1.33230.0934
23-0.076194-0.65990.255683
240.0468350.40560.343095
250.1866161.61610.055132
260.2555372.2130.014969
270.2352892.03770.022556
280.2626942.2750.012882
290.1995871.72850.044009
300.1359721.17760.121349
310.0465890.40350.343874
32-0.026844-0.23250.4084
33-0.115386-0.99930.160438
34-0.139063-1.20430.116127
35-0.151196-1.30940.097198
36-0.121219-1.04980.148594
37-0.048135-0.41690.338985
380.0390820.33850.367982
390.1460931.26520.104857
400.1841461.59470.057487
410.1857891.6090.055911
420.093510.80980.210303
430.0526120.45560.324986
44-0.021665-0.18760.425839
45-0.05089-0.44070.330342
46-0.081901-0.70930.240175
47-0.09654-0.83610.202887
48-0.089084-0.77150.221419

\begin{tabular}{lllllllll}
\hline
Autocorrelation Function \tabularnewline
Time lag k & ACF(k) & T-STAT & P-value \tabularnewline
1 & 0.719718 & 6.2329 & 0 \tabularnewline
2 & 0.565689 & 4.899 & 3e-06 \tabularnewline
3 & 0.283033 & 2.4511 & 0.008285 \tabularnewline
4 & 0.089024 & 0.771 & 0.221573 \tabularnewline
5 & -0.084756 & -0.734 & 0.232617 \tabularnewline
6 & -0.236869 & -2.0513 & 0.021863 \tabularnewline
7 & -0.242433 & -2.0995 & 0.019567 \tabularnewline
8 & -0.330862 & -2.8653 & 0.002701 \tabularnewline
9 & -0.228001 & -1.9745 & 0.026001 \tabularnewline
10 & -0.180586 & -1.5639 & 0.061023 \tabularnewline
11 & -0.060025 & -0.5198 & 0.302357 \tabularnewline
12 & -0.010744 & -0.093 & 0.463059 \tabularnewline
13 & 0.027374 & 0.2371 & 0.406627 \tabularnewline
14 & 0.047165 & 0.4085 & 0.342049 \tabularnewline
15 & -0.008279 & -0.0717 & 0.471516 \tabularnewline
16 & -0.119428 & -1.0343 & 0.152164 \tabularnewline
17 & -0.220889 & -1.913 & 0.029785 \tabularnewline
18 & -0.273738 & -2.3706 & 0.010164 \tabularnewline
19 & -0.260345 & -2.2547 & 0.013537 \tabularnewline
20 & -0.251236 & -2.1758 & 0.016361 \tabularnewline
21 & -0.209143 & -1.8112 & 0.037055 \tabularnewline
22 & -0.153839 & -1.3323 & 0.0934 \tabularnewline
23 & -0.076194 & -0.6599 & 0.255683 \tabularnewline
24 & 0.046835 & 0.4056 & 0.343095 \tabularnewline
25 & 0.186616 & 1.6161 & 0.055132 \tabularnewline
26 & 0.255537 & 2.213 & 0.014969 \tabularnewline
27 & 0.235289 & 2.0377 & 0.022556 \tabularnewline
28 & 0.262694 & 2.275 & 0.012882 \tabularnewline
29 & 0.199587 & 1.7285 & 0.044009 \tabularnewline
30 & 0.135972 & 1.1776 & 0.121349 \tabularnewline
31 & 0.046589 & 0.4035 & 0.343874 \tabularnewline
32 & -0.026844 & -0.2325 & 0.4084 \tabularnewline
33 & -0.115386 & -0.9993 & 0.160438 \tabularnewline
34 & -0.139063 & -1.2043 & 0.116127 \tabularnewline
35 & -0.151196 & -1.3094 & 0.097198 \tabularnewline
36 & -0.121219 & -1.0498 & 0.148594 \tabularnewline
37 & -0.048135 & -0.4169 & 0.338985 \tabularnewline
38 & 0.039082 & 0.3385 & 0.367982 \tabularnewline
39 & 0.146093 & 1.2652 & 0.104857 \tabularnewline
40 & 0.184146 & 1.5947 & 0.057487 \tabularnewline
41 & 0.185789 & 1.609 & 0.055911 \tabularnewline
42 & 0.09351 & 0.8098 & 0.210303 \tabularnewline
43 & 0.052612 & 0.4556 & 0.324986 \tabularnewline
44 & -0.021665 & -0.1876 & 0.425839 \tabularnewline
45 & -0.05089 & -0.4407 & 0.330342 \tabularnewline
46 & -0.081901 & -0.7093 & 0.240175 \tabularnewline
47 & -0.09654 & -0.8361 & 0.202887 \tabularnewline
48 & -0.089084 & -0.7715 & 0.221419 \tabularnewline
\hline
\end{tabular}
%Source: https://freestatistics.org/blog/index.php?pk=277884&T=1

[TABLE]
[ROW][C]Autocorrelation Function[/C][/ROW]
[ROW][C]Time lag k[/C][C]ACF(k)[/C][C]T-STAT[/C][C]P-value[/C][/ROW]
[ROW][C]1[/C][C]0.719718[/C][C]6.2329[/C][C]0[/C][/ROW]
[ROW][C]2[/C][C]0.565689[/C][C]4.899[/C][C]3e-06[/C][/ROW]
[ROW][C]3[/C][C]0.283033[/C][C]2.4511[/C][C]0.008285[/C][/ROW]
[ROW][C]4[/C][C]0.089024[/C][C]0.771[/C][C]0.221573[/C][/ROW]
[ROW][C]5[/C][C]-0.084756[/C][C]-0.734[/C][C]0.232617[/C][/ROW]
[ROW][C]6[/C][C]-0.236869[/C][C]-2.0513[/C][C]0.021863[/C][/ROW]
[ROW][C]7[/C][C]-0.242433[/C][C]-2.0995[/C][C]0.019567[/C][/ROW]
[ROW][C]8[/C][C]-0.330862[/C][C]-2.8653[/C][C]0.002701[/C][/ROW]
[ROW][C]9[/C][C]-0.228001[/C][C]-1.9745[/C][C]0.026001[/C][/ROW]
[ROW][C]10[/C][C]-0.180586[/C][C]-1.5639[/C][C]0.061023[/C][/ROW]
[ROW][C]11[/C][C]-0.060025[/C][C]-0.5198[/C][C]0.302357[/C][/ROW]
[ROW][C]12[/C][C]-0.010744[/C][C]-0.093[/C][C]0.463059[/C][/ROW]
[ROW][C]13[/C][C]0.027374[/C][C]0.2371[/C][C]0.406627[/C][/ROW]
[ROW][C]14[/C][C]0.047165[/C][C]0.4085[/C][C]0.342049[/C][/ROW]
[ROW][C]15[/C][C]-0.008279[/C][C]-0.0717[/C][C]0.471516[/C][/ROW]
[ROW][C]16[/C][C]-0.119428[/C][C]-1.0343[/C][C]0.152164[/C][/ROW]
[ROW][C]17[/C][C]-0.220889[/C][C]-1.913[/C][C]0.029785[/C][/ROW]
[ROW][C]18[/C][C]-0.273738[/C][C]-2.3706[/C][C]0.010164[/C][/ROW]
[ROW][C]19[/C][C]-0.260345[/C][C]-2.2547[/C][C]0.013537[/C][/ROW]
[ROW][C]20[/C][C]-0.251236[/C][C]-2.1758[/C][C]0.016361[/C][/ROW]
[ROW][C]21[/C][C]-0.209143[/C][C]-1.8112[/C][C]0.037055[/C][/ROW]
[ROW][C]22[/C][C]-0.153839[/C][C]-1.3323[/C][C]0.0934[/C][/ROW]
[ROW][C]23[/C][C]-0.076194[/C][C]-0.6599[/C][C]0.255683[/C][/ROW]
[ROW][C]24[/C][C]0.046835[/C][C]0.4056[/C][C]0.343095[/C][/ROW]
[ROW][C]25[/C][C]0.186616[/C][C]1.6161[/C][C]0.055132[/C][/ROW]
[ROW][C]26[/C][C]0.255537[/C][C]2.213[/C][C]0.014969[/C][/ROW]
[ROW][C]27[/C][C]0.235289[/C][C]2.0377[/C][C]0.022556[/C][/ROW]
[ROW][C]28[/C][C]0.262694[/C][C]2.275[/C][C]0.012882[/C][/ROW]
[ROW][C]29[/C][C]0.199587[/C][C]1.7285[/C][C]0.044009[/C][/ROW]
[ROW][C]30[/C][C]0.135972[/C][C]1.1776[/C][C]0.121349[/C][/ROW]
[ROW][C]31[/C][C]0.046589[/C][C]0.4035[/C][C]0.343874[/C][/ROW]
[ROW][C]32[/C][C]-0.026844[/C][C]-0.2325[/C][C]0.4084[/C][/ROW]
[ROW][C]33[/C][C]-0.115386[/C][C]-0.9993[/C][C]0.160438[/C][/ROW]
[ROW][C]34[/C][C]-0.139063[/C][C]-1.2043[/C][C]0.116127[/C][/ROW]
[ROW][C]35[/C][C]-0.151196[/C][C]-1.3094[/C][C]0.097198[/C][/ROW]
[ROW][C]36[/C][C]-0.121219[/C][C]-1.0498[/C][C]0.148594[/C][/ROW]
[ROW][C]37[/C][C]-0.048135[/C][C]-0.4169[/C][C]0.338985[/C][/ROW]
[ROW][C]38[/C][C]0.039082[/C][C]0.3385[/C][C]0.367982[/C][/ROW]
[ROW][C]39[/C][C]0.146093[/C][C]1.2652[/C][C]0.104857[/C][/ROW]
[ROW][C]40[/C][C]0.184146[/C][C]1.5947[/C][C]0.057487[/C][/ROW]
[ROW][C]41[/C][C]0.185789[/C][C]1.609[/C][C]0.055911[/C][/ROW]
[ROW][C]42[/C][C]0.09351[/C][C]0.8098[/C][C]0.210303[/C][/ROW]
[ROW][C]43[/C][C]0.052612[/C][C]0.4556[/C][C]0.324986[/C][/ROW]
[ROW][C]44[/C][C]-0.021665[/C][C]-0.1876[/C][C]0.425839[/C][/ROW]
[ROW][C]45[/C][C]-0.05089[/C][C]-0.4407[/C][C]0.330342[/C][/ROW]
[ROW][C]46[/C][C]-0.081901[/C][C]-0.7093[/C][C]0.240175[/C][/ROW]
[ROW][C]47[/C][C]-0.09654[/C][C]-0.8361[/C][C]0.202887[/C][/ROW]
[ROW][C]48[/C][C]-0.089084[/C][C]-0.7715[/C][C]0.221419[/C][/ROW]
[/TABLE]
Source: https://freestatistics.org/blog/index.php?pk=277884&T=1

Globally Unique Identifier (entire table): ba.freestatistics.org/blog/index.php?pk=277884&T=1

As an alternative you can also use a QR Code:  

The GUIDs for individual cells are displayed in the table below:

Autocorrelation Function
Time lag kACF(k)T-STATP-value
10.7197186.23290
20.5656894.8993e-06
30.2830332.45110.008285
40.0890240.7710.221573
5-0.084756-0.7340.232617
6-0.236869-2.05130.021863
7-0.242433-2.09950.019567
8-0.330862-2.86530.002701
9-0.228001-1.97450.026001
10-0.180586-1.56390.061023
11-0.060025-0.51980.302357
12-0.010744-0.0930.463059
130.0273740.23710.406627
140.0471650.40850.342049
15-0.008279-0.07170.471516
16-0.119428-1.03430.152164
17-0.220889-1.9130.029785
18-0.273738-2.37060.010164
19-0.260345-2.25470.013537
20-0.251236-2.17580.016361
21-0.209143-1.81120.037055
22-0.153839-1.33230.0934
23-0.076194-0.65990.255683
240.0468350.40560.343095
250.1866161.61610.055132
260.2555372.2130.014969
270.2352892.03770.022556
280.2626942.2750.012882
290.1995871.72850.044009
300.1359721.17760.121349
310.0465890.40350.343874
32-0.026844-0.23250.4084
33-0.115386-0.99930.160438
34-0.139063-1.20430.116127
35-0.151196-1.30940.097198
36-0.121219-1.04980.148594
37-0.048135-0.41690.338985
380.0390820.33850.367982
390.1460931.26520.104857
400.1841461.59470.057487
410.1857891.6090.055911
420.093510.80980.210303
430.0526120.45560.324986
44-0.021665-0.18760.425839
45-0.05089-0.44070.330342
46-0.081901-0.70930.240175
47-0.09654-0.83610.202887
48-0.089084-0.77150.221419


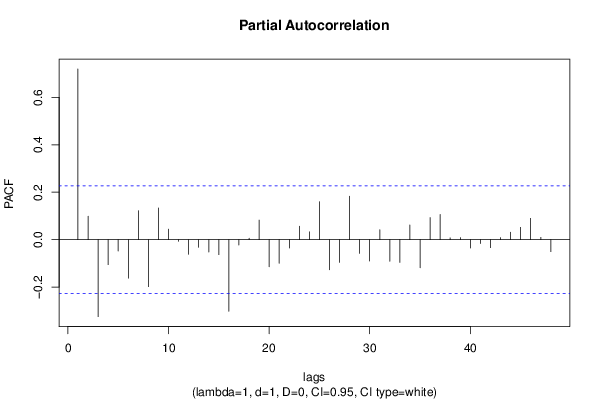
Partial Autocorrelation Function
Time lag kPACF(k)T-STATP-value
10.7197186.23290
20.0989520.85690.197102
3-0.324824-2.81310.003131
4-0.105348-0.91230.182256
5-0.047735-0.41340.340248
6-0.162347-1.4060.081931
70.1218461.05520.147357
8-0.198383-1.7180.044957
90.1332741.15420.126043
100.0441640.38250.351595
11-0.006903-0.05980.476243
12-0.061471-0.53240.298026
13-0.032359-0.28020.390032
14-0.051994-0.45030.326903
15-0.063381-0.54890.292355
16-0.302224-2.61730.005357
17-0.022435-0.19430.423235
180.0059820.05180.479409
190.0822660.71240.2392
20-0.114471-0.99130.162352
21-0.099816-0.86440.195053
22-0.03549-0.30740.379713
230.05660.49020.312723
240.0326780.2830.388977
250.1593921.38040.085786
26-0.127351-1.10290.1368
27-0.096008-0.83150.204179
280.1829431.58430.058663
29-0.058166-0.50370.307963
30-0.090378-0.78270.218136
310.0419850.36360.358589
32-0.091192-0.78970.216082
33-0.095983-0.83120.204239
340.0620180.53710.296397
35-0.118397-1.02530.154248
360.0928520.80410.211934
370.105770.9160.181303
380.0074830.06480.47425
390.0083110.0720.471406
40-0.035019-0.30330.381261
41-0.016266-0.14090.444175
42-0.033679-0.29170.385672
430.0085540.07410.470573
440.0312540.27070.393696
450.0518020.44860.3275
460.0895910.77590.22013
470.0096630.08370.466765
48-0.050683-0.43890.330987

\begin{tabular}{lllllllll}
\hline
Partial Autocorrelation Function \tabularnewline
Time lag k & PACF(k) & T-STAT & P-value \tabularnewline
1 & 0.719718 & 6.2329 & 0 \tabularnewline
2 & 0.098952 & 0.8569 & 0.197102 \tabularnewline
3 & -0.324824 & -2.8131 & 0.003131 \tabularnewline
4 & -0.105348 & -0.9123 & 0.182256 \tabularnewline
5 & -0.047735 & -0.4134 & 0.340248 \tabularnewline
6 & -0.162347 & -1.406 & 0.081931 \tabularnewline
7 & 0.121846 & 1.0552 & 0.147357 \tabularnewline
8 & -0.198383 & -1.718 & 0.044957 \tabularnewline
9 & 0.133274 & 1.1542 & 0.126043 \tabularnewline
10 & 0.044164 & 0.3825 & 0.351595 \tabularnewline
11 & -0.006903 & -0.0598 & 0.476243 \tabularnewline
12 & -0.061471 & -0.5324 & 0.298026 \tabularnewline
13 & -0.032359 & -0.2802 & 0.390032 \tabularnewline
14 & -0.051994 & -0.4503 & 0.326903 \tabularnewline
15 & -0.063381 & -0.5489 & 0.292355 \tabularnewline
16 & -0.302224 & -2.6173 & 0.005357 \tabularnewline
17 & -0.022435 & -0.1943 & 0.423235 \tabularnewline
18 & 0.005982 & 0.0518 & 0.479409 \tabularnewline
19 & 0.082266 & 0.7124 & 0.2392 \tabularnewline
20 & -0.114471 & -0.9913 & 0.162352 \tabularnewline
21 & -0.099816 & -0.8644 & 0.195053 \tabularnewline
22 & -0.03549 & -0.3074 & 0.379713 \tabularnewline
23 & 0.0566 & 0.4902 & 0.312723 \tabularnewline
24 & 0.032678 & 0.283 & 0.388977 \tabularnewline
25 & 0.159392 & 1.3804 & 0.085786 \tabularnewline
26 & -0.127351 & -1.1029 & 0.1368 \tabularnewline
27 & -0.096008 & -0.8315 & 0.204179 \tabularnewline
28 & 0.182943 & 1.5843 & 0.058663 \tabularnewline
29 & -0.058166 & -0.5037 & 0.307963 \tabularnewline
30 & -0.090378 & -0.7827 & 0.218136 \tabularnewline
31 & 0.041985 & 0.3636 & 0.358589 \tabularnewline
32 & -0.091192 & -0.7897 & 0.216082 \tabularnewline
33 & -0.095983 & -0.8312 & 0.204239 \tabularnewline
34 & 0.062018 & 0.5371 & 0.296397 \tabularnewline
35 & -0.118397 & -1.0253 & 0.154248 \tabularnewline
36 & 0.092852 & 0.8041 & 0.211934 \tabularnewline
37 & 0.10577 & 0.916 & 0.181303 \tabularnewline
38 & 0.007483 & 0.0648 & 0.47425 \tabularnewline
39 & 0.008311 & 0.072 & 0.471406 \tabularnewline
40 & -0.035019 & -0.3033 & 0.381261 \tabularnewline
41 & -0.016266 & -0.1409 & 0.444175 \tabularnewline
42 & -0.033679 & -0.2917 & 0.385672 \tabularnewline
43 & 0.008554 & 0.0741 & 0.470573 \tabularnewline
44 & 0.031254 & 0.2707 & 0.393696 \tabularnewline
45 & 0.051802 & 0.4486 & 0.3275 \tabularnewline
46 & 0.089591 & 0.7759 & 0.22013 \tabularnewline
47 & 0.009663 & 0.0837 & 0.466765 \tabularnewline
48 & -0.050683 & -0.4389 & 0.330987 \tabularnewline
\hline
\end{tabular}
%Source: https://freestatistics.org/blog/index.php?pk=277884&T=2

[TABLE]
[ROW][C]Partial Autocorrelation Function[/C][/ROW]
[ROW][C]Time lag k[/C][C]PACF(k)[/C][C]T-STAT[/C][C]P-value[/C][/ROW]
[ROW][C]1[/C][C]0.719718[/C][C]6.2329[/C][C]0[/C][/ROW]
[ROW][C]2[/C][C]0.098952[/C][C]0.8569[/C][C]0.197102[/C][/ROW]
[ROW][C]3[/C][C]-0.324824[/C][C]-2.8131[/C][C]0.003131[/C][/ROW]
[ROW][C]4[/C][C]-0.105348[/C][C]-0.9123[/C][C]0.182256[/C][/ROW]
[ROW][C]5[/C][C]-0.047735[/C][C]-0.4134[/C][C]0.340248[/C][/ROW]
[ROW][C]6[/C][C]-0.162347[/C][C]-1.406[/C][C]0.081931[/C][/ROW]
[ROW][C]7[/C][C]0.121846[/C][C]1.0552[/C][C]0.147357[/C][/ROW]
[ROW][C]8[/C][C]-0.198383[/C][C]-1.718[/C][C]0.044957[/C][/ROW]
[ROW][C]9[/C][C]0.133274[/C][C]1.1542[/C][C]0.126043[/C][/ROW]
[ROW][C]10[/C][C]0.044164[/C][C]0.3825[/C][C]0.351595[/C][/ROW]
[ROW][C]11[/C][C]-0.006903[/C][C]-0.0598[/C][C]0.476243[/C][/ROW]
[ROW][C]12[/C][C]-0.061471[/C][C]-0.5324[/C][C]0.298026[/C][/ROW]
[ROW][C]13[/C][C]-0.032359[/C][C]-0.2802[/C][C]0.390032[/C][/ROW]
[ROW][C]14[/C][C]-0.051994[/C][C]-0.4503[/C][C]0.326903[/C][/ROW]
[ROW][C]15[/C][C]-0.063381[/C][C]-0.5489[/C][C]0.292355[/C][/ROW]
[ROW][C]16[/C][C]-0.302224[/C][C]-2.6173[/C][C]0.005357[/C][/ROW]
[ROW][C]17[/C][C]-0.022435[/C][C]-0.1943[/C][C]0.423235[/C][/ROW]
[ROW][C]18[/C][C]0.005982[/C][C]0.0518[/C][C]0.479409[/C][/ROW]
[ROW][C]19[/C][C]0.082266[/C][C]0.7124[/C][C]0.2392[/C][/ROW]
[ROW][C]20[/C][C]-0.114471[/C][C]-0.9913[/C][C]0.162352[/C][/ROW]
[ROW][C]21[/C][C]-0.099816[/C][C]-0.8644[/C][C]0.195053[/C][/ROW]
[ROW][C]22[/C][C]-0.03549[/C][C]-0.3074[/C][C]0.379713[/C][/ROW]
[ROW][C]23[/C][C]0.0566[/C][C]0.4902[/C][C]0.312723[/C][/ROW]
[ROW][C]24[/C][C]0.032678[/C][C]0.283[/C][C]0.388977[/C][/ROW]
[ROW][C]25[/C][C]0.159392[/C][C]1.3804[/C][C]0.085786[/C][/ROW]
[ROW][C]26[/C][C]-0.127351[/C][C]-1.1029[/C][C]0.1368[/C][/ROW]
[ROW][C]27[/C][C]-0.096008[/C][C]-0.8315[/C][C]0.204179[/C][/ROW]
[ROW][C]28[/C][C]0.182943[/C][C]1.5843[/C][C]0.058663[/C][/ROW]
[ROW][C]29[/C][C]-0.058166[/C][C]-0.5037[/C][C]0.307963[/C][/ROW]
[ROW][C]30[/C][C]-0.090378[/C][C]-0.7827[/C][C]0.218136[/C][/ROW]
[ROW][C]31[/C][C]0.041985[/C][C]0.3636[/C][C]0.358589[/C][/ROW]
[ROW][C]32[/C][C]-0.091192[/C][C]-0.7897[/C][C]0.216082[/C][/ROW]
[ROW][C]33[/C][C]-0.095983[/C][C]-0.8312[/C][C]0.204239[/C][/ROW]
[ROW][C]34[/C][C]0.062018[/C][C]0.5371[/C][C]0.296397[/C][/ROW]
[ROW][C]35[/C][C]-0.118397[/C][C]-1.0253[/C][C]0.154248[/C][/ROW]
[ROW][C]36[/C][C]0.092852[/C][C]0.8041[/C][C]0.211934[/C][/ROW]
[ROW][C]37[/C][C]0.10577[/C][C]0.916[/C][C]0.181303[/C][/ROW]
[ROW][C]38[/C][C]0.007483[/C][C]0.0648[/C][C]0.47425[/C][/ROW]
[ROW][C]39[/C][C]0.008311[/C][C]0.072[/C][C]0.471406[/C][/ROW]
[ROW][C]40[/C][C]-0.035019[/C][C]-0.3033[/C][C]0.381261[/C][/ROW]
[ROW][C]41[/C][C]-0.016266[/C][C]-0.1409[/C][C]0.444175[/C][/ROW]
[ROW][C]42[/C][C]-0.033679[/C][C]-0.2917[/C][C]0.385672[/C][/ROW]
[ROW][C]43[/C][C]0.008554[/C][C]0.0741[/C][C]0.470573[/C][/ROW]
[ROW][C]44[/C][C]0.031254[/C][C]0.2707[/C][C]0.393696[/C][/ROW]
[ROW][C]45[/C][C]0.051802[/C][C]0.4486[/C][C]0.3275[/C][/ROW]
[ROW][C]46[/C][C]0.089591[/C][C]0.7759[/C][C]0.22013[/C][/ROW]
[ROW][C]47[/C][C]0.009663[/C][C]0.0837[/C][C]0.466765[/C][/ROW]
[ROW][C]48[/C][C]-0.050683[/C][C]-0.4389[/C][C]0.330987[/C][/ROW]
[/TABLE]
Source: https://freestatistics.org/blog/index.php?pk=277884&T=2

Globally Unique Identifier (entire table): ba.freestatistics.org/blog/index.php?pk=277884&T=2

As an alternative you can also use a QR Code:  

The GUIDs for individual cells are displayed in the table below:

Partial Autocorrelation Function
Time lag kPACF(k)T-STATP-value
10.7197186.23290
20.0989520.85690.197102
3-0.324824-2.81310.003131
4-0.105348-0.91230.182256
5-0.047735-0.41340.340248
6-0.162347-1.4060.081931
70.1218461.05520.147357
8-0.198383-1.7180.044957
90.1332741.15420.126043
100.0441640.38250.351595
11-0.006903-0.05980.476243
12-0.061471-0.53240.298026
13-0.032359-0.28020.390032
14-0.051994-0.45030.326903
15-0.063381-0.54890.292355
16-0.302224-2.61730.005357
17-0.022435-0.19430.423235
180.0059820.05180.479409
190.0822660.71240.2392
20-0.114471-0.99130.162352
21-0.099816-0.86440.195053
22-0.03549-0.30740.379713
230.05660.49020.312723
240.0326780.2830.388977
250.1593921.38040.085786
26-0.127351-1.10290.1368
27-0.096008-0.83150.204179
280.1829431.58430.058663
29-0.058166-0.50370.307963
30-0.090378-0.78270.218136
310.0419850.36360.358589
32-0.091192-0.78970.216082
33-0.095983-0.83120.204239
340.0620180.53710.296397
35-0.118397-1.02530.154248
360.0928520.80410.211934
370.105770.9160.181303
380.0074830.06480.47425
390.0083110.0720.471406
40-0.035019-0.30330.381261
41-0.016266-0.14090.444175
42-0.033679-0.29170.385672
430.0085540.07410.470573
440.0312540.27070.393696
450.0518020.44860.3275
460.0895910.77590.22013
470.0096630.08370.466765
48-0.050683-0.43890.330987


Parameters (Session):
par1 = 48 ; par2 = 1 ; par3 = 1 ; par4 = 0 ; par5 = 12 ; par6 = White Noise ; par7 = 0.95 ;
Parameters (R input):
par1 = 48 ; par2 = 1 ; par3 = 1 ; par4 = 0 ; par5 = 12 ; par6 = White Noise ; par7 = 0.95 ; par8 = ;
R code (references can be found in the software module):
par8 <- ''
par7 <- '0.95'
par6 <- 'White Noise'
par5 <- '12'
par4 <- '0'
par3 <- '0'
par2 <- '1'
par1 <- '48'
if (par1 == 'Default') {
par1 = 10*log10(length(x))
} else {
par1 <- as.numeric(par1)
}
par2 <- as.numeric(par2)
par3 <- as.numeric(par3)
par4 <- as.numeric(par4)
par5 <- as.numeric(par5)
if (par6 == 'White Noise') par6 <- 'white' else par6 <- 'ma'
par7 <- as.numeric(par7)
if (par8 != '') par8 <- as.numeric(par8)
ox <- x
if (par8 == '') {
if (par2 == 0) {
x <- log(x)
} else {
x <- (x ^ par2 - 1) / par2
}
} else {
x <- log(x,base=par8)
}
if (par3 > 0) x <- diff(x,lag=1,difference=par3)
if (par4 > 0) x <- diff(x,lag=par5,difference=par4)
bitmap(file='picts.png')
op <- par(mfrow=c(2,1))
plot(ox,type='l',main='Original Time Series',xlab='time',ylab='value')
if (par8=='') {
mytitle <- paste('Working Time Series (lambda=',par2,', d=',par3,', D=',par4,')',sep='')
mysub <- paste('(lambda=',par2,', d=',par3,', D=',par4,', CI=', par7, ', CI type=',par6,')',sep='')
} else {
mytitle <- paste('Working Time Series (base=',par8,', d=',par3,', D=',par4,')',sep='')
mysub <- paste('(base=',par8,', d=',par3,', D=',par4,', CI=', par7, ', CI type=',par6,')',sep='')
}
plot(x,type='l', main=mytitle,xlab='time',ylab='value')
par(op)
dev.off()
bitmap(file='pic1.png')
racf <- acf(x, par1, main='Autocorrelation', xlab='time lag', ylab='ACF', ci.type=par6, ci=par7, sub=mysub)
dev.off()
bitmap(file='pic2.png')
rpacf <- pacf(x,par1,main='Partial Autocorrelation',xlab='lags',ylab='PACF',sub=mysub)
dev.off()
(myacf <- c(racf$acf))
(mypacf <- c(rpacf$acf))
lengthx <- length(x)
sqrtn <- sqrt(lengthx)
load(file='createtable')
a<-table.start()
a<-table.row.start(a)
a<-table.element(a,'Autocorrelation Function',4,TRUE)
a<-table.row.end(a)
a<-table.row.start(a)
a<-table.element(a,'Time lag k',header=TRUE)
a<-table.element(a,hyperlink('basics.htm','ACF(k)','click here for more information about the Autocorrelation Function'),header=TRUE)
a<-table.element(a,'T-STAT',header=TRUE)
a<-table.element(a,'P-value',header=TRUE)
a<-table.row.end(a)
for (i in 2:(par1+1)) {
a<-table.row.start(a)
a<-table.element(a,i-1,header=TRUE)
a<-table.element(a,round(myacf[i],6))
mytstat <- myacf[i]*sqrtn
a<-table.element(a,round(mytstat,4))
a<-table.element(a,round(1-pt(abs(mytstat),lengthx),6))
a<-table.row.end(a)
}
a<-table.end(a)
table.save(a,file='mytable.tab')
a<-table.start()
a<-table.row.start(a)
a<-table.element(a,'Partial Autocorrelation Function',4,TRUE)
a<-table.row.end(a)
a<-table.row.start(a)
a<-table.element(a,'Time lag k',header=TRUE)
a<-table.element(a,hyperlink('basics.htm','PACF(k)','click here for more information about the Partial Autocorrelation Function'),header=TRUE)
a<-table.element(a,'T-STAT',header=TRUE)
a<-table.element(a,'P-value',header=TRUE)
a<-table.row.end(a)
for (i in 1:par1) {
a<-table.row.start(a)
a<-table.element(a,i,header=TRUE)
a<-table.element(a,round(mypacf[i],6))
mytstat <- mypacf[i]*sqrtn
a<-table.element(a,round(mytstat,4))
a<-table.element(a,round(1-pt(abs(mytstat),lengthx),6))
a<-table.row.end(a)
}
a<-table.end(a)
table.save(a,file='mytable1.tab')