Free Statistics

of Irreproducible Research!

Author's title

Author*Unverified author*
R Software Modulerwasp_autocorrelation.wasp
Title produced by software(Partial) Autocorrelation Function
Date of computationWed, 04 Mar 2015 15:09:05 +0000
Cite this page as followsStatistical Computations at FreeStatistics.org, Office for Research Development and Education, URL https://freestatistics.org/blog/index.php?v=date/2015/Mar/04/t14254818257h5ysai5goqdxxt.htm/, Retrieved Sun, 19 May 2024 15:57:09 +0000
Statistical Computations at FreeStatistics.org, Office for Research Development and Education, URL https://freestatistics.org/blog/index.php?pk=277883, Retrieved Sun, 19 May 2024 15:57:09 +0000
QR Codes:

Original text written by user:
IsPrivate?No (this computation is public)
User-defined keywords
Estimated Impact161
Family? (F = Feedback message, R = changed R code, M = changed R Module, P = changed Parameters, D = changed Data)
-       [(Partial) Autocorrelation Function] [Autocorrelation b...] [2015-03-04 15:09:05] [cab9dc260884be88f444bea8f40c034b] [Current]
Feedback Forum

Post a new message
Dataseries X:
3862,5
3875,7
3875,9
3877,7
3880,4
3883,4
3884,2
3884,8
3894,9
3903,3
3911,2
3928,9
3945,6
3965,7
3992,3
4008,7
4014,8
4020,6
4037,5
4058,5
4082,3
4102,4
4127,1
4144,4
4161
4168,2
4178,3
4174,1
4165,7
4167,9
4158,3
4158,3
4143,7
4157,5
4164,8
4173,9
4181,2
4190,7
4206,6
4222,1
4245,8
4255,4
4266,1
4273,6
4282,1
4299,8
4315,7
4331,7
4348,4
4367,8
4387,2
4410,9
4436
4453,8
4469,1
4472
4458,2
4449
4441,5
4445,7
4453,9
4469,7
4487,5
4504
4524,1
4540,5
4548,4
4554,2
4558
4557,5
4554,5
4550
4543,8
4538,2
4543,3
4545,1


Summary of computational transaction
Raw Inputview raw input (R code)
Raw Outputview raw output of R engine
Computing time2 seconds
R Server'Herman Ole Andreas Wold' @ wold.wessa.net

\begin{tabular}{lllllllll}
\hline
Summary of computational transaction \tabularnewline
Raw Input & view raw input (R code)  \tabularnewline
Raw Output & view raw output of R engine  \tabularnewline
Computing time & 2 seconds \tabularnewline
R Server & 'Herman Ole Andreas Wold' @ wold.wessa.net \tabularnewline
\hline
\end{tabular}
%Source: https://freestatistics.org/blog/index.php?pk=277883&T=0

[TABLE]
[ROW][C]Summary of computational transaction[/C][/ROW]
[ROW][C]Raw Input[/C][C]view raw input (R code) [/C][/ROW]
[ROW][C]Raw Output[/C][C]view raw output of R engine [/C][/ROW]
[ROW][C]Computing time[/C][C]2 seconds[/C][/ROW]
[ROW][C]R Server[/C][C]'Herman Ole Andreas Wold' @ wold.wessa.net[/C][/ROW]
[/TABLE]
Source: https://freestatistics.org/blog/index.php?pk=277883&T=0

Globally Unique Identifier (entire table): ba.freestatistics.org/blog/index.php?pk=277883&T=0

As an alternative you can also use a QR Code:  

The GUIDs for individual cells are displayed in the table below:

Summary of computational transaction
Raw Inputview raw input (R code)
Raw Outputview raw output of R engine
Computing time2 seconds
R Server'Herman Ole Andreas Wold' @ wold.wessa.net


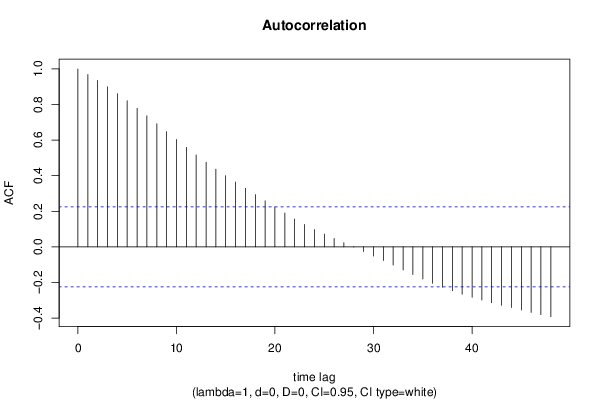
Autocorrelation Function
Time lag kACF(k)T-STATP-value
10.9681428.44010
20.9347538.1490
30.8991397.83850
40.8610997.50690
50.8210077.15740
60.7793296.7940
70.7362336.41830
80.6918916.03180
90.6477275.64680
100.6035595.26171e-06
110.5594314.8773e-06
120.5167884.50531.2e-05
130.4758024.14794.3e-05
140.4365033.80530.000142
150.399663.48420.000411
160.3642983.17590.001079
170.329052.86860.002667
180.2937612.56090.00621
190.2586582.25490.013508
200.2239781.95260.027275
210.1896061.6530.051233
220.1564741.36410.088279
230.1259771.09820.137782
240.0975230.85020.198946
250.0714710.62310.267551
260.0466020.40630.342844
270.0227670.19850.4216
28-0.001345-0.01170.495337
29-0.026404-0.23020.409282
30-0.051315-0.44740.327946
31-0.077098-0.67210.251771
32-0.102506-0.89360.187172
33-0.129562-1.12950.131121
34-0.155442-1.35510.089698
35-0.180445-1.57310.059927
36-0.204442-1.78230.039348
37-0.226487-1.97450.025981
38-0.247123-2.15440.01719
39-0.265819-2.31740.011589
40-0.283286-2.46960.007884
41-0.298939-2.60610.005508
42-0.313959-2.7370.003858
43-0.328192-2.86110.002725
44-0.341318-2.97550.00196
45-0.355402-3.09830.001364
46-0.368328-3.2110.00097
47-0.38098-3.32130.00069
48-0.39236-3.42050.000504

\begin{tabular}{lllllllll}
\hline
Autocorrelation Function \tabularnewline
Time lag k & ACF(k) & T-STAT & P-value \tabularnewline
1 & 0.968142 & 8.4401 & 0 \tabularnewline
2 & 0.934753 & 8.149 & 0 \tabularnewline
3 & 0.899139 & 7.8385 & 0 \tabularnewline
4 & 0.861099 & 7.5069 & 0 \tabularnewline
5 & 0.821007 & 7.1574 & 0 \tabularnewline
6 & 0.779329 & 6.794 & 0 \tabularnewline
7 & 0.736233 & 6.4183 & 0 \tabularnewline
8 & 0.691891 & 6.0318 & 0 \tabularnewline
9 & 0.647727 & 5.6468 & 0 \tabularnewline
10 & 0.603559 & 5.2617 & 1e-06 \tabularnewline
11 & 0.559431 & 4.877 & 3e-06 \tabularnewline
12 & 0.516788 & 4.5053 & 1.2e-05 \tabularnewline
13 & 0.475802 & 4.1479 & 4.3e-05 \tabularnewline
14 & 0.436503 & 3.8053 & 0.000142 \tabularnewline
15 & 0.39966 & 3.4842 & 0.000411 \tabularnewline
16 & 0.364298 & 3.1759 & 0.001079 \tabularnewline
17 & 0.32905 & 2.8686 & 0.002667 \tabularnewline
18 & 0.293761 & 2.5609 & 0.00621 \tabularnewline
19 & 0.258658 & 2.2549 & 0.013508 \tabularnewline
20 & 0.223978 & 1.9526 & 0.027275 \tabularnewline
21 & 0.189606 & 1.653 & 0.051233 \tabularnewline
22 & 0.156474 & 1.3641 & 0.088279 \tabularnewline
23 & 0.125977 & 1.0982 & 0.137782 \tabularnewline
24 & 0.097523 & 0.8502 & 0.198946 \tabularnewline
25 & 0.071471 & 0.6231 & 0.267551 \tabularnewline
26 & 0.046602 & 0.4063 & 0.342844 \tabularnewline
27 & 0.022767 & 0.1985 & 0.4216 \tabularnewline
28 & -0.001345 & -0.0117 & 0.495337 \tabularnewline
29 & -0.026404 & -0.2302 & 0.409282 \tabularnewline
30 & -0.051315 & -0.4474 & 0.327946 \tabularnewline
31 & -0.077098 & -0.6721 & 0.251771 \tabularnewline
32 & -0.102506 & -0.8936 & 0.187172 \tabularnewline
33 & -0.129562 & -1.1295 & 0.131121 \tabularnewline
34 & -0.155442 & -1.3551 & 0.089698 \tabularnewline
35 & -0.180445 & -1.5731 & 0.059927 \tabularnewline
36 & -0.204442 & -1.7823 & 0.039348 \tabularnewline
37 & -0.226487 & -1.9745 & 0.025981 \tabularnewline
38 & -0.247123 & -2.1544 & 0.01719 \tabularnewline
39 & -0.265819 & -2.3174 & 0.011589 \tabularnewline
40 & -0.283286 & -2.4696 & 0.007884 \tabularnewline
41 & -0.298939 & -2.6061 & 0.005508 \tabularnewline
42 & -0.313959 & -2.737 & 0.003858 \tabularnewline
43 & -0.328192 & -2.8611 & 0.002725 \tabularnewline
44 & -0.341318 & -2.9755 & 0.00196 \tabularnewline
45 & -0.355402 & -3.0983 & 0.001364 \tabularnewline
46 & -0.368328 & -3.211 & 0.00097 \tabularnewline
47 & -0.38098 & -3.3213 & 0.00069 \tabularnewline
48 & -0.39236 & -3.4205 & 0.000504 \tabularnewline
\hline
\end{tabular}
%Source: https://freestatistics.org/blog/index.php?pk=277883&T=1

[TABLE]
[ROW][C]Autocorrelation Function[/C][/ROW]
[ROW][C]Time lag k[/C][C]ACF(k)[/C][C]T-STAT[/C][C]P-value[/C][/ROW]
[ROW][C]1[/C][C]0.968142[/C][C]8.4401[/C][C]0[/C][/ROW]
[ROW][C]2[/C][C]0.934753[/C][C]8.149[/C][C]0[/C][/ROW]
[ROW][C]3[/C][C]0.899139[/C][C]7.8385[/C][C]0[/C][/ROW]
[ROW][C]4[/C][C]0.861099[/C][C]7.5069[/C][C]0[/C][/ROW]
[ROW][C]5[/C][C]0.821007[/C][C]7.1574[/C][C]0[/C][/ROW]
[ROW][C]6[/C][C]0.779329[/C][C]6.794[/C][C]0[/C][/ROW]
[ROW][C]7[/C][C]0.736233[/C][C]6.4183[/C][C]0[/C][/ROW]
[ROW][C]8[/C][C]0.691891[/C][C]6.0318[/C][C]0[/C][/ROW]
[ROW][C]9[/C][C]0.647727[/C][C]5.6468[/C][C]0[/C][/ROW]
[ROW][C]10[/C][C]0.603559[/C][C]5.2617[/C][C]1e-06[/C][/ROW]
[ROW][C]11[/C][C]0.559431[/C][C]4.877[/C][C]3e-06[/C][/ROW]
[ROW][C]12[/C][C]0.516788[/C][C]4.5053[/C][C]1.2e-05[/C][/ROW]
[ROW][C]13[/C][C]0.475802[/C][C]4.1479[/C][C]4.3e-05[/C][/ROW]
[ROW][C]14[/C][C]0.436503[/C][C]3.8053[/C][C]0.000142[/C][/ROW]
[ROW][C]15[/C][C]0.39966[/C][C]3.4842[/C][C]0.000411[/C][/ROW]
[ROW][C]16[/C][C]0.364298[/C][C]3.1759[/C][C]0.001079[/C][/ROW]
[ROW][C]17[/C][C]0.32905[/C][C]2.8686[/C][C]0.002667[/C][/ROW]
[ROW][C]18[/C][C]0.293761[/C][C]2.5609[/C][C]0.00621[/C][/ROW]
[ROW][C]19[/C][C]0.258658[/C][C]2.2549[/C][C]0.013508[/C][/ROW]
[ROW][C]20[/C][C]0.223978[/C][C]1.9526[/C][C]0.027275[/C][/ROW]
[ROW][C]21[/C][C]0.189606[/C][C]1.653[/C][C]0.051233[/C][/ROW]
[ROW][C]22[/C][C]0.156474[/C][C]1.3641[/C][C]0.088279[/C][/ROW]
[ROW][C]23[/C][C]0.125977[/C][C]1.0982[/C][C]0.137782[/C][/ROW]
[ROW][C]24[/C][C]0.097523[/C][C]0.8502[/C][C]0.198946[/C][/ROW]
[ROW][C]25[/C][C]0.071471[/C][C]0.6231[/C][C]0.267551[/C][/ROW]
[ROW][C]26[/C][C]0.046602[/C][C]0.4063[/C][C]0.342844[/C][/ROW]
[ROW][C]27[/C][C]0.022767[/C][C]0.1985[/C][C]0.4216[/C][/ROW]
[ROW][C]28[/C][C]-0.001345[/C][C]-0.0117[/C][C]0.495337[/C][/ROW]
[ROW][C]29[/C][C]-0.026404[/C][C]-0.2302[/C][C]0.409282[/C][/ROW]
[ROW][C]30[/C][C]-0.051315[/C][C]-0.4474[/C][C]0.327946[/C][/ROW]
[ROW][C]31[/C][C]-0.077098[/C][C]-0.6721[/C][C]0.251771[/C][/ROW]
[ROW][C]32[/C][C]-0.102506[/C][C]-0.8936[/C][C]0.187172[/C][/ROW]
[ROW][C]33[/C][C]-0.129562[/C][C]-1.1295[/C][C]0.131121[/C][/ROW]
[ROW][C]34[/C][C]-0.155442[/C][C]-1.3551[/C][C]0.089698[/C][/ROW]
[ROW][C]35[/C][C]-0.180445[/C][C]-1.5731[/C][C]0.059927[/C][/ROW]
[ROW][C]36[/C][C]-0.204442[/C][C]-1.7823[/C][C]0.039348[/C][/ROW]
[ROW][C]37[/C][C]-0.226487[/C][C]-1.9745[/C][C]0.025981[/C][/ROW]
[ROW][C]38[/C][C]-0.247123[/C][C]-2.1544[/C][C]0.01719[/C][/ROW]
[ROW][C]39[/C][C]-0.265819[/C][C]-2.3174[/C][C]0.011589[/C][/ROW]
[ROW][C]40[/C][C]-0.283286[/C][C]-2.4696[/C][C]0.007884[/C][/ROW]
[ROW][C]41[/C][C]-0.298939[/C][C]-2.6061[/C][C]0.005508[/C][/ROW]
[ROW][C]42[/C][C]-0.313959[/C][C]-2.737[/C][C]0.003858[/C][/ROW]
[ROW][C]43[/C][C]-0.328192[/C][C]-2.8611[/C][C]0.002725[/C][/ROW]
[ROW][C]44[/C][C]-0.341318[/C][C]-2.9755[/C][C]0.00196[/C][/ROW]
[ROW][C]45[/C][C]-0.355402[/C][C]-3.0983[/C][C]0.001364[/C][/ROW]
[ROW][C]46[/C][C]-0.368328[/C][C]-3.211[/C][C]0.00097[/C][/ROW]
[ROW][C]47[/C][C]-0.38098[/C][C]-3.3213[/C][C]0.00069[/C][/ROW]
[ROW][C]48[/C][C]-0.39236[/C][C]-3.4205[/C][C]0.000504[/C][/ROW]
[/TABLE]
Source: https://freestatistics.org/blog/index.php?pk=277883&T=1

Globally Unique Identifier (entire table): ba.freestatistics.org/blog/index.php?pk=277883&T=1

As an alternative you can also use a QR Code:  

The GUIDs for individual cells are displayed in the table below:

Autocorrelation Function
Time lag kACF(k)T-STATP-value
10.9681428.44010
20.9347538.1490
30.8991397.83850
40.8610997.50690
50.8210077.15740
60.7793296.7940
70.7362336.41830
80.6918916.03180
90.6477275.64680
100.6035595.26171e-06
110.5594314.8773e-06
120.5167884.50531.2e-05
130.4758024.14794.3e-05
140.4365033.80530.000142
150.399663.48420.000411
160.3642983.17590.001079
170.329052.86860.002667
180.2937612.56090.00621
190.2586582.25490.013508
200.2239781.95260.027275
210.1896061.6530.051233
220.1564741.36410.088279
230.1259771.09820.137782
240.0975230.85020.198946
250.0714710.62310.267551
260.0466020.40630.342844
270.0227670.19850.4216
28-0.001345-0.01170.495337
29-0.026404-0.23020.409282
30-0.051315-0.44740.327946
31-0.077098-0.67210.251771
32-0.102506-0.89360.187172
33-0.129562-1.12950.131121
34-0.155442-1.35510.089698
35-0.180445-1.57310.059927
36-0.204442-1.78230.039348
37-0.226487-1.97450.025981
38-0.247123-2.15440.01719
39-0.265819-2.31740.011589
40-0.283286-2.46960.007884
41-0.298939-2.60610.005508
42-0.313959-2.7370.003858
43-0.328192-2.86110.002725
44-0.341318-2.97550.00196
45-0.355402-3.09830.001364
46-0.368328-3.2110.00097
47-0.38098-3.32130.00069
48-0.39236-3.42050.000504


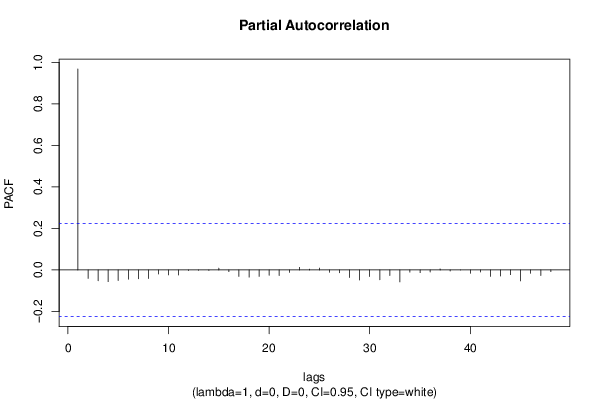
Partial Autocorrelation Function
Time lag kPACF(k)T-STATP-value
10.9681428.44010
2-0.040583-0.35380.362235
3-0.052257-0.45560.325
4-0.056038-0.48850.313293
5-0.050728-0.44220.329787
6-0.044034-0.38390.35107
7-0.042345-0.36920.356519
8-0.040956-0.3570.361023
9-0.019366-0.16880.43319
10-0.023564-0.20540.418893
11-0.024574-0.21420.41547
12-0.002962-0.02580.489732
13-0.001317-0.01150.495434
14-0.002179-0.0190.492448
150.0087750.07650.469612
16-0.008059-0.07030.472088
17-0.031003-0.27030.393841
18-0.034418-0.30.382479
19-0.030846-0.26890.394363
20-0.025811-0.2250.411284
21-0.026924-0.23470.40753
22-0.011552-0.10070.460023
230.0126490.11030.456243
240.0039610.03450.48627
250.0090080.07850.468808
26-0.010833-0.09440.462505
27-0.013845-0.12070.452125
28-0.036105-0.31480.376903
29-0.048337-0.42140.33733
30-0.031112-0.27120.393476
31-0.046821-0.40820.342145
32-0.026478-0.23080.409033
33-0.057565-0.50180.308615
34-0.010428-0.09090.463902
35-0.012827-0.11180.455629
36-0.009803-0.08550.46606
370.005170.04510.482084
38-0.004944-0.04310.482868
39-0.000288-0.00250.499002
40-0.015807-0.13780.44538
41-0.010229-0.08920.464588
42-0.03093-0.26960.394083
43-0.029115-0.25380.400161
44-0.022637-0.19730.422043
45-0.052636-0.45890.323819
46-0.015701-0.13690.445745
47-0.027087-0.23610.406981
48-0.007877-0.06870.472716

\begin{tabular}{lllllllll}
\hline
Partial Autocorrelation Function \tabularnewline
Time lag k & PACF(k) & T-STAT & P-value \tabularnewline
1 & 0.968142 & 8.4401 & 0 \tabularnewline
2 & -0.040583 & -0.3538 & 0.362235 \tabularnewline
3 & -0.052257 & -0.4556 & 0.325 \tabularnewline
4 & -0.056038 & -0.4885 & 0.313293 \tabularnewline
5 & -0.050728 & -0.4422 & 0.329787 \tabularnewline
6 & -0.044034 & -0.3839 & 0.35107 \tabularnewline
7 & -0.042345 & -0.3692 & 0.356519 \tabularnewline
8 & -0.040956 & -0.357 & 0.361023 \tabularnewline
9 & -0.019366 & -0.1688 & 0.43319 \tabularnewline
10 & -0.023564 & -0.2054 & 0.418893 \tabularnewline
11 & -0.024574 & -0.2142 & 0.41547 \tabularnewline
12 & -0.002962 & -0.0258 & 0.489732 \tabularnewline
13 & -0.001317 & -0.0115 & 0.495434 \tabularnewline
14 & -0.002179 & -0.019 & 0.492448 \tabularnewline
15 & 0.008775 & 0.0765 & 0.469612 \tabularnewline
16 & -0.008059 & -0.0703 & 0.472088 \tabularnewline
17 & -0.031003 & -0.2703 & 0.393841 \tabularnewline
18 & -0.034418 & -0.3 & 0.382479 \tabularnewline
19 & -0.030846 & -0.2689 & 0.394363 \tabularnewline
20 & -0.025811 & -0.225 & 0.411284 \tabularnewline
21 & -0.026924 & -0.2347 & 0.40753 \tabularnewline
22 & -0.011552 & -0.1007 & 0.460023 \tabularnewline
23 & 0.012649 & 0.1103 & 0.456243 \tabularnewline
24 & 0.003961 & 0.0345 & 0.48627 \tabularnewline
25 & 0.009008 & 0.0785 & 0.468808 \tabularnewline
26 & -0.010833 & -0.0944 & 0.462505 \tabularnewline
27 & -0.013845 & -0.1207 & 0.452125 \tabularnewline
28 & -0.036105 & -0.3148 & 0.376903 \tabularnewline
29 & -0.048337 & -0.4214 & 0.33733 \tabularnewline
30 & -0.031112 & -0.2712 & 0.393476 \tabularnewline
31 & -0.046821 & -0.4082 & 0.342145 \tabularnewline
32 & -0.026478 & -0.2308 & 0.409033 \tabularnewline
33 & -0.057565 & -0.5018 & 0.308615 \tabularnewline
34 & -0.010428 & -0.0909 & 0.463902 \tabularnewline
35 & -0.012827 & -0.1118 & 0.455629 \tabularnewline
36 & -0.009803 & -0.0855 & 0.46606 \tabularnewline
37 & 0.00517 & 0.0451 & 0.482084 \tabularnewline
38 & -0.004944 & -0.0431 & 0.482868 \tabularnewline
39 & -0.000288 & -0.0025 & 0.499002 \tabularnewline
40 & -0.015807 & -0.1378 & 0.44538 \tabularnewline
41 & -0.010229 & -0.0892 & 0.464588 \tabularnewline
42 & -0.03093 & -0.2696 & 0.394083 \tabularnewline
43 & -0.029115 & -0.2538 & 0.400161 \tabularnewline
44 & -0.022637 & -0.1973 & 0.422043 \tabularnewline
45 & -0.052636 & -0.4589 & 0.323819 \tabularnewline
46 & -0.015701 & -0.1369 & 0.445745 \tabularnewline
47 & -0.027087 & -0.2361 & 0.406981 \tabularnewline
48 & -0.007877 & -0.0687 & 0.472716 \tabularnewline
\hline
\end{tabular}
%Source: https://freestatistics.org/blog/index.php?pk=277883&T=2

[TABLE]
[ROW][C]Partial Autocorrelation Function[/C][/ROW]
[ROW][C]Time lag k[/C][C]PACF(k)[/C][C]T-STAT[/C][C]P-value[/C][/ROW]
[ROW][C]1[/C][C]0.968142[/C][C]8.4401[/C][C]0[/C][/ROW]
[ROW][C]2[/C][C]-0.040583[/C][C]-0.3538[/C][C]0.362235[/C][/ROW]
[ROW][C]3[/C][C]-0.052257[/C][C]-0.4556[/C][C]0.325[/C][/ROW]
[ROW][C]4[/C][C]-0.056038[/C][C]-0.4885[/C][C]0.313293[/C][/ROW]
[ROW][C]5[/C][C]-0.050728[/C][C]-0.4422[/C][C]0.329787[/C][/ROW]
[ROW][C]6[/C][C]-0.044034[/C][C]-0.3839[/C][C]0.35107[/C][/ROW]
[ROW][C]7[/C][C]-0.042345[/C][C]-0.3692[/C][C]0.356519[/C][/ROW]
[ROW][C]8[/C][C]-0.040956[/C][C]-0.357[/C][C]0.361023[/C][/ROW]
[ROW][C]9[/C][C]-0.019366[/C][C]-0.1688[/C][C]0.43319[/C][/ROW]
[ROW][C]10[/C][C]-0.023564[/C][C]-0.2054[/C][C]0.418893[/C][/ROW]
[ROW][C]11[/C][C]-0.024574[/C][C]-0.2142[/C][C]0.41547[/C][/ROW]
[ROW][C]12[/C][C]-0.002962[/C][C]-0.0258[/C][C]0.489732[/C][/ROW]
[ROW][C]13[/C][C]-0.001317[/C][C]-0.0115[/C][C]0.495434[/C][/ROW]
[ROW][C]14[/C][C]-0.002179[/C][C]-0.019[/C][C]0.492448[/C][/ROW]
[ROW][C]15[/C][C]0.008775[/C][C]0.0765[/C][C]0.469612[/C][/ROW]
[ROW][C]16[/C][C]-0.008059[/C][C]-0.0703[/C][C]0.472088[/C][/ROW]
[ROW][C]17[/C][C]-0.031003[/C][C]-0.2703[/C][C]0.393841[/C][/ROW]
[ROW][C]18[/C][C]-0.034418[/C][C]-0.3[/C][C]0.382479[/C][/ROW]
[ROW][C]19[/C][C]-0.030846[/C][C]-0.2689[/C][C]0.394363[/C][/ROW]
[ROW][C]20[/C][C]-0.025811[/C][C]-0.225[/C][C]0.411284[/C][/ROW]
[ROW][C]21[/C][C]-0.026924[/C][C]-0.2347[/C][C]0.40753[/C][/ROW]
[ROW][C]22[/C][C]-0.011552[/C][C]-0.1007[/C][C]0.460023[/C][/ROW]
[ROW][C]23[/C][C]0.012649[/C][C]0.1103[/C][C]0.456243[/C][/ROW]
[ROW][C]24[/C][C]0.003961[/C][C]0.0345[/C][C]0.48627[/C][/ROW]
[ROW][C]25[/C][C]0.009008[/C][C]0.0785[/C][C]0.468808[/C][/ROW]
[ROW][C]26[/C][C]-0.010833[/C][C]-0.0944[/C][C]0.462505[/C][/ROW]
[ROW][C]27[/C][C]-0.013845[/C][C]-0.1207[/C][C]0.452125[/C][/ROW]
[ROW][C]28[/C][C]-0.036105[/C][C]-0.3148[/C][C]0.376903[/C][/ROW]
[ROW][C]29[/C][C]-0.048337[/C][C]-0.4214[/C][C]0.33733[/C][/ROW]
[ROW][C]30[/C][C]-0.031112[/C][C]-0.2712[/C][C]0.393476[/C][/ROW]
[ROW][C]31[/C][C]-0.046821[/C][C]-0.4082[/C][C]0.342145[/C][/ROW]
[ROW][C]32[/C][C]-0.026478[/C][C]-0.2308[/C][C]0.409033[/C][/ROW]
[ROW][C]33[/C][C]-0.057565[/C][C]-0.5018[/C][C]0.308615[/C][/ROW]
[ROW][C]34[/C][C]-0.010428[/C][C]-0.0909[/C][C]0.463902[/C][/ROW]
[ROW][C]35[/C][C]-0.012827[/C][C]-0.1118[/C][C]0.455629[/C][/ROW]
[ROW][C]36[/C][C]-0.009803[/C][C]-0.0855[/C][C]0.46606[/C][/ROW]
[ROW][C]37[/C][C]0.00517[/C][C]0.0451[/C][C]0.482084[/C][/ROW]
[ROW][C]38[/C][C]-0.004944[/C][C]-0.0431[/C][C]0.482868[/C][/ROW]
[ROW][C]39[/C][C]-0.000288[/C][C]-0.0025[/C][C]0.499002[/C][/ROW]
[ROW][C]40[/C][C]-0.015807[/C][C]-0.1378[/C][C]0.44538[/C][/ROW]
[ROW][C]41[/C][C]-0.010229[/C][C]-0.0892[/C][C]0.464588[/C][/ROW]
[ROW][C]42[/C][C]-0.03093[/C][C]-0.2696[/C][C]0.394083[/C][/ROW]
[ROW][C]43[/C][C]-0.029115[/C][C]-0.2538[/C][C]0.400161[/C][/ROW]
[ROW][C]44[/C][C]-0.022637[/C][C]-0.1973[/C][C]0.422043[/C][/ROW]
[ROW][C]45[/C][C]-0.052636[/C][C]-0.4589[/C][C]0.323819[/C][/ROW]
[ROW][C]46[/C][C]-0.015701[/C][C]-0.1369[/C][C]0.445745[/C][/ROW]
[ROW][C]47[/C][C]-0.027087[/C][C]-0.2361[/C][C]0.406981[/C][/ROW]
[ROW][C]48[/C][C]-0.007877[/C][C]-0.0687[/C][C]0.472716[/C][/ROW]
[/TABLE]
Source: https://freestatistics.org/blog/index.php?pk=277883&T=2

Globally Unique Identifier (entire table): ba.freestatistics.org/blog/index.php?pk=277883&T=2

As an alternative you can also use a QR Code:  

The GUIDs for individual cells are displayed in the table below:

Partial Autocorrelation Function
Time lag kPACF(k)T-STATP-value
10.9681428.44010
2-0.040583-0.35380.362235
3-0.052257-0.45560.325
4-0.056038-0.48850.313293
5-0.050728-0.44220.329787
6-0.044034-0.38390.35107
7-0.042345-0.36920.356519
8-0.040956-0.3570.361023
9-0.019366-0.16880.43319
10-0.023564-0.20540.418893
11-0.024574-0.21420.41547
12-0.002962-0.02580.489732
13-0.001317-0.01150.495434
14-0.002179-0.0190.492448
150.0087750.07650.469612
16-0.008059-0.07030.472088
17-0.031003-0.27030.393841
18-0.034418-0.30.382479
19-0.030846-0.26890.394363
20-0.025811-0.2250.411284
21-0.026924-0.23470.40753
22-0.011552-0.10070.460023
230.0126490.11030.456243
240.0039610.03450.48627
250.0090080.07850.468808
26-0.010833-0.09440.462505
27-0.013845-0.12070.452125
28-0.036105-0.31480.376903
29-0.048337-0.42140.33733
30-0.031112-0.27120.393476
31-0.046821-0.40820.342145
32-0.026478-0.23080.409033
33-0.057565-0.50180.308615
34-0.010428-0.09090.463902
35-0.012827-0.11180.455629
36-0.009803-0.08550.46606
370.005170.04510.482084
38-0.004944-0.04310.482868
39-0.000288-0.00250.499002
40-0.015807-0.13780.44538
41-0.010229-0.08920.464588
42-0.03093-0.26960.394083
43-0.029115-0.25380.400161
44-0.022637-0.19730.422043
45-0.052636-0.45890.323819
46-0.015701-0.13690.445745
47-0.027087-0.23610.406981
48-0.007877-0.06870.472716


Parameters (Session):
par1 = 48 ; par2 = 1 ; par3 = 0 ; par4 = 0 ; par5 = 12 ; par6 = White Noise ; par7 = 0.95 ;
Parameters (R input):
par1 = 48 ; par2 = 1 ; par3 = 0 ; par4 = 0 ; par5 = 12 ; par6 = White Noise ; par7 = 0.95 ; par8 = ;
R code (references can be found in the software module):
if (par1 == 'Default') {
par1 = 10*log10(length(x))
} else {
par1 <- as.numeric(par1)
}
par2 <- as.numeric(par2)
par3 <- as.numeric(par3)
par4 <- as.numeric(par4)
par5 <- as.numeric(par5)
if (par6 == 'White Noise') par6 <- 'white' else par6 <- 'ma'
par7 <- as.numeric(par7)
if (par8 != '') par8 <- as.numeric(par8)
ox <- x
if (par8 == '') {
if (par2 == 0) {
x <- log(x)
} else {
x <- (x ^ par2 - 1) / par2
}
} else {
x <- log(x,base=par8)
}
if (par3 > 0) x <- diff(x,lag=1,difference=par3)
if (par4 > 0) x <- diff(x,lag=par5,difference=par4)
bitmap(file='picts.png')
op <- par(mfrow=c(2,1))
plot(ox,type='l',main='Original Time Series',xlab='time',ylab='value')
if (par8=='') {
mytitle <- paste('Working Time Series (lambda=',par2,', d=',par3,', D=',par4,')',sep='')
mysub <- paste('(lambda=',par2,', d=',par3,', D=',par4,', CI=', par7, ', CI type=',par6,')',sep='')
} else {
mytitle <- paste('Working Time Series (base=',par8,', d=',par3,', D=',par4,')',sep='')
mysub <- paste('(base=',par8,', d=',par3,', D=',par4,', CI=', par7, ', CI type=',par6,')',sep='')
}
plot(x,type='l', main=mytitle,xlab='time',ylab='value')
par(op)
dev.off()
bitmap(file='pic1.png')
racf <- acf(x, par1, main='Autocorrelation', xlab='time lag', ylab='ACF', ci.type=par6, ci=par7, sub=mysub)
dev.off()
bitmap(file='pic2.png')
rpacf <- pacf(x,par1,main='Partial Autocorrelation',xlab='lags',ylab='PACF',sub=mysub)
dev.off()
(myacf <- c(racf$acf))
(mypacf <- c(rpacf$acf))
lengthx <- length(x)
sqrtn <- sqrt(lengthx)
load(file='createtable')
a<-table.start()
a<-table.row.start(a)
a<-table.element(a,'Autocorrelation Function',4,TRUE)
a<-table.row.end(a)
a<-table.row.start(a)
a<-table.element(a,'Time lag k',header=TRUE)
a<-table.element(a,hyperlink('basics.htm','ACF(k)','click here for more information about the Autocorrelation Function'),header=TRUE)
a<-table.element(a,'T-STAT',header=TRUE)
a<-table.element(a,'P-value',header=TRUE)
a<-table.row.end(a)
for (i in 2:(par1+1)) {
a<-table.row.start(a)
a<-table.element(a,i-1,header=TRUE)
a<-table.element(a,round(myacf[i],6))
mytstat <- myacf[i]*sqrtn
a<-table.element(a,round(mytstat,4))
a<-table.element(a,round(1-pt(abs(mytstat),lengthx),6))
a<-table.row.end(a)
}
a<-table.end(a)
table.save(a,file='mytable.tab')
a<-table.start()
a<-table.row.start(a)
a<-table.element(a,'Partial Autocorrelation Function',4,TRUE)
a<-table.row.end(a)
a<-table.row.start(a)
a<-table.element(a,'Time lag k',header=TRUE)
a<-table.element(a,hyperlink('basics.htm','PACF(k)','click here for more information about the Partial Autocorrelation Function'),header=TRUE)
a<-table.element(a,'T-STAT',header=TRUE)
a<-table.element(a,'P-value',header=TRUE)
a<-table.row.end(a)
for (i in 1:par1) {
a<-table.row.start(a)
a<-table.element(a,i,header=TRUE)
a<-table.element(a,round(mypacf[i],6))
mytstat <- mypacf[i]*sqrtn
a<-table.element(a,round(mytstat,4))
a<-table.element(a,round(1-pt(abs(mytstat),lengthx),6))
a<-table.row.end(a)
}
a<-table.end(a)
table.save(a,file='mytable1.tab')