Free Statistics

of Irreproducible Research!

Author's title

Author*Unverified author*
R Software Modulerwasp_autocorrelation.wasp
Title produced by software(Partial) Autocorrelation Function
Date of computationWed, 04 Mar 2015 11:25:13 +0000
Cite this page as followsStatistical Computations at FreeStatistics.org, Office for Research Development and Education, URL https://freestatistics.org/blog/index.php?v=date/2015/Mar/04/t1425468479rjk4b89s6986s29.htm/, Retrieved Sun, 19 May 2024 13:34:58 +0000
Statistical Computations at FreeStatistics.org, Office for Research Development and Education, URL https://freestatistics.org/blog/index.php?pk=277869, Retrieved Sun, 19 May 2024 13:34:58 +0000
QR Codes:

Original text written by user:
IsPrivate?No (this computation is public)
User-defined keywords
Estimated Impact167
Family? (F = Feedback message, R = changed R code, M = changed R Module, P = changed Parameters, D = changed Data)
-       [(Partial) Autocorrelation Function] [] [2015-03-04 11:25:13] [36d9fcfacb97c24df6a506fb08c7a09a] [Current]
Feedback Forum

Post a new message
Dataseries X:
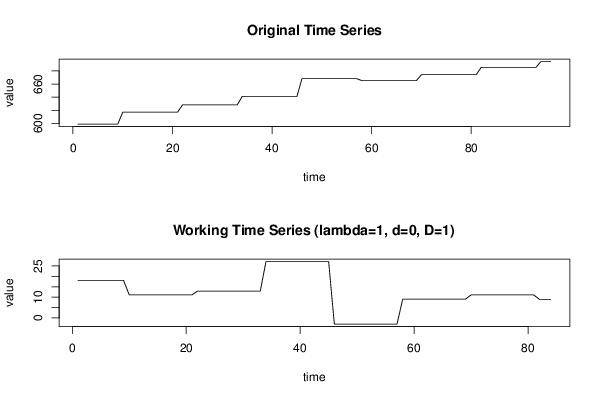
599
599
599
599
599
599
599
599
599
617,06
617,06
617,06
617,06
617,06
617,06
617,06
617,06
617,06
617,06
617,06
617,06
628,18
628,18
628,18
628,18
628,18
628,18
628,18
628,18
628,18
628,18
628,18
628,18
641,08
641,08
641,08
641,08
641,08
641,08
641,08
641,08
641,08
641,08
641,08
641,08
668,21
668,21
668,21
668,21
668,21
668,21
668,21
668,21
668,21
668,21
668,21
668,21
665,27
665,27
665,27
665,27
665,27
665,27
665,27
665,27
665,27
665,27
665,27
665,27
674,3
674,3
674,3
674,3
674,3
674,3
674,3
674,3
674,3
674,3
674,3
674,3
685,34
685,34
685,34
685,34
685,34
685,34
685,34
685,34
685,34
685,34
685,34
685,34
694,3
694,3
694,3


Summary of computational transaction
Raw Inputview raw input (R code)
Raw Outputview raw output of R engine
Computing time2 seconds
R Server'Gertrude Mary Cox' @ cox.wessa.net

\begin{tabular}{lllllllll}
\hline
Summary of computational transaction \tabularnewline
Raw Input & view raw input (R code)  \tabularnewline
Raw Output & view raw output of R engine  \tabularnewline
Computing time & 2 seconds \tabularnewline
R Server & 'Gertrude Mary Cox' @ cox.wessa.net \tabularnewline
\hline
\end{tabular}
%Source: https://freestatistics.org/blog/index.php?pk=277869&T=0

[TABLE]
[ROW][C]Summary of computational transaction[/C][/ROW]
[ROW][C]Raw Input[/C][C]view raw input (R code) [/C][/ROW]
[ROW][C]Raw Output[/C][C]view raw output of R engine [/C][/ROW]
[ROW][C]Computing time[/C][C]2 seconds[/C][/ROW]
[ROW][C]R Server[/C][C]'Gertrude Mary Cox' @ cox.wessa.net[/C][/ROW]
[/TABLE]
Source: https://freestatistics.org/blog/index.php?pk=277869&T=0

Globally Unique Identifier (entire table): ba.freestatistics.org/blog/index.php?pk=277869&T=0

As an alternative you can also use a QR Code:  

The GUIDs for individual cells are displayed in the table below:

Summary of computational transaction
Raw Inputview raw input (R code)
Raw Outputview raw output of R engine
Computing time2 seconds
R Server'Gertrude Mary Cox' @ cox.wessa.net


Autocorrelation Function
Time lag kACF(k)T-STATP-value
10.88558.11570
20.7717.06630
30.65656.01690
40.5430724.97732e-06
50.4296443.93778.5e-05
60.3162152.89820.002393
70.2027871.85860.033295
80.0893580.8190.207557
9-0.02407-0.22060.412967
10-0.130405-1.19520.11769
11-0.23674-2.16980.016425
12-0.343074-3.14430.001151
13-0.32187-2.950.002058
14-0.300666-2.75560.003591
15-0.279462-2.56130.006107
16-0.259293-2.37650.009877
17-0.239124-2.19160.015588
18-0.218955-2.00680.023996
19-0.198787-1.82190.036014
20-0.178618-1.63710.05268
21-0.158449-1.45220.075084
22-0.1401-1.2840.10133
23-0.12175-1.11590.133832
24-0.103401-0.94770.173004
25-0.073685-0.67530.250659
26-0.043969-0.4030.343992
27-0.014253-0.13060.44819
280.0092970.08520.466149
290.0328470.3010.382061
300.0563970.51690.303296
310.0799470.73270.232882
320.1034970.94860.172781
330.1270471.16440.123778
340.1360521.24690.107943
350.1450571.32950.093646
360.1540621.4120.080822
370.1088160.99730.160737
380.0635710.58260.280849
390.0183250.1680.433511
40-0.011431-0.10480.458407
41-0.041186-0.37750.353385
42-0.070942-0.65020.25867
43-0.100698-0.92290.179348
44-0.130454-1.19560.117602
45-0.16021-1.46830.072872
46-0.15923-1.45940.074097
47-0.15825-1.45040.075338
48-0.15727-1.44140.076595

\begin{tabular}{lllllllll}
\hline
Autocorrelation Function \tabularnewline
Time lag k & ACF(k) & T-STAT & P-value \tabularnewline
1 & 0.8855 & 8.1157 & 0 \tabularnewline
2 & 0.771 & 7.0663 & 0 \tabularnewline
3 & 0.6565 & 6.0169 & 0 \tabularnewline
4 & 0.543072 & 4.9773 & 2e-06 \tabularnewline
5 & 0.429644 & 3.9377 & 8.5e-05 \tabularnewline
6 & 0.316215 & 2.8982 & 0.002393 \tabularnewline
7 & 0.202787 & 1.8586 & 0.033295 \tabularnewline
8 & 0.089358 & 0.819 & 0.207557 \tabularnewline
9 & -0.02407 & -0.2206 & 0.412967 \tabularnewline
10 & -0.130405 & -1.1952 & 0.11769 \tabularnewline
11 & -0.23674 & -2.1698 & 0.016425 \tabularnewline
12 & -0.343074 & -3.1443 & 0.001151 \tabularnewline
13 & -0.32187 & -2.95 & 0.002058 \tabularnewline
14 & -0.300666 & -2.7556 & 0.003591 \tabularnewline
15 & -0.279462 & -2.5613 & 0.006107 \tabularnewline
16 & -0.259293 & -2.3765 & 0.009877 \tabularnewline
17 & -0.239124 & -2.1916 & 0.015588 \tabularnewline
18 & -0.218955 & -2.0068 & 0.023996 \tabularnewline
19 & -0.198787 & -1.8219 & 0.036014 \tabularnewline
20 & -0.178618 & -1.6371 & 0.05268 \tabularnewline
21 & -0.158449 & -1.4522 & 0.075084 \tabularnewline
22 & -0.1401 & -1.284 & 0.10133 \tabularnewline
23 & -0.12175 & -1.1159 & 0.133832 \tabularnewline
24 & -0.103401 & -0.9477 & 0.173004 \tabularnewline
25 & -0.073685 & -0.6753 & 0.250659 \tabularnewline
26 & -0.043969 & -0.403 & 0.343992 \tabularnewline
27 & -0.014253 & -0.1306 & 0.44819 \tabularnewline
28 & 0.009297 & 0.0852 & 0.466149 \tabularnewline
29 & 0.032847 & 0.301 & 0.382061 \tabularnewline
30 & 0.056397 & 0.5169 & 0.303296 \tabularnewline
31 & 0.079947 & 0.7327 & 0.232882 \tabularnewline
32 & 0.103497 & 0.9486 & 0.172781 \tabularnewline
33 & 0.127047 & 1.1644 & 0.123778 \tabularnewline
34 & 0.136052 & 1.2469 & 0.107943 \tabularnewline
35 & 0.145057 & 1.3295 & 0.093646 \tabularnewline
36 & 0.154062 & 1.412 & 0.080822 \tabularnewline
37 & 0.108816 & 0.9973 & 0.160737 \tabularnewline
38 & 0.063571 & 0.5826 & 0.280849 \tabularnewline
39 & 0.018325 & 0.168 & 0.433511 \tabularnewline
40 & -0.011431 & -0.1048 & 0.458407 \tabularnewline
41 & -0.041186 & -0.3775 & 0.353385 \tabularnewline
42 & -0.070942 & -0.6502 & 0.25867 \tabularnewline
43 & -0.100698 & -0.9229 & 0.179348 \tabularnewline
44 & -0.130454 & -1.1956 & 0.117602 \tabularnewline
45 & -0.16021 & -1.4683 & 0.072872 \tabularnewline
46 & -0.15923 & -1.4594 & 0.074097 \tabularnewline
47 & -0.15825 & -1.4504 & 0.075338 \tabularnewline
48 & -0.15727 & -1.4414 & 0.076595 \tabularnewline
\hline
\end{tabular}
%Source: https://freestatistics.org/blog/index.php?pk=277869&T=1

[TABLE]
[ROW][C]Autocorrelation Function[/C][/ROW]
[ROW][C]Time lag k[/C][C]ACF(k)[/C][C]T-STAT[/C][C]P-value[/C][/ROW]
[ROW][C]1[/C][C]0.8855[/C][C]8.1157[/C][C]0[/C][/ROW]
[ROW][C]2[/C][C]0.771[/C][C]7.0663[/C][C]0[/C][/ROW]
[ROW][C]3[/C][C]0.6565[/C][C]6.0169[/C][C]0[/C][/ROW]
[ROW][C]4[/C][C]0.543072[/C][C]4.9773[/C][C]2e-06[/C][/ROW]
[ROW][C]5[/C][C]0.429644[/C][C]3.9377[/C][C]8.5e-05[/C][/ROW]
[ROW][C]6[/C][C]0.316215[/C][C]2.8982[/C][C]0.002393[/C][/ROW]
[ROW][C]7[/C][C]0.202787[/C][C]1.8586[/C][C]0.033295[/C][/ROW]
[ROW][C]8[/C][C]0.089358[/C][C]0.819[/C][C]0.207557[/C][/ROW]
[ROW][C]9[/C][C]-0.02407[/C][C]-0.2206[/C][C]0.412967[/C][/ROW]
[ROW][C]10[/C][C]-0.130405[/C][C]-1.1952[/C][C]0.11769[/C][/ROW]
[ROW][C]11[/C][C]-0.23674[/C][C]-2.1698[/C][C]0.016425[/C][/ROW]
[ROW][C]12[/C][C]-0.343074[/C][C]-3.1443[/C][C]0.001151[/C][/ROW]
[ROW][C]13[/C][C]-0.32187[/C][C]-2.95[/C][C]0.002058[/C][/ROW]
[ROW][C]14[/C][C]-0.300666[/C][C]-2.7556[/C][C]0.003591[/C][/ROW]
[ROW][C]15[/C][C]-0.279462[/C][C]-2.5613[/C][C]0.006107[/C][/ROW]
[ROW][C]16[/C][C]-0.259293[/C][C]-2.3765[/C][C]0.009877[/C][/ROW]
[ROW][C]17[/C][C]-0.239124[/C][C]-2.1916[/C][C]0.015588[/C][/ROW]
[ROW][C]18[/C][C]-0.218955[/C][C]-2.0068[/C][C]0.023996[/C][/ROW]
[ROW][C]19[/C][C]-0.198787[/C][C]-1.8219[/C][C]0.036014[/C][/ROW]
[ROW][C]20[/C][C]-0.178618[/C][C]-1.6371[/C][C]0.05268[/C][/ROW]
[ROW][C]21[/C][C]-0.158449[/C][C]-1.4522[/C][C]0.075084[/C][/ROW]
[ROW][C]22[/C][C]-0.1401[/C][C]-1.284[/C][C]0.10133[/C][/ROW]
[ROW][C]23[/C][C]-0.12175[/C][C]-1.1159[/C][C]0.133832[/C][/ROW]
[ROW][C]24[/C][C]-0.103401[/C][C]-0.9477[/C][C]0.173004[/C][/ROW]
[ROW][C]25[/C][C]-0.073685[/C][C]-0.6753[/C][C]0.250659[/C][/ROW]
[ROW][C]26[/C][C]-0.043969[/C][C]-0.403[/C][C]0.343992[/C][/ROW]
[ROW][C]27[/C][C]-0.014253[/C][C]-0.1306[/C][C]0.44819[/C][/ROW]
[ROW][C]28[/C][C]0.009297[/C][C]0.0852[/C][C]0.466149[/C][/ROW]
[ROW][C]29[/C][C]0.032847[/C][C]0.301[/C][C]0.382061[/C][/ROW]
[ROW][C]30[/C][C]0.056397[/C][C]0.5169[/C][C]0.303296[/C][/ROW]
[ROW][C]31[/C][C]0.079947[/C][C]0.7327[/C][C]0.232882[/C][/ROW]
[ROW][C]32[/C][C]0.103497[/C][C]0.9486[/C][C]0.172781[/C][/ROW]
[ROW][C]33[/C][C]0.127047[/C][C]1.1644[/C][C]0.123778[/C][/ROW]
[ROW][C]34[/C][C]0.136052[/C][C]1.2469[/C][C]0.107943[/C][/ROW]
[ROW][C]35[/C][C]0.145057[/C][C]1.3295[/C][C]0.093646[/C][/ROW]
[ROW][C]36[/C][C]0.154062[/C][C]1.412[/C][C]0.080822[/C][/ROW]
[ROW][C]37[/C][C]0.108816[/C][C]0.9973[/C][C]0.160737[/C][/ROW]
[ROW][C]38[/C][C]0.063571[/C][C]0.5826[/C][C]0.280849[/C][/ROW]
[ROW][C]39[/C][C]0.018325[/C][C]0.168[/C][C]0.433511[/C][/ROW]
[ROW][C]40[/C][C]-0.011431[/C][C]-0.1048[/C][C]0.458407[/C][/ROW]
[ROW][C]41[/C][C]-0.041186[/C][C]-0.3775[/C][C]0.353385[/C][/ROW]
[ROW][C]42[/C][C]-0.070942[/C][C]-0.6502[/C][C]0.25867[/C][/ROW]
[ROW][C]43[/C][C]-0.100698[/C][C]-0.9229[/C][C]0.179348[/C][/ROW]
[ROW][C]44[/C][C]-0.130454[/C][C]-1.1956[/C][C]0.117602[/C][/ROW]
[ROW][C]45[/C][C]-0.16021[/C][C]-1.4683[/C][C]0.072872[/C][/ROW]
[ROW][C]46[/C][C]-0.15923[/C][C]-1.4594[/C][C]0.074097[/C][/ROW]
[ROW][C]47[/C][C]-0.15825[/C][C]-1.4504[/C][C]0.075338[/C][/ROW]
[ROW][C]48[/C][C]-0.15727[/C][C]-1.4414[/C][C]0.076595[/C][/ROW]
[/TABLE]
Source: https://freestatistics.org/blog/index.php?pk=277869&T=1

Globally Unique Identifier (entire table): ba.freestatistics.org/blog/index.php?pk=277869&T=1

As an alternative you can also use a QR Code:  

The GUIDs for individual cells are displayed in the table below:

Autocorrelation Function
Time lag kACF(k)T-STATP-value
10.88558.11570
20.7717.06630
30.65656.01690
40.5430724.97732e-06
50.4296443.93778.5e-05
60.3162152.89820.002393
70.2027871.85860.033295
80.0893580.8190.207557
9-0.02407-0.22060.412967
10-0.130405-1.19520.11769
11-0.23674-2.16980.016425
12-0.343074-3.14430.001151
13-0.32187-2.950.002058
14-0.300666-2.75560.003591
15-0.279462-2.56130.006107
16-0.259293-2.37650.009877
17-0.239124-2.19160.015588
18-0.218955-2.00680.023996
19-0.198787-1.82190.036014
20-0.178618-1.63710.05268
21-0.158449-1.45220.075084
22-0.1401-1.2840.10133
23-0.12175-1.11590.133832
24-0.103401-0.94770.173004
25-0.073685-0.67530.250659
26-0.043969-0.4030.343992
27-0.014253-0.13060.44819
280.0092970.08520.466149
290.0328470.3010.382061
300.0563970.51690.303296
310.0799470.73270.232882
320.1034970.94860.172781
330.1270471.16440.123778
340.1360521.24690.107943
350.1450571.32950.093646
360.1540621.4120.080822
370.1088160.99730.160737
380.0635710.58260.280849
390.0183250.1680.433511
40-0.011431-0.10480.458407
41-0.041186-0.37750.353385
42-0.070942-0.65020.25867
43-0.100698-0.92290.179348
44-0.130454-1.19560.117602
45-0.16021-1.46830.072872
46-0.15923-1.45940.074097
47-0.15825-1.45040.075338
48-0.15727-1.44140.076595


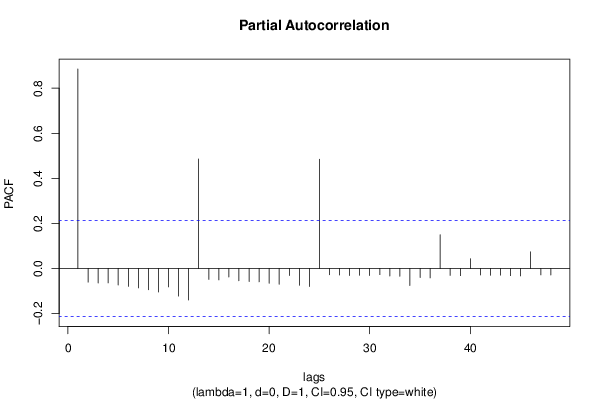
Partial Autocorrelation Function
Time lag kPACF(k)T-STATP-value
10.88558.11570
2-0.060727-0.55660.289651
3-0.064653-0.59260.277537
4-0.064119-0.58770.279167
5-0.073512-0.67370.251161
6-0.079344-0.72720.234562
7-0.086159-0.78970.215976
8-0.094306-0.86430.194935
9-0.104126-0.95430.171328
10-0.08165-0.74830.228175
11-0.122641-1.1240.132103
12-0.139784-1.28110.101835
130.4859154.45351.3e-05
14-0.048361-0.44320.329366
15-0.050819-0.46580.321295
16-0.037733-0.34580.365169
17-0.054804-0.50230.308388
18-0.057982-0.53140.298267
19-0.059393-0.54430.293824
20-0.065304-0.59850.27555
21-0.069867-0.64030.261846
22-0.031222-0.28620.387733
23-0.07437-0.68160.248678
24-0.080346-0.73640.231775
250.4847224.44261.3e-05
26-0.027884-0.25560.399456
27-0.028684-0.26290.396638
28-0.03091-0.28330.388825
29-0.030514-0.27970.390211
30-0.031474-0.28850.38685
31-0.027543-0.25240.400662
32-0.033257-0.30480.380633
33-0.034401-0.31530.376661
34-0.075578-0.69270.245211
35-0.040026-0.36680.357328
36-0.041695-0.38210.35166
370.1497351.37230.086805
38-0.030835-0.28260.389087
39-0.031816-0.29160.385656
400.0432590.39650.346381
41-0.029178-0.26740.394902
42-0.030054-0.27550.391822
43-0.029542-0.27080.393622
44-0.031884-0.29220.385418
45-0.032934-0.30180.381757
460.0735610.67420.251018
47-0.028421-0.26050.397565
48-0.029252-0.26810.394639

\begin{tabular}{lllllllll}
\hline
Partial Autocorrelation Function \tabularnewline
Time lag k & PACF(k) & T-STAT & P-value \tabularnewline
1 & 0.8855 & 8.1157 & 0 \tabularnewline
2 & -0.060727 & -0.5566 & 0.289651 \tabularnewline
3 & -0.064653 & -0.5926 & 0.277537 \tabularnewline
4 & -0.064119 & -0.5877 & 0.279167 \tabularnewline
5 & -0.073512 & -0.6737 & 0.251161 \tabularnewline
6 & -0.079344 & -0.7272 & 0.234562 \tabularnewline
7 & -0.086159 & -0.7897 & 0.215976 \tabularnewline
8 & -0.094306 & -0.8643 & 0.194935 \tabularnewline
9 & -0.104126 & -0.9543 & 0.171328 \tabularnewline
10 & -0.08165 & -0.7483 & 0.228175 \tabularnewline
11 & -0.122641 & -1.124 & 0.132103 \tabularnewline
12 & -0.139784 & -1.2811 & 0.101835 \tabularnewline
13 & 0.485915 & 4.4535 & 1.3e-05 \tabularnewline
14 & -0.048361 & -0.4432 & 0.329366 \tabularnewline
15 & -0.050819 & -0.4658 & 0.321295 \tabularnewline
16 & -0.037733 & -0.3458 & 0.365169 \tabularnewline
17 & -0.054804 & -0.5023 & 0.308388 \tabularnewline
18 & -0.057982 & -0.5314 & 0.298267 \tabularnewline
19 & -0.059393 & -0.5443 & 0.293824 \tabularnewline
20 & -0.065304 & -0.5985 & 0.27555 \tabularnewline
21 & -0.069867 & -0.6403 & 0.261846 \tabularnewline
22 & -0.031222 & -0.2862 & 0.387733 \tabularnewline
23 & -0.07437 & -0.6816 & 0.248678 \tabularnewline
24 & -0.080346 & -0.7364 & 0.231775 \tabularnewline
25 & 0.484722 & 4.4426 & 1.3e-05 \tabularnewline
26 & -0.027884 & -0.2556 & 0.399456 \tabularnewline
27 & -0.028684 & -0.2629 & 0.396638 \tabularnewline
28 & -0.03091 & -0.2833 & 0.388825 \tabularnewline
29 & -0.030514 & -0.2797 & 0.390211 \tabularnewline
30 & -0.031474 & -0.2885 & 0.38685 \tabularnewline
31 & -0.027543 & -0.2524 & 0.400662 \tabularnewline
32 & -0.033257 & -0.3048 & 0.380633 \tabularnewline
33 & -0.034401 & -0.3153 & 0.376661 \tabularnewline
34 & -0.075578 & -0.6927 & 0.245211 \tabularnewline
35 & -0.040026 & -0.3668 & 0.357328 \tabularnewline
36 & -0.041695 & -0.3821 & 0.35166 \tabularnewline
37 & 0.149735 & 1.3723 & 0.086805 \tabularnewline
38 & -0.030835 & -0.2826 & 0.389087 \tabularnewline
39 & -0.031816 & -0.2916 & 0.385656 \tabularnewline
40 & 0.043259 & 0.3965 & 0.346381 \tabularnewline
41 & -0.029178 & -0.2674 & 0.394902 \tabularnewline
42 & -0.030054 & -0.2755 & 0.391822 \tabularnewline
43 & -0.029542 & -0.2708 & 0.393622 \tabularnewline
44 & -0.031884 & -0.2922 & 0.385418 \tabularnewline
45 & -0.032934 & -0.3018 & 0.381757 \tabularnewline
46 & 0.073561 & 0.6742 & 0.251018 \tabularnewline
47 & -0.028421 & -0.2605 & 0.397565 \tabularnewline
48 & -0.029252 & -0.2681 & 0.394639 \tabularnewline
\hline
\end{tabular}
%Source: https://freestatistics.org/blog/index.php?pk=277869&T=2

[TABLE]
[ROW][C]Partial Autocorrelation Function[/C][/ROW]
[ROW][C]Time lag k[/C][C]PACF(k)[/C][C]T-STAT[/C][C]P-value[/C][/ROW]
[ROW][C]1[/C][C]0.8855[/C][C]8.1157[/C][C]0[/C][/ROW]
[ROW][C]2[/C][C]-0.060727[/C][C]-0.5566[/C][C]0.289651[/C][/ROW]
[ROW][C]3[/C][C]-0.064653[/C][C]-0.5926[/C][C]0.277537[/C][/ROW]
[ROW][C]4[/C][C]-0.064119[/C][C]-0.5877[/C][C]0.279167[/C][/ROW]
[ROW][C]5[/C][C]-0.073512[/C][C]-0.6737[/C][C]0.251161[/C][/ROW]
[ROW][C]6[/C][C]-0.079344[/C][C]-0.7272[/C][C]0.234562[/C][/ROW]
[ROW][C]7[/C][C]-0.086159[/C][C]-0.7897[/C][C]0.215976[/C][/ROW]
[ROW][C]8[/C][C]-0.094306[/C][C]-0.8643[/C][C]0.194935[/C][/ROW]
[ROW][C]9[/C][C]-0.104126[/C][C]-0.9543[/C][C]0.171328[/C][/ROW]
[ROW][C]10[/C][C]-0.08165[/C][C]-0.7483[/C][C]0.228175[/C][/ROW]
[ROW][C]11[/C][C]-0.122641[/C][C]-1.124[/C][C]0.132103[/C][/ROW]
[ROW][C]12[/C][C]-0.139784[/C][C]-1.2811[/C][C]0.101835[/C][/ROW]
[ROW][C]13[/C][C]0.485915[/C][C]4.4535[/C][C]1.3e-05[/C][/ROW]
[ROW][C]14[/C][C]-0.048361[/C][C]-0.4432[/C][C]0.329366[/C][/ROW]
[ROW][C]15[/C][C]-0.050819[/C][C]-0.4658[/C][C]0.321295[/C][/ROW]
[ROW][C]16[/C][C]-0.037733[/C][C]-0.3458[/C][C]0.365169[/C][/ROW]
[ROW][C]17[/C][C]-0.054804[/C][C]-0.5023[/C][C]0.308388[/C][/ROW]
[ROW][C]18[/C][C]-0.057982[/C][C]-0.5314[/C][C]0.298267[/C][/ROW]
[ROW][C]19[/C][C]-0.059393[/C][C]-0.5443[/C][C]0.293824[/C][/ROW]
[ROW][C]20[/C][C]-0.065304[/C][C]-0.5985[/C][C]0.27555[/C][/ROW]
[ROW][C]21[/C][C]-0.069867[/C][C]-0.6403[/C][C]0.261846[/C][/ROW]
[ROW][C]22[/C][C]-0.031222[/C][C]-0.2862[/C][C]0.387733[/C][/ROW]
[ROW][C]23[/C][C]-0.07437[/C][C]-0.6816[/C][C]0.248678[/C][/ROW]
[ROW][C]24[/C][C]-0.080346[/C][C]-0.7364[/C][C]0.231775[/C][/ROW]
[ROW][C]25[/C][C]0.484722[/C][C]4.4426[/C][C]1.3e-05[/C][/ROW]
[ROW][C]26[/C][C]-0.027884[/C][C]-0.2556[/C][C]0.399456[/C][/ROW]
[ROW][C]27[/C][C]-0.028684[/C][C]-0.2629[/C][C]0.396638[/C][/ROW]
[ROW][C]28[/C][C]-0.03091[/C][C]-0.2833[/C][C]0.388825[/C][/ROW]
[ROW][C]29[/C][C]-0.030514[/C][C]-0.2797[/C][C]0.390211[/C][/ROW]
[ROW][C]30[/C][C]-0.031474[/C][C]-0.2885[/C][C]0.38685[/C][/ROW]
[ROW][C]31[/C][C]-0.027543[/C][C]-0.2524[/C][C]0.400662[/C][/ROW]
[ROW][C]32[/C][C]-0.033257[/C][C]-0.3048[/C][C]0.380633[/C][/ROW]
[ROW][C]33[/C][C]-0.034401[/C][C]-0.3153[/C][C]0.376661[/C][/ROW]
[ROW][C]34[/C][C]-0.075578[/C][C]-0.6927[/C][C]0.245211[/C][/ROW]
[ROW][C]35[/C][C]-0.040026[/C][C]-0.3668[/C][C]0.357328[/C][/ROW]
[ROW][C]36[/C][C]-0.041695[/C][C]-0.3821[/C][C]0.35166[/C][/ROW]
[ROW][C]37[/C][C]0.149735[/C][C]1.3723[/C][C]0.086805[/C][/ROW]
[ROW][C]38[/C][C]-0.030835[/C][C]-0.2826[/C][C]0.389087[/C][/ROW]
[ROW][C]39[/C][C]-0.031816[/C][C]-0.2916[/C][C]0.385656[/C][/ROW]
[ROW][C]40[/C][C]0.043259[/C][C]0.3965[/C][C]0.346381[/C][/ROW]
[ROW][C]41[/C][C]-0.029178[/C][C]-0.2674[/C][C]0.394902[/C][/ROW]
[ROW][C]42[/C][C]-0.030054[/C][C]-0.2755[/C][C]0.391822[/C][/ROW]
[ROW][C]43[/C][C]-0.029542[/C][C]-0.2708[/C][C]0.393622[/C][/ROW]
[ROW][C]44[/C][C]-0.031884[/C][C]-0.2922[/C][C]0.385418[/C][/ROW]
[ROW][C]45[/C][C]-0.032934[/C][C]-0.3018[/C][C]0.381757[/C][/ROW]
[ROW][C]46[/C][C]0.073561[/C][C]0.6742[/C][C]0.251018[/C][/ROW]
[ROW][C]47[/C][C]-0.028421[/C][C]-0.2605[/C][C]0.397565[/C][/ROW]
[ROW][C]48[/C][C]-0.029252[/C][C]-0.2681[/C][C]0.394639[/C][/ROW]
[/TABLE]
Source: https://freestatistics.org/blog/index.php?pk=277869&T=2

Globally Unique Identifier (entire table): ba.freestatistics.org/blog/index.php?pk=277869&T=2

As an alternative you can also use a QR Code:  

The GUIDs for individual cells are displayed in the table below:

Partial Autocorrelation Function
Time lag kPACF(k)T-STATP-value
10.88558.11570
2-0.060727-0.55660.289651
3-0.064653-0.59260.277537
4-0.064119-0.58770.279167
5-0.073512-0.67370.251161
6-0.079344-0.72720.234562
7-0.086159-0.78970.215976
8-0.094306-0.86430.194935
9-0.104126-0.95430.171328
10-0.08165-0.74830.228175
11-0.122641-1.1240.132103
12-0.139784-1.28110.101835
130.4859154.45351.3e-05
14-0.048361-0.44320.329366
15-0.050819-0.46580.321295
16-0.037733-0.34580.365169
17-0.054804-0.50230.308388
18-0.057982-0.53140.298267
19-0.059393-0.54430.293824
20-0.065304-0.59850.27555
21-0.069867-0.64030.261846
22-0.031222-0.28620.387733
23-0.07437-0.68160.248678
24-0.080346-0.73640.231775
250.4847224.44261.3e-05
26-0.027884-0.25560.399456
27-0.028684-0.26290.396638
28-0.03091-0.28330.388825
29-0.030514-0.27970.390211
30-0.031474-0.28850.38685
31-0.027543-0.25240.400662
32-0.033257-0.30480.380633
33-0.034401-0.31530.376661
34-0.075578-0.69270.245211
35-0.040026-0.36680.357328
36-0.041695-0.38210.35166
370.1497351.37230.086805
38-0.030835-0.28260.389087
39-0.031816-0.29160.385656
400.0432590.39650.346381
41-0.029178-0.26740.394902
42-0.030054-0.27550.391822
43-0.029542-0.27080.393622
44-0.031884-0.29220.385418
45-0.032934-0.30180.381757
460.0735610.67420.251018
47-0.028421-0.26050.397565
48-0.029252-0.26810.394639


Parameters (Session):
par1 = 48 ; par2 = 1 ; par3 = 0 ; par4 = 1 ; par5 = 12 ; par6 = White Noise ; par7 = 0.95 ;
Parameters (R input):
par1 = 48 ; par2 = 1 ; par3 = 0 ; par4 = 1 ; par5 = 12 ; par6 = White Noise ; par7 = 0.95 ; par8 = ;
R code (references can be found in the software module):
if (par1 == 'Default') {
par1 = 10*log10(length(x))
} else {
par1 <- as.numeric(par1)
}
par2 <- as.numeric(par2)
par3 <- as.numeric(par3)
par4 <- as.numeric(par4)
par5 <- as.numeric(par5)
if (par6 == 'White Noise') par6 <- 'white' else par6 <- 'ma'
par7 <- as.numeric(par7)
if (par8 != '') par8 <- as.numeric(par8)
ox <- x
if (par8 == '') {
if (par2 == 0) {
x <- log(x)
} else {
x <- (x ^ par2 - 1) / par2
}
} else {
x <- log(x,base=par8)
}
if (par3 > 0) x <- diff(x,lag=1,difference=par3)
if (par4 > 0) x <- diff(x,lag=par5,difference=par4)
bitmap(file='picts.png')
op <- par(mfrow=c(2,1))
plot(ox,type='l',main='Original Time Series',xlab='time',ylab='value')
if (par8=='') {
mytitle <- paste('Working Time Series (lambda=',par2,', d=',par3,', D=',par4,')',sep='')
mysub <- paste('(lambda=',par2,', d=',par3,', D=',par4,', CI=', par7, ', CI type=',par6,')',sep='')
} else {
mytitle <- paste('Working Time Series (base=',par8,', d=',par3,', D=',par4,')',sep='')
mysub <- paste('(base=',par8,', d=',par3,', D=',par4,', CI=', par7, ', CI type=',par6,')',sep='')
}
plot(x,type='l', main=mytitle,xlab='time',ylab='value')
par(op)
dev.off()
bitmap(file='pic1.png')
racf <- acf(x, par1, main='Autocorrelation', xlab='time lag', ylab='ACF', ci.type=par6, ci=par7, sub=mysub)
dev.off()
bitmap(file='pic2.png')
rpacf <- pacf(x,par1,main='Partial Autocorrelation',xlab='lags',ylab='PACF',sub=mysub)
dev.off()
(myacf <- c(racf$acf))
(mypacf <- c(rpacf$acf))
lengthx <- length(x)
sqrtn <- sqrt(lengthx)
load(file='createtable')
a<-table.start()
a<-table.row.start(a)
a<-table.element(a,'Autocorrelation Function',4,TRUE)
a<-table.row.end(a)
a<-table.row.start(a)
a<-table.element(a,'Time lag k',header=TRUE)
a<-table.element(a,hyperlink('basics.htm','ACF(k)','click here for more information about the Autocorrelation Function'),header=TRUE)
a<-table.element(a,'T-STAT',header=TRUE)
a<-table.element(a,'P-value',header=TRUE)
a<-table.row.end(a)
for (i in 2:(par1+1)) {
a<-table.row.start(a)
a<-table.element(a,i-1,header=TRUE)
a<-table.element(a,round(myacf[i],6))
mytstat <- myacf[i]*sqrtn
a<-table.element(a,round(mytstat,4))
a<-table.element(a,round(1-pt(abs(mytstat),lengthx),6))
a<-table.row.end(a)
}
a<-table.end(a)
table.save(a,file='mytable.tab')
a<-table.start()
a<-table.row.start(a)
a<-table.element(a,'Partial Autocorrelation Function',4,TRUE)
a<-table.row.end(a)
a<-table.row.start(a)
a<-table.element(a,'Time lag k',header=TRUE)
a<-table.element(a,hyperlink('basics.htm','PACF(k)','click here for more information about the Partial Autocorrelation Function'),header=TRUE)
a<-table.element(a,'T-STAT',header=TRUE)
a<-table.element(a,'P-value',header=TRUE)
a<-table.row.end(a)
for (i in 1:par1) {
a<-table.row.start(a)
a<-table.element(a,i,header=TRUE)
a<-table.element(a,round(mypacf[i],6))
mytstat <- mypacf[i]*sqrtn
a<-table.element(a,round(mytstat,4))
a<-table.element(a,round(1-pt(abs(mytstat),lengthx),6))
a<-table.row.end(a)
}
a<-table.end(a)
table.save(a,file='mytable1.tab')