Free Statistics

of Irreproducible Research!

Author's title

Author*Unverified author*
R Software Modulerwasp_autocorrelation.wasp
Title produced by software(Partial) Autocorrelation Function
Date of computationTue, 03 Mar 2015 21:51:34 +0000
Cite this page as followsStatistical Computations at FreeStatistics.org, Office for Research Development and Education, URL https://freestatistics.org/blog/index.php?v=date/2015/Mar/03/t14254196314r8d8yj91jdoj5m.htm/, Retrieved Sun, 19 May 2024 13:04:05 +0000
Statistical Computations at FreeStatistics.org, Office for Research Development and Education, URL https://freestatistics.org/blog/index.php?pk=277865, Retrieved Sun, 19 May 2024 13:04:05 +0000
QR Codes:

Original text written by user:
IsPrivate?No (this computation is public)
User-defined keywords
Estimated Impact158
Family? (F = Feedback message, R = changed R code, M = changed R Module, P = changed Parameters, D = changed Data)
-       [(Partial) Autocorrelation Function] [] [2015-03-03 21:51:34] [4fa22ecf638daf61dea82ccfb30e12bf] [Current]
Feedback Forum

Post a new message
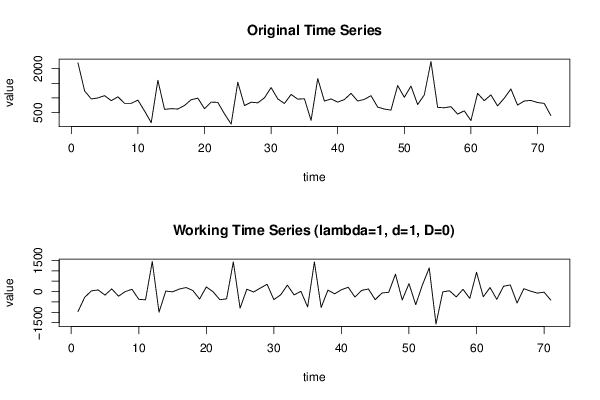
Dataseries X:
2201
1239
966
1001
1079
909
1038
817
817
926
555
156
1604
610
635
623
744
939
993
634
858
849
458
109
1538
739
855
834
1004
1355
968
811
1121
960
973
233
1662
894
966
859
946
1156
895
952
1078
689
621
587
1425
1022
1406
776
1105
2244
679
665
704
449
560
229
1158
908
1104
731
989
1308
757
896
917
844
815
401


Summary of computational transaction
Raw Inputview raw input (R code)
Raw Outputview raw output of R engine
Computing time1 seconds
R Server'Herman Ole Andreas Wold' @ wold.wessa.net

\begin{tabular}{lllllllll}
\hline
Summary of computational transaction \tabularnewline
Raw Input & view raw input (R code)  \tabularnewline
Raw Output & view raw output of R engine  \tabularnewline
Computing time & 1 seconds \tabularnewline
R Server & 'Herman Ole Andreas Wold' @ wold.wessa.net \tabularnewline
\hline
\end{tabular}
%Source: https://freestatistics.org/blog/index.php?pk=277865&T=0

[TABLE]
[ROW][C]Summary of computational transaction[/C][/ROW]
[ROW][C]Raw Input[/C][C]view raw input (R code) [/C][/ROW]
[ROW][C]Raw Output[/C][C]view raw output of R engine [/C][/ROW]
[ROW][C]Computing time[/C][C]1 seconds[/C][/ROW]
[ROW][C]R Server[/C][C]'Herman Ole Andreas Wold' @ wold.wessa.net[/C][/ROW]
[/TABLE]
Source: https://freestatistics.org/blog/index.php?pk=277865&T=0

Globally Unique Identifier (entire table): ba.freestatistics.org/blog/index.php?pk=277865&T=0

As an alternative you can also use a QR Code:  

The GUIDs for individual cells are displayed in the table below:

Summary of computational transaction
Raw Inputview raw input (R code)
Raw Outputview raw output of R engine
Computing time1 seconds
R Server'Herman Ole Andreas Wold' @ wold.wessa.net


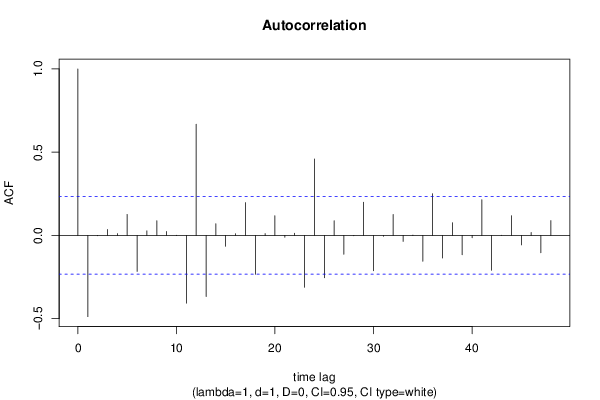
Autocorrelation Function
Time lag kACF(k)T-STATP-value
1-0.487997-4.11195.2e-05
2-0.002548-0.02150.491466
30.0360690.30390.381039
40.0110380.0930.463079
50.1262331.06370.145543
6-0.215952-1.81960.036514
70.0274130.2310.408997
80.0879190.74080.230623
90.023350.19670.422293
100.0014440.01220.495163
11-0.406638-3.42640.00051
120.668295.63110
13-0.366913-3.09170.001422
140.0701220.59090.278245
15-0.064775-0.54580.293456
160.0103970.08760.465218
170.1970251.66020.050646
18-0.233809-1.97010.026363
190.01080.0910.463874
200.1177140.99190.162314
21-0.011505-0.09690.461524
220.0131250.11060.456124
23-0.311727-2.62670.005278
240.458723.86520.000122
25-0.254643-2.14570.01766
260.0877950.73980.230938
27-0.112862-0.9510.172418
28-0.001986-0.01670.493347
290.1993531.67980.048698
30-0.212854-1.79350.038573
31-0.004977-0.04190.483334
320.1257741.05980.146416
33-0.035969-0.30310.381357
340.0009260.00780.4969
35-0.15514-1.30720.097675
360.2499182.10580.019377
37-0.135487-1.14160.128722
380.0758780.63940.262322
39-0.115894-0.97650.166057
40-0.014247-0.120.452393
410.214441.80690.037507
42-0.209078-1.76170.041211
43-0.000645-0.00540.497838
440.1185190.99870.160676
45-0.056885-0.47930.316591
460.0172730.14550.442346
47-0.104126-0.87740.19162
480.0887880.74810.228424

\begin{tabular}{lllllllll}
\hline
Autocorrelation Function \tabularnewline
Time lag k & ACF(k) & T-STAT & P-value \tabularnewline
1 & -0.487997 & -4.1119 & 5.2e-05 \tabularnewline
2 & -0.002548 & -0.0215 & 0.491466 \tabularnewline
3 & 0.036069 & 0.3039 & 0.381039 \tabularnewline
4 & 0.011038 & 0.093 & 0.463079 \tabularnewline
5 & 0.126233 & 1.0637 & 0.145543 \tabularnewline
6 & -0.215952 & -1.8196 & 0.036514 \tabularnewline
7 & 0.027413 & 0.231 & 0.408997 \tabularnewline
8 & 0.087919 & 0.7408 & 0.230623 \tabularnewline
9 & 0.02335 & 0.1967 & 0.422293 \tabularnewline
10 & 0.001444 & 0.0122 & 0.495163 \tabularnewline
11 & -0.406638 & -3.4264 & 0.00051 \tabularnewline
12 & 0.66829 & 5.6311 & 0 \tabularnewline
13 & -0.366913 & -3.0917 & 0.001422 \tabularnewline
14 & 0.070122 & 0.5909 & 0.278245 \tabularnewline
15 & -0.064775 & -0.5458 & 0.293456 \tabularnewline
16 & 0.010397 & 0.0876 & 0.465218 \tabularnewline
17 & 0.197025 & 1.6602 & 0.050646 \tabularnewline
18 & -0.233809 & -1.9701 & 0.026363 \tabularnewline
19 & 0.0108 & 0.091 & 0.463874 \tabularnewline
20 & 0.117714 & 0.9919 & 0.162314 \tabularnewline
21 & -0.011505 & -0.0969 & 0.461524 \tabularnewline
22 & 0.013125 & 0.1106 & 0.456124 \tabularnewline
23 & -0.311727 & -2.6267 & 0.005278 \tabularnewline
24 & 0.45872 & 3.8652 & 0.000122 \tabularnewline
25 & -0.254643 & -2.1457 & 0.01766 \tabularnewline
26 & 0.087795 & 0.7398 & 0.230938 \tabularnewline
27 & -0.112862 & -0.951 & 0.172418 \tabularnewline
28 & -0.001986 & -0.0167 & 0.493347 \tabularnewline
29 & 0.199353 & 1.6798 & 0.048698 \tabularnewline
30 & -0.212854 & -1.7935 & 0.038573 \tabularnewline
31 & -0.004977 & -0.0419 & 0.483334 \tabularnewline
32 & 0.125774 & 1.0598 & 0.146416 \tabularnewline
33 & -0.035969 & -0.3031 & 0.381357 \tabularnewline
34 & 0.000926 & 0.0078 & 0.4969 \tabularnewline
35 & -0.15514 & -1.3072 & 0.097675 \tabularnewline
36 & 0.249918 & 2.1058 & 0.019377 \tabularnewline
37 & -0.135487 & -1.1416 & 0.128722 \tabularnewline
38 & 0.075878 & 0.6394 & 0.262322 \tabularnewline
39 & -0.115894 & -0.9765 & 0.166057 \tabularnewline
40 & -0.014247 & -0.12 & 0.452393 \tabularnewline
41 & 0.21444 & 1.8069 & 0.037507 \tabularnewline
42 & -0.209078 & -1.7617 & 0.041211 \tabularnewline
43 & -0.000645 & -0.0054 & 0.497838 \tabularnewline
44 & 0.118519 & 0.9987 & 0.160676 \tabularnewline
45 & -0.056885 & -0.4793 & 0.316591 \tabularnewline
46 & 0.017273 & 0.1455 & 0.442346 \tabularnewline
47 & -0.104126 & -0.8774 & 0.19162 \tabularnewline
48 & 0.088788 & 0.7481 & 0.228424 \tabularnewline
\hline
\end{tabular}
%Source: https://freestatistics.org/blog/index.php?pk=277865&T=1

[TABLE]
[ROW][C]Autocorrelation Function[/C][/ROW]
[ROW][C]Time lag k[/C][C]ACF(k)[/C][C]T-STAT[/C][C]P-value[/C][/ROW]
[ROW][C]1[/C][C]-0.487997[/C][C]-4.1119[/C][C]5.2e-05[/C][/ROW]
[ROW][C]2[/C][C]-0.002548[/C][C]-0.0215[/C][C]0.491466[/C][/ROW]
[ROW][C]3[/C][C]0.036069[/C][C]0.3039[/C][C]0.381039[/C][/ROW]
[ROW][C]4[/C][C]0.011038[/C][C]0.093[/C][C]0.463079[/C][/ROW]
[ROW][C]5[/C][C]0.126233[/C][C]1.0637[/C][C]0.145543[/C][/ROW]
[ROW][C]6[/C][C]-0.215952[/C][C]-1.8196[/C][C]0.036514[/C][/ROW]
[ROW][C]7[/C][C]0.027413[/C][C]0.231[/C][C]0.408997[/C][/ROW]
[ROW][C]8[/C][C]0.087919[/C][C]0.7408[/C][C]0.230623[/C][/ROW]
[ROW][C]9[/C][C]0.02335[/C][C]0.1967[/C][C]0.422293[/C][/ROW]
[ROW][C]10[/C][C]0.001444[/C][C]0.0122[/C][C]0.495163[/C][/ROW]
[ROW][C]11[/C][C]-0.406638[/C][C]-3.4264[/C][C]0.00051[/C][/ROW]
[ROW][C]12[/C][C]0.66829[/C][C]5.6311[/C][C]0[/C][/ROW]
[ROW][C]13[/C][C]-0.366913[/C][C]-3.0917[/C][C]0.001422[/C][/ROW]
[ROW][C]14[/C][C]0.070122[/C][C]0.5909[/C][C]0.278245[/C][/ROW]
[ROW][C]15[/C][C]-0.064775[/C][C]-0.5458[/C][C]0.293456[/C][/ROW]
[ROW][C]16[/C][C]0.010397[/C][C]0.0876[/C][C]0.465218[/C][/ROW]
[ROW][C]17[/C][C]0.197025[/C][C]1.6602[/C][C]0.050646[/C][/ROW]
[ROW][C]18[/C][C]-0.233809[/C][C]-1.9701[/C][C]0.026363[/C][/ROW]
[ROW][C]19[/C][C]0.0108[/C][C]0.091[/C][C]0.463874[/C][/ROW]
[ROW][C]20[/C][C]0.117714[/C][C]0.9919[/C][C]0.162314[/C][/ROW]
[ROW][C]21[/C][C]-0.011505[/C][C]-0.0969[/C][C]0.461524[/C][/ROW]
[ROW][C]22[/C][C]0.013125[/C][C]0.1106[/C][C]0.456124[/C][/ROW]
[ROW][C]23[/C][C]-0.311727[/C][C]-2.6267[/C][C]0.005278[/C][/ROW]
[ROW][C]24[/C][C]0.45872[/C][C]3.8652[/C][C]0.000122[/C][/ROW]
[ROW][C]25[/C][C]-0.254643[/C][C]-2.1457[/C][C]0.01766[/C][/ROW]
[ROW][C]26[/C][C]0.087795[/C][C]0.7398[/C][C]0.230938[/C][/ROW]
[ROW][C]27[/C][C]-0.112862[/C][C]-0.951[/C][C]0.172418[/C][/ROW]
[ROW][C]28[/C][C]-0.001986[/C][C]-0.0167[/C][C]0.493347[/C][/ROW]
[ROW][C]29[/C][C]0.199353[/C][C]1.6798[/C][C]0.048698[/C][/ROW]
[ROW][C]30[/C][C]-0.212854[/C][C]-1.7935[/C][C]0.038573[/C][/ROW]
[ROW][C]31[/C][C]-0.004977[/C][C]-0.0419[/C][C]0.483334[/C][/ROW]
[ROW][C]32[/C][C]0.125774[/C][C]1.0598[/C][C]0.146416[/C][/ROW]
[ROW][C]33[/C][C]-0.035969[/C][C]-0.3031[/C][C]0.381357[/C][/ROW]
[ROW][C]34[/C][C]0.000926[/C][C]0.0078[/C][C]0.4969[/C][/ROW]
[ROW][C]35[/C][C]-0.15514[/C][C]-1.3072[/C][C]0.097675[/C][/ROW]
[ROW][C]36[/C][C]0.249918[/C][C]2.1058[/C][C]0.019377[/C][/ROW]
[ROW][C]37[/C][C]-0.135487[/C][C]-1.1416[/C][C]0.128722[/C][/ROW]
[ROW][C]38[/C][C]0.075878[/C][C]0.6394[/C][C]0.262322[/C][/ROW]
[ROW][C]39[/C][C]-0.115894[/C][C]-0.9765[/C][C]0.166057[/C][/ROW]
[ROW][C]40[/C][C]-0.014247[/C][C]-0.12[/C][C]0.452393[/C][/ROW]
[ROW][C]41[/C][C]0.21444[/C][C]1.8069[/C][C]0.037507[/C][/ROW]
[ROW][C]42[/C][C]-0.209078[/C][C]-1.7617[/C][C]0.041211[/C][/ROW]
[ROW][C]43[/C][C]-0.000645[/C][C]-0.0054[/C][C]0.497838[/C][/ROW]
[ROW][C]44[/C][C]0.118519[/C][C]0.9987[/C][C]0.160676[/C][/ROW]
[ROW][C]45[/C][C]-0.056885[/C][C]-0.4793[/C][C]0.316591[/C][/ROW]
[ROW][C]46[/C][C]0.017273[/C][C]0.1455[/C][C]0.442346[/C][/ROW]
[ROW][C]47[/C][C]-0.104126[/C][C]-0.8774[/C][C]0.19162[/C][/ROW]
[ROW][C]48[/C][C]0.088788[/C][C]0.7481[/C][C]0.228424[/C][/ROW]
[/TABLE]
Source: https://freestatistics.org/blog/index.php?pk=277865&T=1

Globally Unique Identifier (entire table): ba.freestatistics.org/blog/index.php?pk=277865&T=1

As an alternative you can also use a QR Code:  

The GUIDs for individual cells are displayed in the table below:

Autocorrelation Function
Time lag kACF(k)T-STATP-value
1-0.487997-4.11195.2e-05
2-0.002548-0.02150.491466
30.0360690.30390.381039
40.0110380.0930.463079
50.1262331.06370.145543
6-0.215952-1.81960.036514
70.0274130.2310.408997
80.0879190.74080.230623
90.023350.19670.422293
100.0014440.01220.495163
11-0.406638-3.42640.00051
120.668295.63110
13-0.366913-3.09170.001422
140.0701220.59090.278245
15-0.064775-0.54580.293456
160.0103970.08760.465218
170.1970251.66020.050646
18-0.233809-1.97010.026363
190.01080.0910.463874
200.1177140.99190.162314
21-0.011505-0.09690.461524
220.0131250.11060.456124
23-0.311727-2.62670.005278
240.458723.86520.000122
25-0.254643-2.14570.01766
260.0877950.73980.230938
27-0.112862-0.9510.172418
28-0.001986-0.01670.493347
290.1993531.67980.048698
30-0.212854-1.79350.038573
31-0.004977-0.04190.483334
320.1257741.05980.146416
33-0.035969-0.30310.381357
340.0009260.00780.4969
35-0.15514-1.30720.097675
360.2499182.10580.019377
37-0.135487-1.14160.128722
380.0758780.63940.262322
39-0.115894-0.97650.166057
40-0.014247-0.120.452393
410.214441.80690.037507
42-0.209078-1.76170.041211
43-0.000645-0.00540.497838
440.1185190.99870.160676
45-0.056885-0.47930.316591
460.0172730.14550.442346
47-0.104126-0.87740.19162
480.0887880.74810.228424


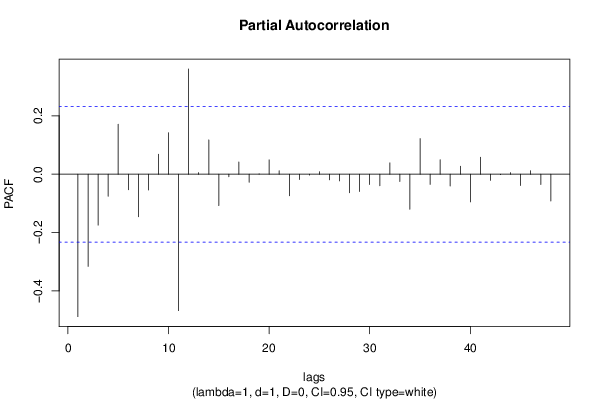
Partial Autocorrelation Function
Time lag kPACF(k)T-STATP-value
1-0.487997-4.11195.2e-05
2-0.315924-2.6620.0048
3-0.17459-1.47110.072838
4-0.075349-0.63490.263768
50.1714151.44440.076517
6-0.053186-0.44820.327703
7-0.14555-1.22640.112045
8-0.05436-0.4580.324159
90.0684730.5770.282895
100.1419731.19630.117782
11-0.467432-3.93879.5e-05
120.3605653.03820.001665
130.0053090.04470.482223
140.1175060.99010.162739
15-0.107574-0.90640.183886
16-0.008653-0.07290.471039
170.041960.35360.362357
18-0.027783-0.23410.407788
190.0006660.00560.497769
200.0491020.41370.340154
210.0116660.09830.460984
22-0.073675-0.62080.268362
23-0.018238-0.15370.439151
24-0.003088-0.0260.489657
250.0084270.0710.471795
26-0.019349-0.1630.435475
27-0.023003-0.19380.423432
28-0.063639-0.53620.296738
29-0.059502-0.50140.30883
30-0.035607-0.30.382515
31-0.039879-0.3360.368922
320.0388650.32750.372133
33-0.024782-0.20880.417593
34-0.120199-1.01280.157294
350.1218351.02660.154046
36-0.034811-0.29330.385067
370.0492970.41540.339558
38-0.040688-0.34280.366364
390.0269840.22740.410395
40-0.09482-0.7990.213487
410.0583570.49170.312214
42-0.021107-0.17790.429674
43-0.001505-0.01270.494959
440.00540.04550.481918
45-0.038942-0.32810.371889
460.0117090.09870.460841
47-0.03533-0.29770.383401
48-0.092029-0.77550.220324

\begin{tabular}{lllllllll}
\hline
Partial Autocorrelation Function \tabularnewline
Time lag k & PACF(k) & T-STAT & P-value \tabularnewline
1 & -0.487997 & -4.1119 & 5.2e-05 \tabularnewline
2 & -0.315924 & -2.662 & 0.0048 \tabularnewline
3 & -0.17459 & -1.4711 & 0.072838 \tabularnewline
4 & -0.075349 & -0.6349 & 0.263768 \tabularnewline
5 & 0.171415 & 1.4444 & 0.076517 \tabularnewline
6 & -0.053186 & -0.4482 & 0.327703 \tabularnewline
7 & -0.14555 & -1.2264 & 0.112045 \tabularnewline
8 & -0.05436 & -0.458 & 0.324159 \tabularnewline
9 & 0.068473 & 0.577 & 0.282895 \tabularnewline
10 & 0.141973 & 1.1963 & 0.117782 \tabularnewline
11 & -0.467432 & -3.9387 & 9.5e-05 \tabularnewline
12 & 0.360565 & 3.0382 & 0.001665 \tabularnewline
13 & 0.005309 & 0.0447 & 0.482223 \tabularnewline
14 & 0.117506 & 0.9901 & 0.162739 \tabularnewline
15 & -0.107574 & -0.9064 & 0.183886 \tabularnewline
16 & -0.008653 & -0.0729 & 0.471039 \tabularnewline
17 & 0.04196 & 0.3536 & 0.362357 \tabularnewline
18 & -0.027783 & -0.2341 & 0.407788 \tabularnewline
19 & 0.000666 & 0.0056 & 0.497769 \tabularnewline
20 & 0.049102 & 0.4137 & 0.340154 \tabularnewline
21 & 0.011666 & 0.0983 & 0.460984 \tabularnewline
22 & -0.073675 & -0.6208 & 0.268362 \tabularnewline
23 & -0.018238 & -0.1537 & 0.439151 \tabularnewline
24 & -0.003088 & -0.026 & 0.489657 \tabularnewline
25 & 0.008427 & 0.071 & 0.471795 \tabularnewline
26 & -0.019349 & -0.163 & 0.435475 \tabularnewline
27 & -0.023003 & -0.1938 & 0.423432 \tabularnewline
28 & -0.063639 & -0.5362 & 0.296738 \tabularnewline
29 & -0.059502 & -0.5014 & 0.30883 \tabularnewline
30 & -0.035607 & -0.3 & 0.382515 \tabularnewline
31 & -0.039879 & -0.336 & 0.368922 \tabularnewline
32 & 0.038865 & 0.3275 & 0.372133 \tabularnewline
33 & -0.024782 & -0.2088 & 0.417593 \tabularnewline
34 & -0.120199 & -1.0128 & 0.157294 \tabularnewline
35 & 0.121835 & 1.0266 & 0.154046 \tabularnewline
36 & -0.034811 & -0.2933 & 0.385067 \tabularnewline
37 & 0.049297 & 0.4154 & 0.339558 \tabularnewline
38 & -0.040688 & -0.3428 & 0.366364 \tabularnewline
39 & 0.026984 & 0.2274 & 0.410395 \tabularnewline
40 & -0.09482 & -0.799 & 0.213487 \tabularnewline
41 & 0.058357 & 0.4917 & 0.312214 \tabularnewline
42 & -0.021107 & -0.1779 & 0.429674 \tabularnewline
43 & -0.001505 & -0.0127 & 0.494959 \tabularnewline
44 & 0.0054 & 0.0455 & 0.481918 \tabularnewline
45 & -0.038942 & -0.3281 & 0.371889 \tabularnewline
46 & 0.011709 & 0.0987 & 0.460841 \tabularnewline
47 & -0.03533 & -0.2977 & 0.383401 \tabularnewline
48 & -0.092029 & -0.7755 & 0.220324 \tabularnewline
\hline
\end{tabular}
%Source: https://freestatistics.org/blog/index.php?pk=277865&T=2

[TABLE]
[ROW][C]Partial Autocorrelation Function[/C][/ROW]
[ROW][C]Time lag k[/C][C]PACF(k)[/C][C]T-STAT[/C][C]P-value[/C][/ROW]
[ROW][C]1[/C][C]-0.487997[/C][C]-4.1119[/C][C]5.2e-05[/C][/ROW]
[ROW][C]2[/C][C]-0.315924[/C][C]-2.662[/C][C]0.0048[/C][/ROW]
[ROW][C]3[/C][C]-0.17459[/C][C]-1.4711[/C][C]0.072838[/C][/ROW]
[ROW][C]4[/C][C]-0.075349[/C][C]-0.6349[/C][C]0.263768[/C][/ROW]
[ROW][C]5[/C][C]0.171415[/C][C]1.4444[/C][C]0.076517[/C][/ROW]
[ROW][C]6[/C][C]-0.053186[/C][C]-0.4482[/C][C]0.327703[/C][/ROW]
[ROW][C]7[/C][C]-0.14555[/C][C]-1.2264[/C][C]0.112045[/C][/ROW]
[ROW][C]8[/C][C]-0.05436[/C][C]-0.458[/C][C]0.324159[/C][/ROW]
[ROW][C]9[/C][C]0.068473[/C][C]0.577[/C][C]0.282895[/C][/ROW]
[ROW][C]10[/C][C]0.141973[/C][C]1.1963[/C][C]0.117782[/C][/ROW]
[ROW][C]11[/C][C]-0.467432[/C][C]-3.9387[/C][C]9.5e-05[/C][/ROW]
[ROW][C]12[/C][C]0.360565[/C][C]3.0382[/C][C]0.001665[/C][/ROW]
[ROW][C]13[/C][C]0.005309[/C][C]0.0447[/C][C]0.482223[/C][/ROW]
[ROW][C]14[/C][C]0.117506[/C][C]0.9901[/C][C]0.162739[/C][/ROW]
[ROW][C]15[/C][C]-0.107574[/C][C]-0.9064[/C][C]0.183886[/C][/ROW]
[ROW][C]16[/C][C]-0.008653[/C][C]-0.0729[/C][C]0.471039[/C][/ROW]
[ROW][C]17[/C][C]0.04196[/C][C]0.3536[/C][C]0.362357[/C][/ROW]
[ROW][C]18[/C][C]-0.027783[/C][C]-0.2341[/C][C]0.407788[/C][/ROW]
[ROW][C]19[/C][C]0.000666[/C][C]0.0056[/C][C]0.497769[/C][/ROW]
[ROW][C]20[/C][C]0.049102[/C][C]0.4137[/C][C]0.340154[/C][/ROW]
[ROW][C]21[/C][C]0.011666[/C][C]0.0983[/C][C]0.460984[/C][/ROW]
[ROW][C]22[/C][C]-0.073675[/C][C]-0.6208[/C][C]0.268362[/C][/ROW]
[ROW][C]23[/C][C]-0.018238[/C][C]-0.1537[/C][C]0.439151[/C][/ROW]
[ROW][C]24[/C][C]-0.003088[/C][C]-0.026[/C][C]0.489657[/C][/ROW]
[ROW][C]25[/C][C]0.008427[/C][C]0.071[/C][C]0.471795[/C][/ROW]
[ROW][C]26[/C][C]-0.019349[/C][C]-0.163[/C][C]0.435475[/C][/ROW]
[ROW][C]27[/C][C]-0.023003[/C][C]-0.1938[/C][C]0.423432[/C][/ROW]
[ROW][C]28[/C][C]-0.063639[/C][C]-0.5362[/C][C]0.296738[/C][/ROW]
[ROW][C]29[/C][C]-0.059502[/C][C]-0.5014[/C][C]0.30883[/C][/ROW]
[ROW][C]30[/C][C]-0.035607[/C][C]-0.3[/C][C]0.382515[/C][/ROW]
[ROW][C]31[/C][C]-0.039879[/C][C]-0.336[/C][C]0.368922[/C][/ROW]
[ROW][C]32[/C][C]0.038865[/C][C]0.3275[/C][C]0.372133[/C][/ROW]
[ROW][C]33[/C][C]-0.024782[/C][C]-0.2088[/C][C]0.417593[/C][/ROW]
[ROW][C]34[/C][C]-0.120199[/C][C]-1.0128[/C][C]0.157294[/C][/ROW]
[ROW][C]35[/C][C]0.121835[/C][C]1.0266[/C][C]0.154046[/C][/ROW]
[ROW][C]36[/C][C]-0.034811[/C][C]-0.2933[/C][C]0.385067[/C][/ROW]
[ROW][C]37[/C][C]0.049297[/C][C]0.4154[/C][C]0.339558[/C][/ROW]
[ROW][C]38[/C][C]-0.040688[/C][C]-0.3428[/C][C]0.366364[/C][/ROW]
[ROW][C]39[/C][C]0.026984[/C][C]0.2274[/C][C]0.410395[/C][/ROW]
[ROW][C]40[/C][C]-0.09482[/C][C]-0.799[/C][C]0.213487[/C][/ROW]
[ROW][C]41[/C][C]0.058357[/C][C]0.4917[/C][C]0.312214[/C][/ROW]
[ROW][C]42[/C][C]-0.021107[/C][C]-0.1779[/C][C]0.429674[/C][/ROW]
[ROW][C]43[/C][C]-0.001505[/C][C]-0.0127[/C][C]0.494959[/C][/ROW]
[ROW][C]44[/C][C]0.0054[/C][C]0.0455[/C][C]0.481918[/C][/ROW]
[ROW][C]45[/C][C]-0.038942[/C][C]-0.3281[/C][C]0.371889[/C][/ROW]
[ROW][C]46[/C][C]0.011709[/C][C]0.0987[/C][C]0.460841[/C][/ROW]
[ROW][C]47[/C][C]-0.03533[/C][C]-0.2977[/C][C]0.383401[/C][/ROW]
[ROW][C]48[/C][C]-0.092029[/C][C]-0.7755[/C][C]0.220324[/C][/ROW]
[/TABLE]
Source: https://freestatistics.org/blog/index.php?pk=277865&T=2

Globally Unique Identifier (entire table): ba.freestatistics.org/blog/index.php?pk=277865&T=2

As an alternative you can also use a QR Code:  

The GUIDs for individual cells are displayed in the table below:

Partial Autocorrelation Function
Time lag kPACF(k)T-STATP-value
1-0.487997-4.11195.2e-05
2-0.315924-2.6620.0048
3-0.17459-1.47110.072838
4-0.075349-0.63490.263768
50.1714151.44440.076517
6-0.053186-0.44820.327703
7-0.14555-1.22640.112045
8-0.05436-0.4580.324159
90.0684730.5770.282895
100.1419731.19630.117782
11-0.467432-3.93879.5e-05
120.3605653.03820.001665
130.0053090.04470.482223
140.1175060.99010.162739
15-0.107574-0.90640.183886
16-0.008653-0.07290.471039
170.041960.35360.362357
18-0.027783-0.23410.407788
190.0006660.00560.497769
200.0491020.41370.340154
210.0116660.09830.460984
22-0.073675-0.62080.268362
23-0.018238-0.15370.439151
24-0.003088-0.0260.489657
250.0084270.0710.471795
26-0.019349-0.1630.435475
27-0.023003-0.19380.423432
28-0.063639-0.53620.296738
29-0.059502-0.50140.30883
30-0.035607-0.30.382515
31-0.039879-0.3360.368922
320.0388650.32750.372133
33-0.024782-0.20880.417593
34-0.120199-1.01280.157294
350.1218351.02660.154046
36-0.034811-0.29330.385067
370.0492970.41540.339558
38-0.040688-0.34280.366364
390.0269840.22740.410395
40-0.09482-0.7990.213487
410.0583570.49170.312214
42-0.021107-0.17790.429674
43-0.001505-0.01270.494959
440.00540.04550.481918
45-0.038942-0.32810.371889
460.0117090.09870.460841
47-0.03533-0.29770.383401
48-0.092029-0.77550.220324


Parameters (Session):
par1 = 48 ; par2 = 1 ; par3 = 1 ; par4 = 0 ; par5 = 12 ; par6 = White Noise ; par7 = 0.95 ;
Parameters (R input):
par1 = 48 ; par2 = 1 ; par3 = 1 ; par4 = 0 ; par5 = 12 ; par6 = White Noise ; par7 = 0.95 ; par8 = ;
R code (references can be found in the software module):
if (par1 == 'Default') {
par1 = 10*log10(length(x))
} else {
par1 <- as.numeric(par1)
}
par2 <- as.numeric(par2)
par3 <- as.numeric(par3)
par4 <- as.numeric(par4)
par5 <- as.numeric(par5)
if (par6 == 'White Noise') par6 <- 'white' else par6 <- 'ma'
par7 <- as.numeric(par7)
if (par8 != '') par8 <- as.numeric(par8)
ox <- x
if (par8 == '') {
if (par2 == 0) {
x <- log(x)
} else {
x <- (x ^ par2 - 1) / par2
}
} else {
x <- log(x,base=par8)
}
if (par3 > 0) x <- diff(x,lag=1,difference=par3)
if (par4 > 0) x <- diff(x,lag=par5,difference=par4)
bitmap(file='picts.png')
op <- par(mfrow=c(2,1))
plot(ox,type='l',main='Original Time Series',xlab='time',ylab='value')
if (par8=='') {
mytitle <- paste('Working Time Series (lambda=',par2,', d=',par3,', D=',par4,')',sep='')
mysub <- paste('(lambda=',par2,', d=',par3,', D=',par4,', CI=', par7, ', CI type=',par6,')',sep='')
} else {
mytitle <- paste('Working Time Series (base=',par8,', d=',par3,', D=',par4,')',sep='')
mysub <- paste('(base=',par8,', d=',par3,', D=',par4,', CI=', par7, ', CI type=',par6,')',sep='')
}
plot(x,type='l', main=mytitle,xlab='time',ylab='value')
par(op)
dev.off()
bitmap(file='pic1.png')
racf <- acf(x, par1, main='Autocorrelation', xlab='time lag', ylab='ACF', ci.type=par6, ci=par7, sub=mysub)
dev.off()
bitmap(file='pic2.png')
rpacf <- pacf(x,par1,main='Partial Autocorrelation',xlab='lags',ylab='PACF',sub=mysub)
dev.off()
(myacf <- c(racf$acf))
(mypacf <- c(rpacf$acf))
lengthx <- length(x)
sqrtn <- sqrt(lengthx)
load(file='createtable')
a<-table.start()
a<-table.row.start(a)
a<-table.element(a,'Autocorrelation Function',4,TRUE)
a<-table.row.end(a)
a<-table.row.start(a)
a<-table.element(a,'Time lag k',header=TRUE)
a<-table.element(a,hyperlink('basics.htm','ACF(k)','click here for more information about the Autocorrelation Function'),header=TRUE)
a<-table.element(a,'T-STAT',header=TRUE)
a<-table.element(a,'P-value',header=TRUE)
a<-table.row.end(a)
for (i in 2:(par1+1)) {
a<-table.row.start(a)
a<-table.element(a,i-1,header=TRUE)
a<-table.element(a,round(myacf[i],6))
mytstat <- myacf[i]*sqrtn
a<-table.element(a,round(mytstat,4))
a<-table.element(a,round(1-pt(abs(mytstat),lengthx),6))
a<-table.row.end(a)
}
a<-table.end(a)
table.save(a,file='mytable.tab')
a<-table.start()
a<-table.row.start(a)
a<-table.element(a,'Partial Autocorrelation Function',4,TRUE)
a<-table.row.end(a)
a<-table.row.start(a)
a<-table.element(a,'Time lag k',header=TRUE)
a<-table.element(a,hyperlink('basics.htm','PACF(k)','click here for more information about the Partial Autocorrelation Function'),header=TRUE)
a<-table.element(a,'T-STAT',header=TRUE)
a<-table.element(a,'P-value',header=TRUE)
a<-table.row.end(a)
for (i in 1:par1) {
a<-table.row.start(a)
a<-table.element(a,i,header=TRUE)
a<-table.element(a,round(mypacf[i],6))
mytstat <- mypacf[i]*sqrtn
a<-table.element(a,round(mytstat,4))
a<-table.element(a,round(1-pt(abs(mytstat),lengthx),6))
a<-table.row.end(a)
}
a<-table.end(a)
table.save(a,file='mytable1.tab')