Free Statistics

of Irreproducible Research!

Author's title

Author*Unverified author*
R Software Modulerwasp_autocorrelation.wasp
Title produced by software(Partial) Autocorrelation Function
Date of computationMon, 02 Mar 2015 15:32:14 +0000
Cite this page as followsStatistical Computations at FreeStatistics.org, Office for Research Development and Education, URL https://freestatistics.org/blog/index.php?v=date/2015/Mar/02/t14253103725dyeoihxtqigoec.htm/, Retrieved Sun, 19 May 2024 12:03:10 +0000
Statistical Computations at FreeStatistics.org, Office for Research Development and Education, URL https://freestatistics.org/blog/index.php?pk=277823, Retrieved Sun, 19 May 2024 12:03:10 +0000
QR Codes:

Original text written by user:
IsPrivate?No (this computation is public)
User-defined keywords
Estimated Impact60
Family? (F = Feedback message, R = changed R code, M = changed R Module, P = changed Parameters, D = changed Data)
-       [(Partial) Autocorrelation Function] [autocorrelatie pe...] [2015-03-02 15:32:14] [c5baef828b4732814d7f41355a0722be] [Current]
Feedback Forum

Post a new message
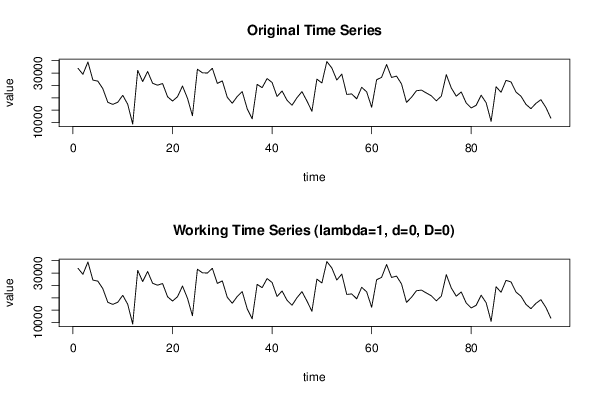
Dataseries X:
31956
29506
34506
27165
26736
23691
18157
17328
18205
20995
17382
9367
31124
26551
30651
25859
25100
25778
20418
18688
20424
24776
19814
12738
31566
30111
30019
31934
25826
26835
20205
17789
20520
22518
15572
11509
25447
24090
27786
26195
20516
22759
19028
16971
20036
22485
18730
14538
27561
25985
34670
32066
27186
29586
21359
21553
19573
24256
22380
16167
27297
28287
33474
28229
28785
25597
18130
20198
22849
23118
21925
20801
18785
20659
29367
23992
20645
22356
17902
15879
16963
21035
17988
10437
24470
22237
27053
26419
22311
20624
17336
15586
17733
19231
16102
11770


Summary of computational transaction
Raw Inputview raw input (R code)
Raw Outputview raw output of R engine
Computing time2 seconds
R Server'Herman Ole Andreas Wold' @ wold.wessa.net

\begin{tabular}{lllllllll}
\hline
Summary of computational transaction \tabularnewline
Raw Input & view raw input (R code)  \tabularnewline
Raw Output & view raw output of R engine  \tabularnewline
Computing time & 2 seconds \tabularnewline
R Server & 'Herman Ole Andreas Wold' @ wold.wessa.net \tabularnewline
\hline
\end{tabular}
%Source: https://freestatistics.org/blog/index.php?pk=277823&T=0

[TABLE]
[ROW][C]Summary of computational transaction[/C][/ROW]
[ROW][C]Raw Input[/C][C]view raw input (R code) [/C][/ROW]
[ROW][C]Raw Output[/C][C]view raw output of R engine [/C][/ROW]
[ROW][C]Computing time[/C][C]2 seconds[/C][/ROW]
[ROW][C]R Server[/C][C]'Herman Ole Andreas Wold' @ wold.wessa.net[/C][/ROW]
[/TABLE]
Source: https://freestatistics.org/blog/index.php?pk=277823&T=0

Globally Unique Identifier (entire table): ba.freestatistics.org/blog/index.php?pk=277823&T=0

As an alternative you can also use a QR Code:  

The GUIDs for individual cells are displayed in the table below:

Summary of computational transaction
Raw Inputview raw input (R code)
Raw Outputview raw output of R engine
Computing time2 seconds
R Server'Herman Ole Andreas Wold' @ wold.wessa.net


Autocorrelation Function
Time lag kACF(k)T-STATP-value
10.4668134.57387e-06
20.2515152.46430.007753
30.0914310.89580.18629
4-0.084974-0.83260.203575
5-0.174029-1.70510.045702
6-0.342451-3.35530.000568
7-0.204393-2.00260.024019
8-0.185663-1.81910.036006
9-0.08419-0.82490.205739
100.0859980.84260.200771
110.250492.45430.007959
120.653126.39920
130.3002792.94210.002043
140.1105441.08310.140737
15-0.047159-0.46210.322541
16-0.172168-1.68690.047435
17-0.203443-1.99330.024532
18-0.370766-3.63270.000226
19-0.253037-2.47920.007455
20-0.197546-1.93550.027933
21-0.129383-1.26770.103988
220.0116150.11380.454816
230.1987261.94710.027222
240.5179985.07531e-06
250.2706462.65180.004684
260.1366841.33920.09183
27-0.05033-0.49310.311523
28-0.173838-1.70330.045878
29-0.183251-1.79550.037861
30-0.345561-3.38580.000515
31-0.23791-2.3310.010922
32-0.178086-1.74490.042103
33-0.104052-1.01950.155265
34-0.002921-0.02860.488612
350.1348531.32130.094773
360.4352884.26492.3e-05
370.227342.22750.014126
380.1201121.17680.121083
39-0.052259-0.5120.304903
40-0.155533-1.52390.06541
41-0.171648-1.68180.047929
42-0.285155-2.79390.003143
43-0.180034-1.7640.04046
44-0.150647-1.4760.071604
45-0.079537-0.77930.218861
460.0140450.13760.445418
470.108881.06680.144369
480.3678933.60460.000249

\begin{tabular}{lllllllll}
\hline
Autocorrelation Function \tabularnewline
Time lag k & ACF(k) & T-STAT & P-value \tabularnewline
1 & 0.466813 & 4.5738 & 7e-06 \tabularnewline
2 & 0.251515 & 2.4643 & 0.007753 \tabularnewline
3 & 0.091431 & 0.8958 & 0.18629 \tabularnewline
4 & -0.084974 & -0.8326 & 0.203575 \tabularnewline
5 & -0.174029 & -1.7051 & 0.045702 \tabularnewline
6 & -0.342451 & -3.3553 & 0.000568 \tabularnewline
7 & -0.204393 & -2.0026 & 0.024019 \tabularnewline
8 & -0.185663 & -1.8191 & 0.036006 \tabularnewline
9 & -0.08419 & -0.8249 & 0.205739 \tabularnewline
10 & 0.085998 & 0.8426 & 0.200771 \tabularnewline
11 & 0.25049 & 2.4543 & 0.007959 \tabularnewline
12 & 0.65312 & 6.3992 & 0 \tabularnewline
13 & 0.300279 & 2.9421 & 0.002043 \tabularnewline
14 & 0.110544 & 1.0831 & 0.140737 \tabularnewline
15 & -0.047159 & -0.4621 & 0.322541 \tabularnewline
16 & -0.172168 & -1.6869 & 0.047435 \tabularnewline
17 & -0.203443 & -1.9933 & 0.024532 \tabularnewline
18 & -0.370766 & -3.6327 & 0.000226 \tabularnewline
19 & -0.253037 & -2.4792 & 0.007455 \tabularnewline
20 & -0.197546 & -1.9355 & 0.027933 \tabularnewline
21 & -0.129383 & -1.2677 & 0.103988 \tabularnewline
22 & 0.011615 & 0.1138 & 0.454816 \tabularnewline
23 & 0.198726 & 1.9471 & 0.027222 \tabularnewline
24 & 0.517998 & 5.0753 & 1e-06 \tabularnewline
25 & 0.270646 & 2.6518 & 0.004684 \tabularnewline
26 & 0.136684 & 1.3392 & 0.09183 \tabularnewline
27 & -0.05033 & -0.4931 & 0.311523 \tabularnewline
28 & -0.173838 & -1.7033 & 0.045878 \tabularnewline
29 & -0.183251 & -1.7955 & 0.037861 \tabularnewline
30 & -0.345561 & -3.3858 & 0.000515 \tabularnewline
31 & -0.23791 & -2.331 & 0.010922 \tabularnewline
32 & -0.178086 & -1.7449 & 0.042103 \tabularnewline
33 & -0.104052 & -1.0195 & 0.155265 \tabularnewline
34 & -0.002921 & -0.0286 & 0.488612 \tabularnewline
35 & 0.134853 & 1.3213 & 0.094773 \tabularnewline
36 & 0.435288 & 4.2649 & 2.3e-05 \tabularnewline
37 & 0.22734 & 2.2275 & 0.014126 \tabularnewline
38 & 0.120112 & 1.1768 & 0.121083 \tabularnewline
39 & -0.052259 & -0.512 & 0.304903 \tabularnewline
40 & -0.155533 & -1.5239 & 0.06541 \tabularnewline
41 & -0.171648 & -1.6818 & 0.047929 \tabularnewline
42 & -0.285155 & -2.7939 & 0.003143 \tabularnewline
43 & -0.180034 & -1.764 & 0.04046 \tabularnewline
44 & -0.150647 & -1.476 & 0.071604 \tabularnewline
45 & -0.079537 & -0.7793 & 0.218861 \tabularnewline
46 & 0.014045 & 0.1376 & 0.445418 \tabularnewline
47 & 0.10888 & 1.0668 & 0.144369 \tabularnewline
48 & 0.367893 & 3.6046 & 0.000249 \tabularnewline
\hline
\end{tabular}
%Source: https://freestatistics.org/blog/index.php?pk=277823&T=1

[TABLE]
[ROW][C]Autocorrelation Function[/C][/ROW]
[ROW][C]Time lag k[/C][C]ACF(k)[/C][C]T-STAT[/C][C]P-value[/C][/ROW]
[ROW][C]1[/C][C]0.466813[/C][C]4.5738[/C][C]7e-06[/C][/ROW]
[ROW][C]2[/C][C]0.251515[/C][C]2.4643[/C][C]0.007753[/C][/ROW]
[ROW][C]3[/C][C]0.091431[/C][C]0.8958[/C][C]0.18629[/C][/ROW]
[ROW][C]4[/C][C]-0.084974[/C][C]-0.8326[/C][C]0.203575[/C][/ROW]
[ROW][C]5[/C][C]-0.174029[/C][C]-1.7051[/C][C]0.045702[/C][/ROW]
[ROW][C]6[/C][C]-0.342451[/C][C]-3.3553[/C][C]0.000568[/C][/ROW]
[ROW][C]7[/C][C]-0.204393[/C][C]-2.0026[/C][C]0.024019[/C][/ROW]
[ROW][C]8[/C][C]-0.185663[/C][C]-1.8191[/C][C]0.036006[/C][/ROW]
[ROW][C]9[/C][C]-0.08419[/C][C]-0.8249[/C][C]0.205739[/C][/ROW]
[ROW][C]10[/C][C]0.085998[/C][C]0.8426[/C][C]0.200771[/C][/ROW]
[ROW][C]11[/C][C]0.25049[/C][C]2.4543[/C][C]0.007959[/C][/ROW]
[ROW][C]12[/C][C]0.65312[/C][C]6.3992[/C][C]0[/C][/ROW]
[ROW][C]13[/C][C]0.300279[/C][C]2.9421[/C][C]0.002043[/C][/ROW]
[ROW][C]14[/C][C]0.110544[/C][C]1.0831[/C][C]0.140737[/C][/ROW]
[ROW][C]15[/C][C]-0.047159[/C][C]-0.4621[/C][C]0.322541[/C][/ROW]
[ROW][C]16[/C][C]-0.172168[/C][C]-1.6869[/C][C]0.047435[/C][/ROW]
[ROW][C]17[/C][C]-0.203443[/C][C]-1.9933[/C][C]0.024532[/C][/ROW]
[ROW][C]18[/C][C]-0.370766[/C][C]-3.6327[/C][C]0.000226[/C][/ROW]
[ROW][C]19[/C][C]-0.253037[/C][C]-2.4792[/C][C]0.007455[/C][/ROW]
[ROW][C]20[/C][C]-0.197546[/C][C]-1.9355[/C][C]0.027933[/C][/ROW]
[ROW][C]21[/C][C]-0.129383[/C][C]-1.2677[/C][C]0.103988[/C][/ROW]
[ROW][C]22[/C][C]0.011615[/C][C]0.1138[/C][C]0.454816[/C][/ROW]
[ROW][C]23[/C][C]0.198726[/C][C]1.9471[/C][C]0.027222[/C][/ROW]
[ROW][C]24[/C][C]0.517998[/C][C]5.0753[/C][C]1e-06[/C][/ROW]
[ROW][C]25[/C][C]0.270646[/C][C]2.6518[/C][C]0.004684[/C][/ROW]
[ROW][C]26[/C][C]0.136684[/C][C]1.3392[/C][C]0.09183[/C][/ROW]
[ROW][C]27[/C][C]-0.05033[/C][C]-0.4931[/C][C]0.311523[/C][/ROW]
[ROW][C]28[/C][C]-0.173838[/C][C]-1.7033[/C][C]0.045878[/C][/ROW]
[ROW][C]29[/C][C]-0.183251[/C][C]-1.7955[/C][C]0.037861[/C][/ROW]
[ROW][C]30[/C][C]-0.345561[/C][C]-3.3858[/C][C]0.000515[/C][/ROW]
[ROW][C]31[/C][C]-0.23791[/C][C]-2.331[/C][C]0.010922[/C][/ROW]
[ROW][C]32[/C][C]-0.178086[/C][C]-1.7449[/C][C]0.042103[/C][/ROW]
[ROW][C]33[/C][C]-0.104052[/C][C]-1.0195[/C][C]0.155265[/C][/ROW]
[ROW][C]34[/C][C]-0.002921[/C][C]-0.0286[/C][C]0.488612[/C][/ROW]
[ROW][C]35[/C][C]0.134853[/C][C]1.3213[/C][C]0.094773[/C][/ROW]
[ROW][C]36[/C][C]0.435288[/C][C]4.2649[/C][C]2.3e-05[/C][/ROW]
[ROW][C]37[/C][C]0.22734[/C][C]2.2275[/C][C]0.014126[/C][/ROW]
[ROW][C]38[/C][C]0.120112[/C][C]1.1768[/C][C]0.121083[/C][/ROW]
[ROW][C]39[/C][C]-0.052259[/C][C]-0.512[/C][C]0.304903[/C][/ROW]
[ROW][C]40[/C][C]-0.155533[/C][C]-1.5239[/C][C]0.06541[/C][/ROW]
[ROW][C]41[/C][C]-0.171648[/C][C]-1.6818[/C][C]0.047929[/C][/ROW]
[ROW][C]42[/C][C]-0.285155[/C][C]-2.7939[/C][C]0.003143[/C][/ROW]
[ROW][C]43[/C][C]-0.180034[/C][C]-1.764[/C][C]0.04046[/C][/ROW]
[ROW][C]44[/C][C]-0.150647[/C][C]-1.476[/C][C]0.071604[/C][/ROW]
[ROW][C]45[/C][C]-0.079537[/C][C]-0.7793[/C][C]0.218861[/C][/ROW]
[ROW][C]46[/C][C]0.014045[/C][C]0.1376[/C][C]0.445418[/C][/ROW]
[ROW][C]47[/C][C]0.10888[/C][C]1.0668[/C][C]0.144369[/C][/ROW]
[ROW][C]48[/C][C]0.367893[/C][C]3.6046[/C][C]0.000249[/C][/ROW]
[/TABLE]
Source: https://freestatistics.org/blog/index.php?pk=277823&T=1

Globally Unique Identifier (entire table): ba.freestatistics.org/blog/index.php?pk=277823&T=1

As an alternative you can also use a QR Code:  

The GUIDs for individual cells are displayed in the table below:

Autocorrelation Function
Time lag kACF(k)T-STATP-value
10.4668134.57387e-06
20.2515152.46430.007753
30.0914310.89580.18629
4-0.084974-0.83260.203575
5-0.174029-1.70510.045702
6-0.342451-3.35530.000568
7-0.204393-2.00260.024019
8-0.185663-1.81910.036006
9-0.08419-0.82490.205739
100.0859980.84260.200771
110.250492.45430.007959
120.653126.39920
130.3002792.94210.002043
140.1105441.08310.140737
15-0.047159-0.46210.322541
16-0.172168-1.68690.047435
17-0.203443-1.99330.024532
18-0.370766-3.63270.000226
19-0.253037-2.47920.007455
20-0.197546-1.93550.027933
21-0.129383-1.26770.103988
220.0116150.11380.454816
230.1987261.94710.027222
240.5179985.07531e-06
250.2706462.65180.004684
260.1366841.33920.09183
27-0.05033-0.49310.311523
28-0.173838-1.70330.045878
29-0.183251-1.79550.037861
30-0.345561-3.38580.000515
31-0.23791-2.3310.010922
32-0.178086-1.74490.042103
33-0.104052-1.01950.155265
34-0.002921-0.02860.488612
350.1348531.32130.094773
360.4352884.26492.3e-05
370.227342.22750.014126
380.1201121.17680.121083
39-0.052259-0.5120.304903
40-0.155533-1.52390.06541
41-0.171648-1.68180.047929
42-0.285155-2.79390.003143
43-0.180034-1.7640.04046
44-0.150647-1.4760.071604
45-0.079537-0.77930.218861
460.0140450.13760.445418
470.108881.06680.144369
480.3678933.60460.000249


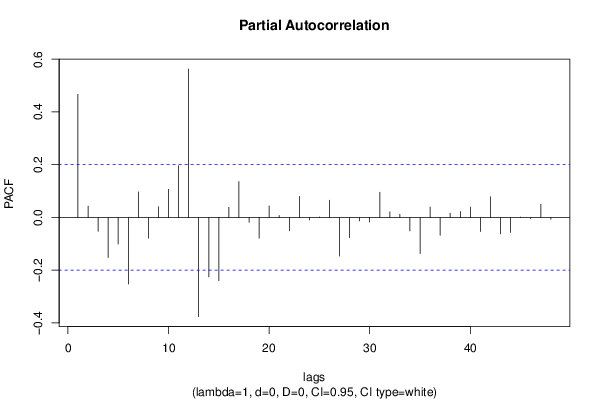
Partial Autocorrelation Function
Time lag kPACF(k)T-STATP-value
10.4668134.57387e-06
20.0429630.4210.337366
3-0.052509-0.51450.30405
4-0.151861-1.48790.070023
5-0.100718-0.98680.163102
6-0.252148-2.47050.007628
70.0966450.94690.173028
8-0.078547-0.76960.221714
90.0407270.3990.345374
100.1064851.04330.149706
110.1964191.92450.028626
120.5631715.51790
13-0.376137-3.68540.000189
14-0.225223-2.20670.014859
15-0.23964-2.3480.010464
160.038210.37440.354474
170.1359671.33220.092975
18-0.018388-0.18020.428701
19-0.078389-0.76810.22217
200.0434260.42550.335717
210.0074330.07280.471045
22-0.050122-0.49110.312239
230.0794970.77890.218976
24-0.009974-0.09770.461177
250.0019060.01870.492571
260.0650910.63780.262575
27-0.146432-1.43470.077307
28-0.076876-0.75320.226577
29-0.012948-0.12690.449657
30-0.017409-0.17060.43246
310.0957320.9380.175305
320.0211620.20730.41809
330.0124090.12160.451742
34-0.051049-0.50020.309049
35-0.136763-1.340.091704
360.0395640.38760.349569
37-0.067341-0.65980.25548
380.0157340.15420.438902
390.0223810.21930.413447
400.0392490.38460.350706
41-0.053469-0.52390.300783
420.0787470.77160.221137
43-0.062147-0.60890.272011
44-0.056522-0.55380.290503
450.0006890.00680.497313
46-0.003712-0.03640.485533
470.0497520.48750.313521
48-0.006677-0.06540.473989

\begin{tabular}{lllllllll}
\hline
Partial Autocorrelation Function \tabularnewline
Time lag k & PACF(k) & T-STAT & P-value \tabularnewline
1 & 0.466813 & 4.5738 & 7e-06 \tabularnewline
2 & 0.042963 & 0.421 & 0.337366 \tabularnewline
3 & -0.052509 & -0.5145 & 0.30405 \tabularnewline
4 & -0.151861 & -1.4879 & 0.070023 \tabularnewline
5 & -0.100718 & -0.9868 & 0.163102 \tabularnewline
6 & -0.252148 & -2.4705 & 0.007628 \tabularnewline
7 & 0.096645 & 0.9469 & 0.173028 \tabularnewline
8 & -0.078547 & -0.7696 & 0.221714 \tabularnewline
9 & 0.040727 & 0.399 & 0.345374 \tabularnewline
10 & 0.106485 & 1.0433 & 0.149706 \tabularnewline
11 & 0.196419 & 1.9245 & 0.028626 \tabularnewline
12 & 0.563171 & 5.5179 & 0 \tabularnewline
13 & -0.376137 & -3.6854 & 0.000189 \tabularnewline
14 & -0.225223 & -2.2067 & 0.014859 \tabularnewline
15 & -0.23964 & -2.348 & 0.010464 \tabularnewline
16 & 0.03821 & 0.3744 & 0.354474 \tabularnewline
17 & 0.135967 & 1.3322 & 0.092975 \tabularnewline
18 & -0.018388 & -0.1802 & 0.428701 \tabularnewline
19 & -0.078389 & -0.7681 & 0.22217 \tabularnewline
20 & 0.043426 & 0.4255 & 0.335717 \tabularnewline
21 & 0.007433 & 0.0728 & 0.471045 \tabularnewline
22 & -0.050122 & -0.4911 & 0.312239 \tabularnewline
23 & 0.079497 & 0.7789 & 0.218976 \tabularnewline
24 & -0.009974 & -0.0977 & 0.461177 \tabularnewline
25 & 0.001906 & 0.0187 & 0.492571 \tabularnewline
26 & 0.065091 & 0.6378 & 0.262575 \tabularnewline
27 & -0.146432 & -1.4347 & 0.077307 \tabularnewline
28 & -0.076876 & -0.7532 & 0.226577 \tabularnewline
29 & -0.012948 & -0.1269 & 0.449657 \tabularnewline
30 & -0.017409 & -0.1706 & 0.43246 \tabularnewline
31 & 0.095732 & 0.938 & 0.175305 \tabularnewline
32 & 0.021162 & 0.2073 & 0.41809 \tabularnewline
33 & 0.012409 & 0.1216 & 0.451742 \tabularnewline
34 & -0.051049 & -0.5002 & 0.309049 \tabularnewline
35 & -0.136763 & -1.34 & 0.091704 \tabularnewline
36 & 0.039564 & 0.3876 & 0.349569 \tabularnewline
37 & -0.067341 & -0.6598 & 0.25548 \tabularnewline
38 & 0.015734 & 0.1542 & 0.438902 \tabularnewline
39 & 0.022381 & 0.2193 & 0.413447 \tabularnewline
40 & 0.039249 & 0.3846 & 0.350706 \tabularnewline
41 & -0.053469 & -0.5239 & 0.300783 \tabularnewline
42 & 0.078747 & 0.7716 & 0.221137 \tabularnewline
43 & -0.062147 & -0.6089 & 0.272011 \tabularnewline
44 & -0.056522 & -0.5538 & 0.290503 \tabularnewline
45 & 0.000689 & 0.0068 & 0.497313 \tabularnewline
46 & -0.003712 & -0.0364 & 0.485533 \tabularnewline
47 & 0.049752 & 0.4875 & 0.313521 \tabularnewline
48 & -0.006677 & -0.0654 & 0.473989 \tabularnewline
\hline
\end{tabular}
%Source: https://freestatistics.org/blog/index.php?pk=277823&T=2

[TABLE]
[ROW][C]Partial Autocorrelation Function[/C][/ROW]
[ROW][C]Time lag k[/C][C]PACF(k)[/C][C]T-STAT[/C][C]P-value[/C][/ROW]
[ROW][C]1[/C][C]0.466813[/C][C]4.5738[/C][C]7e-06[/C][/ROW]
[ROW][C]2[/C][C]0.042963[/C][C]0.421[/C][C]0.337366[/C][/ROW]
[ROW][C]3[/C][C]-0.052509[/C][C]-0.5145[/C][C]0.30405[/C][/ROW]
[ROW][C]4[/C][C]-0.151861[/C][C]-1.4879[/C][C]0.070023[/C][/ROW]
[ROW][C]5[/C][C]-0.100718[/C][C]-0.9868[/C][C]0.163102[/C][/ROW]
[ROW][C]6[/C][C]-0.252148[/C][C]-2.4705[/C][C]0.007628[/C][/ROW]
[ROW][C]7[/C][C]0.096645[/C][C]0.9469[/C][C]0.173028[/C][/ROW]
[ROW][C]8[/C][C]-0.078547[/C][C]-0.7696[/C][C]0.221714[/C][/ROW]
[ROW][C]9[/C][C]0.040727[/C][C]0.399[/C][C]0.345374[/C][/ROW]
[ROW][C]10[/C][C]0.106485[/C][C]1.0433[/C][C]0.149706[/C][/ROW]
[ROW][C]11[/C][C]0.196419[/C][C]1.9245[/C][C]0.028626[/C][/ROW]
[ROW][C]12[/C][C]0.563171[/C][C]5.5179[/C][C]0[/C][/ROW]
[ROW][C]13[/C][C]-0.376137[/C][C]-3.6854[/C][C]0.000189[/C][/ROW]
[ROW][C]14[/C][C]-0.225223[/C][C]-2.2067[/C][C]0.014859[/C][/ROW]
[ROW][C]15[/C][C]-0.23964[/C][C]-2.348[/C][C]0.010464[/C][/ROW]
[ROW][C]16[/C][C]0.03821[/C][C]0.3744[/C][C]0.354474[/C][/ROW]
[ROW][C]17[/C][C]0.135967[/C][C]1.3322[/C][C]0.092975[/C][/ROW]
[ROW][C]18[/C][C]-0.018388[/C][C]-0.1802[/C][C]0.428701[/C][/ROW]
[ROW][C]19[/C][C]-0.078389[/C][C]-0.7681[/C][C]0.22217[/C][/ROW]
[ROW][C]20[/C][C]0.043426[/C][C]0.4255[/C][C]0.335717[/C][/ROW]
[ROW][C]21[/C][C]0.007433[/C][C]0.0728[/C][C]0.471045[/C][/ROW]
[ROW][C]22[/C][C]-0.050122[/C][C]-0.4911[/C][C]0.312239[/C][/ROW]
[ROW][C]23[/C][C]0.079497[/C][C]0.7789[/C][C]0.218976[/C][/ROW]
[ROW][C]24[/C][C]-0.009974[/C][C]-0.0977[/C][C]0.461177[/C][/ROW]
[ROW][C]25[/C][C]0.001906[/C][C]0.0187[/C][C]0.492571[/C][/ROW]
[ROW][C]26[/C][C]0.065091[/C][C]0.6378[/C][C]0.262575[/C][/ROW]
[ROW][C]27[/C][C]-0.146432[/C][C]-1.4347[/C][C]0.077307[/C][/ROW]
[ROW][C]28[/C][C]-0.076876[/C][C]-0.7532[/C][C]0.226577[/C][/ROW]
[ROW][C]29[/C][C]-0.012948[/C][C]-0.1269[/C][C]0.449657[/C][/ROW]
[ROW][C]30[/C][C]-0.017409[/C][C]-0.1706[/C][C]0.43246[/C][/ROW]
[ROW][C]31[/C][C]0.095732[/C][C]0.938[/C][C]0.175305[/C][/ROW]
[ROW][C]32[/C][C]0.021162[/C][C]0.2073[/C][C]0.41809[/C][/ROW]
[ROW][C]33[/C][C]0.012409[/C][C]0.1216[/C][C]0.451742[/C][/ROW]
[ROW][C]34[/C][C]-0.051049[/C][C]-0.5002[/C][C]0.309049[/C][/ROW]
[ROW][C]35[/C][C]-0.136763[/C][C]-1.34[/C][C]0.091704[/C][/ROW]
[ROW][C]36[/C][C]0.039564[/C][C]0.3876[/C][C]0.349569[/C][/ROW]
[ROW][C]37[/C][C]-0.067341[/C][C]-0.6598[/C][C]0.25548[/C][/ROW]
[ROW][C]38[/C][C]0.015734[/C][C]0.1542[/C][C]0.438902[/C][/ROW]
[ROW][C]39[/C][C]0.022381[/C][C]0.2193[/C][C]0.413447[/C][/ROW]
[ROW][C]40[/C][C]0.039249[/C][C]0.3846[/C][C]0.350706[/C][/ROW]
[ROW][C]41[/C][C]-0.053469[/C][C]-0.5239[/C][C]0.300783[/C][/ROW]
[ROW][C]42[/C][C]0.078747[/C][C]0.7716[/C][C]0.221137[/C][/ROW]
[ROW][C]43[/C][C]-0.062147[/C][C]-0.6089[/C][C]0.272011[/C][/ROW]
[ROW][C]44[/C][C]-0.056522[/C][C]-0.5538[/C][C]0.290503[/C][/ROW]
[ROW][C]45[/C][C]0.000689[/C][C]0.0068[/C][C]0.497313[/C][/ROW]
[ROW][C]46[/C][C]-0.003712[/C][C]-0.0364[/C][C]0.485533[/C][/ROW]
[ROW][C]47[/C][C]0.049752[/C][C]0.4875[/C][C]0.313521[/C][/ROW]
[ROW][C]48[/C][C]-0.006677[/C][C]-0.0654[/C][C]0.473989[/C][/ROW]
[/TABLE]
Source: https://freestatistics.org/blog/index.php?pk=277823&T=2

Globally Unique Identifier (entire table): ba.freestatistics.org/blog/index.php?pk=277823&T=2

As an alternative you can also use a QR Code:  

The GUIDs for individual cells are displayed in the table below:

Partial Autocorrelation Function
Time lag kPACF(k)T-STATP-value
10.4668134.57387e-06
20.0429630.4210.337366
3-0.052509-0.51450.30405
4-0.151861-1.48790.070023
5-0.100718-0.98680.163102
6-0.252148-2.47050.007628
70.0966450.94690.173028
8-0.078547-0.76960.221714
90.0407270.3990.345374
100.1064851.04330.149706
110.1964191.92450.028626
120.5631715.51790
13-0.376137-3.68540.000189
14-0.225223-2.20670.014859
15-0.23964-2.3480.010464
160.038210.37440.354474
170.1359671.33220.092975
18-0.018388-0.18020.428701
19-0.078389-0.76810.22217
200.0434260.42550.335717
210.0074330.07280.471045
22-0.050122-0.49110.312239
230.0794970.77890.218976
24-0.009974-0.09770.461177
250.0019060.01870.492571
260.0650910.63780.262575
27-0.146432-1.43470.077307
28-0.076876-0.75320.226577
29-0.012948-0.12690.449657
30-0.017409-0.17060.43246
310.0957320.9380.175305
320.0211620.20730.41809
330.0124090.12160.451742
34-0.051049-0.50020.309049
35-0.136763-1.340.091704
360.0395640.38760.349569
37-0.067341-0.65980.25548
380.0157340.15420.438902
390.0223810.21930.413447
400.0392490.38460.350706
41-0.053469-0.52390.300783
420.0787470.77160.221137
43-0.062147-0.60890.272011
44-0.056522-0.55380.290503
450.0006890.00680.497313
46-0.003712-0.03640.485533
470.0497520.48750.313521
48-0.006677-0.06540.473989


Parameters (Session):
par1 = 48 ; par2 = 1 ; par3 = 0 ; par4 = 0 ; par5 = 12 ; par6 = White Noise ; par7 = 0.95 ;
Parameters (R input):
par1 = 48 ; par2 = 1 ; par3 = 0 ; par4 = 0 ; par5 = 12 ; par6 = White Noise ; par7 = 0.95 ; par8 = ;
R code (references can be found in the software module):
if (par1 == 'Default') {
par1 = 10*log10(length(x))
} else {
par1 <- as.numeric(par1)
}
par2 <- as.numeric(par2)
par3 <- as.numeric(par3)
par4 <- as.numeric(par4)
par5 <- as.numeric(par5)
if (par6 == 'White Noise') par6 <- 'white' else par6 <- 'ma'
par7 <- as.numeric(par7)
if (par8 != '') par8 <- as.numeric(par8)
ox <- x
if (par8 == '') {
if (par2 == 0) {
x <- log(x)
} else {
x <- (x ^ par2 - 1) / par2
}
} else {
x <- log(x,base=par8)
}
if (par3 > 0) x <- diff(x,lag=1,difference=par3)
if (par4 > 0) x <- diff(x,lag=par5,difference=par4)
bitmap(file='picts.png')
op <- par(mfrow=c(2,1))
plot(ox,type='l',main='Original Time Series',xlab='time',ylab='value')
if (par8=='') {
mytitle <- paste('Working Time Series (lambda=',par2,', d=',par3,', D=',par4,')',sep='')
mysub <- paste('(lambda=',par2,', d=',par3,', D=',par4,', CI=', par7, ', CI type=',par6,')',sep='')
} else {
mytitle <- paste('Working Time Series (base=',par8,', d=',par3,', D=',par4,')',sep='')
mysub <- paste('(base=',par8,', d=',par3,', D=',par4,', CI=', par7, ', CI type=',par6,')',sep='')
}
plot(x,type='l', main=mytitle,xlab='time',ylab='value')
par(op)
dev.off()
bitmap(file='pic1.png')
racf <- acf(x, par1, main='Autocorrelation', xlab='time lag', ylab='ACF', ci.type=par6, ci=par7, sub=mysub)
dev.off()
bitmap(file='pic2.png')
rpacf <- pacf(x,par1,main='Partial Autocorrelation',xlab='lags',ylab='PACF',sub=mysub)
dev.off()
(myacf <- c(racf$acf))
(mypacf <- c(rpacf$acf))
lengthx <- length(x)
sqrtn <- sqrt(lengthx)
load(file='createtable')
a<-table.start()
a<-table.row.start(a)
a<-table.element(a,'Autocorrelation Function',4,TRUE)
a<-table.row.end(a)
a<-table.row.start(a)
a<-table.element(a,'Time lag k',header=TRUE)
a<-table.element(a,hyperlink('basics.htm','ACF(k)','click here for more information about the Autocorrelation Function'),header=TRUE)
a<-table.element(a,'T-STAT',header=TRUE)
a<-table.element(a,'P-value',header=TRUE)
a<-table.row.end(a)
for (i in 2:(par1+1)) {
a<-table.row.start(a)
a<-table.element(a,i-1,header=TRUE)
a<-table.element(a,round(myacf[i],6))
mytstat <- myacf[i]*sqrtn
a<-table.element(a,round(mytstat,4))
a<-table.element(a,round(1-pt(abs(mytstat),lengthx),6))
a<-table.row.end(a)
}
a<-table.end(a)
table.save(a,file='mytable.tab')
a<-table.start()
a<-table.row.start(a)
a<-table.element(a,'Partial Autocorrelation Function',4,TRUE)
a<-table.row.end(a)
a<-table.row.start(a)
a<-table.element(a,'Time lag k',header=TRUE)
a<-table.element(a,hyperlink('basics.htm','PACF(k)','click here for more information about the Partial Autocorrelation Function'),header=TRUE)
a<-table.element(a,'T-STAT',header=TRUE)
a<-table.element(a,'P-value',header=TRUE)
a<-table.row.end(a)
for (i in 1:par1) {
a<-table.row.start(a)
a<-table.element(a,i,header=TRUE)
a<-table.element(a,round(mypacf[i],6))
mytstat <- mypacf[i]*sqrtn
a<-table.element(a,round(mytstat,4))
a<-table.element(a,round(1-pt(abs(mytstat),lengthx),6))
a<-table.row.end(a)
}
a<-table.end(a)
table.save(a,file='mytable1.tab')