Free Statistics

of Irreproducible Research!

Author's title

Author*Unverified author*
R Software Modulerwasp_autocorrelation.wasp
Title produced by software(Partial) Autocorrelation Function
Date of computationMon, 02 Mar 2015 14:59:29 +0000
Cite this page as followsStatistical Computations at FreeStatistics.org, Office for Research Development and Education, URL https://freestatistics.org/blog/index.php?v=date/2015/Mar/02/t1425308428jkoppil4mj46bz2.htm/, Retrieved Sun, 19 May 2024 11:11:05 +0000
Statistical Computations at FreeStatistics.org, Office for Research Development and Education, URL https://freestatistics.org/blog/index.php?pk=277819, Retrieved Sun, 19 May 2024 11:11:05 +0000
QR Codes:

Original text written by user:
IsPrivate?No (this computation is public)
User-defined keywords
Estimated Impact71
Family? (F = Feedback message, R = changed R code, M = changed R Module, P = changed Parameters, D = changed Data)
-       [(Partial) Autocorrelation Function] [] [2015-03-02 14:59:29] [a916b42d6b56a629542ed1ac6e46ec84] [Current]
Feedback Forum

Post a new message
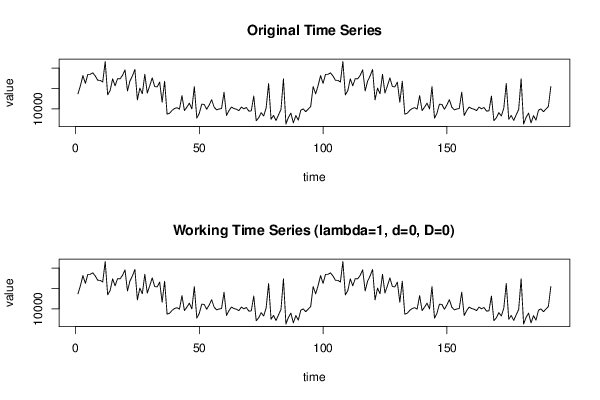
Dataseries X:
13671
15698
18150
16245
18479
18479
18819
18059
17004
16981
16578
21604
13419
14487
17349
15646
17419
17358
18221
19554
14386
16833
18067
19662
12192
15081
13698
18474
13871
15669
17597
15469
15374
16568
11619
16780
8700
8906
9612
10073
10275
9921
13237
9572
10425
11385
9970
15456
7708
8892
11145
11069
9893
10929
12240
10411
9747
9950
10079
14064
8368
9558
10432
10068
9915
9549
10433
10009
10327
9453
9494
13133
7082
7805
9064
8236
10182
16210
7451
8384
7143
8507
9833
17364
6260
7897
8933
6554
8333
7224
9659
9977
9289
9929
10576
15463


Summary of computational transaction
Raw Inputview raw input (R code)
Raw Outputview raw output of R engine
Computing time2 seconds
R Server'Sir Ronald Aylmer Fisher' @ fisher.wessa.net

\begin{tabular}{lllllllll}
\hline
Summary of computational transaction \tabularnewline
Raw Input & view raw input (R code)  \tabularnewline
Raw Output & view raw output of R engine  \tabularnewline
Computing time & 2 seconds \tabularnewline
R Server & 'Sir Ronald Aylmer Fisher' @ fisher.wessa.net \tabularnewline
\hline
\end{tabular}
%Source: https://freestatistics.org/blog/index.php?pk=277819&T=0

[TABLE]
[ROW][C]Summary of computational transaction[/C][/ROW]
[ROW][C]Raw Input[/C][C]view raw input (R code) [/C][/ROW]
[ROW][C]Raw Output[/C][C]view raw output of R engine [/C][/ROW]
[ROW][C]Computing time[/C][C]2 seconds[/C][/ROW]
[ROW][C]R Server[/C][C]'Sir Ronald Aylmer Fisher' @ fisher.wessa.net[/C][/ROW]
[/TABLE]
Source: https://freestatistics.org/blog/index.php?pk=277819&T=0

Globally Unique Identifier (entire table): ba.freestatistics.org/blog/index.php?pk=277819&T=0

As an alternative you can also use a QR Code:  

The GUIDs for individual cells are displayed in the table below:

Summary of computational transaction
Raw Inputview raw input (R code)
Raw Outputview raw output of R engine
Computing time2 seconds
R Server'Sir Ronald Aylmer Fisher' @ fisher.wessa.net


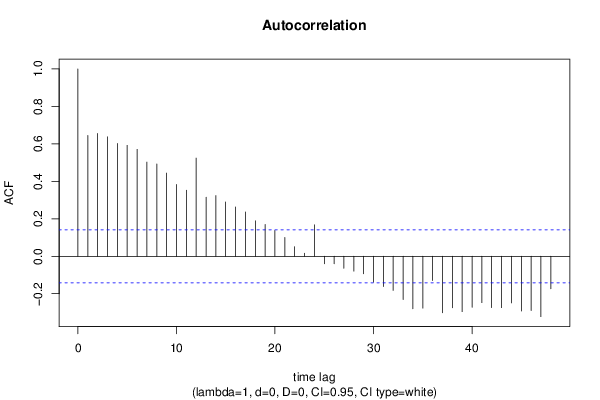
Autocorrelation Function
Time lag kACF(k)T-STATP-value
10.6443988.9290
20.6552179.0790
30.6375898.83470
40.6024098.34720
50.5922398.20630
60.5706627.90730
70.5027586.96640
80.4927186.82730
90.4438766.15050
100.383125.30870
110.352654.88651e-06
120.5239017.25940
130.3147234.36091.1e-05
140.323914.48826e-06
150.2896574.01364.3e-05
160.2628423.64210.000174
170.2364953.2770.000623
180.1889422.61810.004774
190.169282.34560.010008
200.1376321.90710.029001
210.1007061.39540.08225
220.051110.70820.239839
230.0165290.2290.409542
240.1676782.32340.010602
25-0.039673-0.54970.291574
26-0.039561-0.54820.292103
27-0.063792-0.88390.188922
28-0.07929-1.09870.136643
29-0.093632-1.29740.098026
30-0.138269-1.91590.028431
31-0.161499-2.23780.013192
32-0.182214-2.52480.006192
33-0.23102-3.20110.000801
34-0.279859-3.87787.2e-05
35-0.276832-3.83598.5e-05
36-0.12895-1.78680.037775
37-0.301328-4.17532.3e-05
38-0.274697-3.80639.5e-05
39-0.295628-4.09633.1e-05
40-0.272136-3.77080.000108
41-0.247397-3.4280.000372
42-0.274001-3.79679.8e-05
43-0.274378-3.80199.6e-05
44-0.248863-3.44840.000347
45-0.29237-4.05123.7e-05
46-0.289644-4.01344.3e-05
47-0.322328-4.46637e-06
48-0.173534-2.40460.008571

\begin{tabular}{lllllllll}
\hline
Autocorrelation Function \tabularnewline
Time lag k & ACF(k) & T-STAT & P-value \tabularnewline
1 & 0.644398 & 8.929 & 0 \tabularnewline
2 & 0.655217 & 9.079 & 0 \tabularnewline
3 & 0.637589 & 8.8347 & 0 \tabularnewline
4 & 0.602409 & 8.3472 & 0 \tabularnewline
5 & 0.592239 & 8.2063 & 0 \tabularnewline
6 & 0.570662 & 7.9073 & 0 \tabularnewline
7 & 0.502758 & 6.9664 & 0 \tabularnewline
8 & 0.492718 & 6.8273 & 0 \tabularnewline
9 & 0.443876 & 6.1505 & 0 \tabularnewline
10 & 0.38312 & 5.3087 & 0 \tabularnewline
11 & 0.35265 & 4.8865 & 1e-06 \tabularnewline
12 & 0.523901 & 7.2594 & 0 \tabularnewline
13 & 0.314723 & 4.3609 & 1.1e-05 \tabularnewline
14 & 0.32391 & 4.4882 & 6e-06 \tabularnewline
15 & 0.289657 & 4.0136 & 4.3e-05 \tabularnewline
16 & 0.262842 & 3.6421 & 0.000174 \tabularnewline
17 & 0.236495 & 3.277 & 0.000623 \tabularnewline
18 & 0.188942 & 2.6181 & 0.004774 \tabularnewline
19 & 0.16928 & 2.3456 & 0.010008 \tabularnewline
20 & 0.137632 & 1.9071 & 0.029001 \tabularnewline
21 & 0.100706 & 1.3954 & 0.08225 \tabularnewline
22 & 0.05111 & 0.7082 & 0.239839 \tabularnewline
23 & 0.016529 & 0.229 & 0.409542 \tabularnewline
24 & 0.167678 & 2.3234 & 0.010602 \tabularnewline
25 & -0.039673 & -0.5497 & 0.291574 \tabularnewline
26 & -0.039561 & -0.5482 & 0.292103 \tabularnewline
27 & -0.063792 & -0.8839 & 0.188922 \tabularnewline
28 & -0.07929 & -1.0987 & 0.136643 \tabularnewline
29 & -0.093632 & -1.2974 & 0.098026 \tabularnewline
30 & -0.138269 & -1.9159 & 0.028431 \tabularnewline
31 & -0.161499 & -2.2378 & 0.013192 \tabularnewline
32 & -0.182214 & -2.5248 & 0.006192 \tabularnewline
33 & -0.23102 & -3.2011 & 0.000801 \tabularnewline
34 & -0.279859 & -3.8778 & 7.2e-05 \tabularnewline
35 & -0.276832 & -3.8359 & 8.5e-05 \tabularnewline
36 & -0.12895 & -1.7868 & 0.037775 \tabularnewline
37 & -0.301328 & -4.1753 & 2.3e-05 \tabularnewline
38 & -0.274697 & -3.8063 & 9.5e-05 \tabularnewline
39 & -0.295628 & -4.0963 & 3.1e-05 \tabularnewline
40 & -0.272136 & -3.7708 & 0.000108 \tabularnewline
41 & -0.247397 & -3.428 & 0.000372 \tabularnewline
42 & -0.274001 & -3.7967 & 9.8e-05 \tabularnewline
43 & -0.274378 & -3.8019 & 9.6e-05 \tabularnewline
44 & -0.248863 & -3.4484 & 0.000347 \tabularnewline
45 & -0.29237 & -4.0512 & 3.7e-05 \tabularnewline
46 & -0.289644 & -4.0134 & 4.3e-05 \tabularnewline
47 & -0.322328 & -4.4663 & 7e-06 \tabularnewline
48 & -0.173534 & -2.4046 & 0.008571 \tabularnewline
\hline
\end{tabular}
%Source: https://freestatistics.org/blog/index.php?pk=277819&T=1

[TABLE]
[ROW][C]Autocorrelation Function[/C][/ROW]
[ROW][C]Time lag k[/C][C]ACF(k)[/C][C]T-STAT[/C][C]P-value[/C][/ROW]
[ROW][C]1[/C][C]0.644398[/C][C]8.929[/C][C]0[/C][/ROW]
[ROW][C]2[/C][C]0.655217[/C][C]9.079[/C][C]0[/C][/ROW]
[ROW][C]3[/C][C]0.637589[/C][C]8.8347[/C][C]0[/C][/ROW]
[ROW][C]4[/C][C]0.602409[/C][C]8.3472[/C][C]0[/C][/ROW]
[ROW][C]5[/C][C]0.592239[/C][C]8.2063[/C][C]0[/C][/ROW]
[ROW][C]6[/C][C]0.570662[/C][C]7.9073[/C][C]0[/C][/ROW]
[ROW][C]7[/C][C]0.502758[/C][C]6.9664[/C][C]0[/C][/ROW]
[ROW][C]8[/C][C]0.492718[/C][C]6.8273[/C][C]0[/C][/ROW]
[ROW][C]9[/C][C]0.443876[/C][C]6.1505[/C][C]0[/C][/ROW]
[ROW][C]10[/C][C]0.38312[/C][C]5.3087[/C][C]0[/C][/ROW]
[ROW][C]11[/C][C]0.35265[/C][C]4.8865[/C][C]1e-06[/C][/ROW]
[ROW][C]12[/C][C]0.523901[/C][C]7.2594[/C][C]0[/C][/ROW]
[ROW][C]13[/C][C]0.314723[/C][C]4.3609[/C][C]1.1e-05[/C][/ROW]
[ROW][C]14[/C][C]0.32391[/C][C]4.4882[/C][C]6e-06[/C][/ROW]
[ROW][C]15[/C][C]0.289657[/C][C]4.0136[/C][C]4.3e-05[/C][/ROW]
[ROW][C]16[/C][C]0.262842[/C][C]3.6421[/C][C]0.000174[/C][/ROW]
[ROW][C]17[/C][C]0.236495[/C][C]3.277[/C][C]0.000623[/C][/ROW]
[ROW][C]18[/C][C]0.188942[/C][C]2.6181[/C][C]0.004774[/C][/ROW]
[ROW][C]19[/C][C]0.16928[/C][C]2.3456[/C][C]0.010008[/C][/ROW]
[ROW][C]20[/C][C]0.137632[/C][C]1.9071[/C][C]0.029001[/C][/ROW]
[ROW][C]21[/C][C]0.100706[/C][C]1.3954[/C][C]0.08225[/C][/ROW]
[ROW][C]22[/C][C]0.05111[/C][C]0.7082[/C][C]0.239839[/C][/ROW]
[ROW][C]23[/C][C]0.016529[/C][C]0.229[/C][C]0.409542[/C][/ROW]
[ROW][C]24[/C][C]0.167678[/C][C]2.3234[/C][C]0.010602[/C][/ROW]
[ROW][C]25[/C][C]-0.039673[/C][C]-0.5497[/C][C]0.291574[/C][/ROW]
[ROW][C]26[/C][C]-0.039561[/C][C]-0.5482[/C][C]0.292103[/C][/ROW]
[ROW][C]27[/C][C]-0.063792[/C][C]-0.8839[/C][C]0.188922[/C][/ROW]
[ROW][C]28[/C][C]-0.07929[/C][C]-1.0987[/C][C]0.136643[/C][/ROW]
[ROW][C]29[/C][C]-0.093632[/C][C]-1.2974[/C][C]0.098026[/C][/ROW]
[ROW][C]30[/C][C]-0.138269[/C][C]-1.9159[/C][C]0.028431[/C][/ROW]
[ROW][C]31[/C][C]-0.161499[/C][C]-2.2378[/C][C]0.013192[/C][/ROW]
[ROW][C]32[/C][C]-0.182214[/C][C]-2.5248[/C][C]0.006192[/C][/ROW]
[ROW][C]33[/C][C]-0.23102[/C][C]-3.2011[/C][C]0.000801[/C][/ROW]
[ROW][C]34[/C][C]-0.279859[/C][C]-3.8778[/C][C]7.2e-05[/C][/ROW]
[ROW][C]35[/C][C]-0.276832[/C][C]-3.8359[/C][C]8.5e-05[/C][/ROW]
[ROW][C]36[/C][C]-0.12895[/C][C]-1.7868[/C][C]0.037775[/C][/ROW]
[ROW][C]37[/C][C]-0.301328[/C][C]-4.1753[/C][C]2.3e-05[/C][/ROW]
[ROW][C]38[/C][C]-0.274697[/C][C]-3.8063[/C][C]9.5e-05[/C][/ROW]
[ROW][C]39[/C][C]-0.295628[/C][C]-4.0963[/C][C]3.1e-05[/C][/ROW]
[ROW][C]40[/C][C]-0.272136[/C][C]-3.7708[/C][C]0.000108[/C][/ROW]
[ROW][C]41[/C][C]-0.247397[/C][C]-3.428[/C][C]0.000372[/C][/ROW]
[ROW][C]42[/C][C]-0.274001[/C][C]-3.7967[/C][C]9.8e-05[/C][/ROW]
[ROW][C]43[/C][C]-0.274378[/C][C]-3.8019[/C][C]9.6e-05[/C][/ROW]
[ROW][C]44[/C][C]-0.248863[/C][C]-3.4484[/C][C]0.000347[/C][/ROW]
[ROW][C]45[/C][C]-0.29237[/C][C]-4.0512[/C][C]3.7e-05[/C][/ROW]
[ROW][C]46[/C][C]-0.289644[/C][C]-4.0134[/C][C]4.3e-05[/C][/ROW]
[ROW][C]47[/C][C]-0.322328[/C][C]-4.4663[/C][C]7e-06[/C][/ROW]
[ROW][C]48[/C][C]-0.173534[/C][C]-2.4046[/C][C]0.008571[/C][/ROW]
[/TABLE]
Source: https://freestatistics.org/blog/index.php?pk=277819&T=1

Globally Unique Identifier (entire table): ba.freestatistics.org/blog/index.php?pk=277819&T=1

As an alternative you can also use a QR Code:  

The GUIDs for individual cells are displayed in the table below:

Autocorrelation Function
Time lag kACF(k)T-STATP-value
10.6443988.9290
20.6552179.0790
30.6375898.83470
40.6024098.34720
50.5922398.20630
60.5706627.90730
70.5027586.96640
80.4927186.82730
90.4438766.15050
100.383125.30870
110.352654.88651e-06
120.5239017.25940
130.3147234.36091.1e-05
140.323914.48826e-06
150.2896574.01364.3e-05
160.2628423.64210.000174
170.2364953.2770.000623
180.1889422.61810.004774
190.169282.34560.010008
200.1376321.90710.029001
210.1007061.39540.08225
220.051110.70820.239839
230.0165290.2290.409542
240.1676782.32340.010602
25-0.039673-0.54970.291574
26-0.039561-0.54820.292103
27-0.063792-0.88390.188922
28-0.07929-1.09870.136643
29-0.093632-1.29740.098026
30-0.138269-1.91590.028431
31-0.161499-2.23780.013192
32-0.182214-2.52480.006192
33-0.23102-3.20110.000801
34-0.279859-3.87787.2e-05
35-0.276832-3.83598.5e-05
36-0.12895-1.78680.037775
37-0.301328-4.17532.3e-05
38-0.274697-3.80639.5e-05
39-0.295628-4.09633.1e-05
40-0.272136-3.77080.000108
41-0.247397-3.4280.000372
42-0.274001-3.79679.8e-05
43-0.274378-3.80199.6e-05
44-0.248863-3.44840.000347
45-0.29237-4.05123.7e-05
46-0.289644-4.01344.3e-05
47-0.322328-4.46637e-06
48-0.173534-2.40460.008571


Partial Autocorrelation Function
Time lag kPACF(k)T-STATP-value
10.6443988.9290
20.4103775.68640
30.2553953.53890.000252
40.1256161.74060.041679
50.101681.40890.080238
60.0634260.87890.19029
7-0.070556-0.97770.164737
8-0.017972-0.2490.401804
9-0.056376-0.78120.217832
10-0.110354-1.52910.063942
11-0.071842-0.99550.160382
120.4441626.15450
13-0.199846-2.76910.003086
14-0.112923-1.56470.05965
15-0.058273-0.80750.210203
16-0.003548-0.04920.480419
17-0.109486-1.51710.065445
18-0.121539-1.68410.046894
190.0765571.06080.145056
20-0.0702-0.97270.165959
21-0.022261-0.30850.379035
220.0313730.43470.33213
230.0111490.15450.438695
240.1782262.46960.0072
25-0.227215-3.14840.000952
26-0.143195-1.98420.024331
27-0.061-0.84520.199516
28-0.004693-0.0650.474108
29-0.022331-0.30940.378664
30-0.026003-0.36030.359505
310.0223620.30990.378505
32-0.029596-0.41010.341097
33-0.084179-1.16640.122445
34-0.042056-0.58270.280376
350.0524870.72730.233971
360.12861.78190.03817
37-0.092075-1.27580.101779
38-0.029206-0.40470.343078
390.0034350.04760.481042
400.0606210.840.20098
410.0478060.66240.254247
420.0070980.09840.460878
43-0.050006-0.69290.244605
440.0172830.23950.405494
45-0.051632-0.71540.237604
460.0812751.12620.130749
47-0.133898-1.85530.03254
480.009520.13190.447594

\begin{tabular}{lllllllll}
\hline
Partial Autocorrelation Function \tabularnewline
Time lag k & PACF(k) & T-STAT & P-value \tabularnewline
1 & 0.644398 & 8.929 & 0 \tabularnewline
2 & 0.410377 & 5.6864 & 0 \tabularnewline
3 & 0.255395 & 3.5389 & 0.000252 \tabularnewline
4 & 0.125616 & 1.7406 & 0.041679 \tabularnewline
5 & 0.10168 & 1.4089 & 0.080238 \tabularnewline
6 & 0.063426 & 0.8789 & 0.19029 \tabularnewline
7 & -0.070556 & -0.9777 & 0.164737 \tabularnewline
8 & -0.017972 & -0.249 & 0.401804 \tabularnewline
9 & -0.056376 & -0.7812 & 0.217832 \tabularnewline
10 & -0.110354 & -1.5291 & 0.063942 \tabularnewline
11 & -0.071842 & -0.9955 & 0.160382 \tabularnewline
12 & 0.444162 & 6.1545 & 0 \tabularnewline
13 & -0.199846 & -2.7691 & 0.003086 \tabularnewline
14 & -0.112923 & -1.5647 & 0.05965 \tabularnewline
15 & -0.058273 & -0.8075 & 0.210203 \tabularnewline
16 & -0.003548 & -0.0492 & 0.480419 \tabularnewline
17 & -0.109486 & -1.5171 & 0.065445 \tabularnewline
18 & -0.121539 & -1.6841 & 0.046894 \tabularnewline
19 & 0.076557 & 1.0608 & 0.145056 \tabularnewline
20 & -0.0702 & -0.9727 & 0.165959 \tabularnewline
21 & -0.022261 & -0.3085 & 0.379035 \tabularnewline
22 & 0.031373 & 0.4347 & 0.33213 \tabularnewline
23 & 0.011149 & 0.1545 & 0.438695 \tabularnewline
24 & 0.178226 & 2.4696 & 0.0072 \tabularnewline
25 & -0.227215 & -3.1484 & 0.000952 \tabularnewline
26 & -0.143195 & -1.9842 & 0.024331 \tabularnewline
27 & -0.061 & -0.8452 & 0.199516 \tabularnewline
28 & -0.004693 & -0.065 & 0.474108 \tabularnewline
29 & -0.022331 & -0.3094 & 0.378664 \tabularnewline
30 & -0.026003 & -0.3603 & 0.359505 \tabularnewline
31 & 0.022362 & 0.3099 & 0.378505 \tabularnewline
32 & -0.029596 & -0.4101 & 0.341097 \tabularnewline
33 & -0.084179 & -1.1664 & 0.122445 \tabularnewline
34 & -0.042056 & -0.5827 & 0.280376 \tabularnewline
35 & 0.052487 & 0.7273 & 0.233971 \tabularnewline
36 & 0.1286 & 1.7819 & 0.03817 \tabularnewline
37 & -0.092075 & -1.2758 & 0.101779 \tabularnewline
38 & -0.029206 & -0.4047 & 0.343078 \tabularnewline
39 & 0.003435 & 0.0476 & 0.481042 \tabularnewline
40 & 0.060621 & 0.84 & 0.20098 \tabularnewline
41 & 0.047806 & 0.6624 & 0.254247 \tabularnewline
42 & 0.007098 & 0.0984 & 0.460878 \tabularnewline
43 & -0.050006 & -0.6929 & 0.244605 \tabularnewline
44 & 0.017283 & 0.2395 & 0.405494 \tabularnewline
45 & -0.051632 & -0.7154 & 0.237604 \tabularnewline
46 & 0.081275 & 1.1262 & 0.130749 \tabularnewline
47 & -0.133898 & -1.8553 & 0.03254 \tabularnewline
48 & 0.00952 & 0.1319 & 0.447594 \tabularnewline
\hline
\end{tabular}
%Source: https://freestatistics.org/blog/index.php?pk=277819&T=2

[TABLE]
[ROW][C]Partial Autocorrelation Function[/C][/ROW]
[ROW][C]Time lag k[/C][C]PACF(k)[/C][C]T-STAT[/C][C]P-value[/C][/ROW]
[ROW][C]1[/C][C]0.644398[/C][C]8.929[/C][C]0[/C][/ROW]
[ROW][C]2[/C][C]0.410377[/C][C]5.6864[/C][C]0[/C][/ROW]
[ROW][C]3[/C][C]0.255395[/C][C]3.5389[/C][C]0.000252[/C][/ROW]
[ROW][C]4[/C][C]0.125616[/C][C]1.7406[/C][C]0.041679[/C][/ROW]
[ROW][C]5[/C][C]0.10168[/C][C]1.4089[/C][C]0.080238[/C][/ROW]
[ROW][C]6[/C][C]0.063426[/C][C]0.8789[/C][C]0.19029[/C][/ROW]
[ROW][C]7[/C][C]-0.070556[/C][C]-0.9777[/C][C]0.164737[/C][/ROW]
[ROW][C]8[/C][C]-0.017972[/C][C]-0.249[/C][C]0.401804[/C][/ROW]
[ROW][C]9[/C][C]-0.056376[/C][C]-0.7812[/C][C]0.217832[/C][/ROW]
[ROW][C]10[/C][C]-0.110354[/C][C]-1.5291[/C][C]0.063942[/C][/ROW]
[ROW][C]11[/C][C]-0.071842[/C][C]-0.9955[/C][C]0.160382[/C][/ROW]
[ROW][C]12[/C][C]0.444162[/C][C]6.1545[/C][C]0[/C][/ROW]
[ROW][C]13[/C][C]-0.199846[/C][C]-2.7691[/C][C]0.003086[/C][/ROW]
[ROW][C]14[/C][C]-0.112923[/C][C]-1.5647[/C][C]0.05965[/C][/ROW]
[ROW][C]15[/C][C]-0.058273[/C][C]-0.8075[/C][C]0.210203[/C][/ROW]
[ROW][C]16[/C][C]-0.003548[/C][C]-0.0492[/C][C]0.480419[/C][/ROW]
[ROW][C]17[/C][C]-0.109486[/C][C]-1.5171[/C][C]0.065445[/C][/ROW]
[ROW][C]18[/C][C]-0.121539[/C][C]-1.6841[/C][C]0.046894[/C][/ROW]
[ROW][C]19[/C][C]0.076557[/C][C]1.0608[/C][C]0.145056[/C][/ROW]
[ROW][C]20[/C][C]-0.0702[/C][C]-0.9727[/C][C]0.165959[/C][/ROW]
[ROW][C]21[/C][C]-0.022261[/C][C]-0.3085[/C][C]0.379035[/C][/ROW]
[ROW][C]22[/C][C]0.031373[/C][C]0.4347[/C][C]0.33213[/C][/ROW]
[ROW][C]23[/C][C]0.011149[/C][C]0.1545[/C][C]0.438695[/C][/ROW]
[ROW][C]24[/C][C]0.178226[/C][C]2.4696[/C][C]0.0072[/C][/ROW]
[ROW][C]25[/C][C]-0.227215[/C][C]-3.1484[/C][C]0.000952[/C][/ROW]
[ROW][C]26[/C][C]-0.143195[/C][C]-1.9842[/C][C]0.024331[/C][/ROW]
[ROW][C]27[/C][C]-0.061[/C][C]-0.8452[/C][C]0.199516[/C][/ROW]
[ROW][C]28[/C][C]-0.004693[/C][C]-0.065[/C][C]0.474108[/C][/ROW]
[ROW][C]29[/C][C]-0.022331[/C][C]-0.3094[/C][C]0.378664[/C][/ROW]
[ROW][C]30[/C][C]-0.026003[/C][C]-0.3603[/C][C]0.359505[/C][/ROW]
[ROW][C]31[/C][C]0.022362[/C][C]0.3099[/C][C]0.378505[/C][/ROW]
[ROW][C]32[/C][C]-0.029596[/C][C]-0.4101[/C][C]0.341097[/C][/ROW]
[ROW][C]33[/C][C]-0.084179[/C][C]-1.1664[/C][C]0.122445[/C][/ROW]
[ROW][C]34[/C][C]-0.042056[/C][C]-0.5827[/C][C]0.280376[/C][/ROW]
[ROW][C]35[/C][C]0.052487[/C][C]0.7273[/C][C]0.233971[/C][/ROW]
[ROW][C]36[/C][C]0.1286[/C][C]1.7819[/C][C]0.03817[/C][/ROW]
[ROW][C]37[/C][C]-0.092075[/C][C]-1.2758[/C][C]0.101779[/C][/ROW]
[ROW][C]38[/C][C]-0.029206[/C][C]-0.4047[/C][C]0.343078[/C][/ROW]
[ROW][C]39[/C][C]0.003435[/C][C]0.0476[/C][C]0.481042[/C][/ROW]
[ROW][C]40[/C][C]0.060621[/C][C]0.84[/C][C]0.20098[/C][/ROW]
[ROW][C]41[/C][C]0.047806[/C][C]0.6624[/C][C]0.254247[/C][/ROW]
[ROW][C]42[/C][C]0.007098[/C][C]0.0984[/C][C]0.460878[/C][/ROW]
[ROW][C]43[/C][C]-0.050006[/C][C]-0.6929[/C][C]0.244605[/C][/ROW]
[ROW][C]44[/C][C]0.017283[/C][C]0.2395[/C][C]0.405494[/C][/ROW]
[ROW][C]45[/C][C]-0.051632[/C][C]-0.7154[/C][C]0.237604[/C][/ROW]
[ROW][C]46[/C][C]0.081275[/C][C]1.1262[/C][C]0.130749[/C][/ROW]
[ROW][C]47[/C][C]-0.133898[/C][C]-1.8553[/C][C]0.03254[/C][/ROW]
[ROW][C]48[/C][C]0.00952[/C][C]0.1319[/C][C]0.447594[/C][/ROW]
[/TABLE]
Source: https://freestatistics.org/blog/index.php?pk=277819&T=2

Globally Unique Identifier (entire table): ba.freestatistics.org/blog/index.php?pk=277819&T=2

As an alternative you can also use a QR Code:  

The GUIDs for individual cells are displayed in the table below:

Partial Autocorrelation Function
Time lag kPACF(k)T-STATP-value
10.6443988.9290
20.4103775.68640
30.2553953.53890.000252
40.1256161.74060.041679
50.101681.40890.080238
60.0634260.87890.19029
7-0.070556-0.97770.164737
8-0.017972-0.2490.401804
9-0.056376-0.78120.217832
10-0.110354-1.52910.063942
11-0.071842-0.99550.160382
120.4441626.15450
13-0.199846-2.76910.003086
14-0.112923-1.56470.05965
15-0.058273-0.80750.210203
16-0.003548-0.04920.480419
17-0.109486-1.51710.065445
18-0.121539-1.68410.046894
190.0765571.06080.145056
20-0.0702-0.97270.165959
21-0.022261-0.30850.379035
220.0313730.43470.33213
230.0111490.15450.438695
240.1782262.46960.0072
25-0.227215-3.14840.000952
26-0.143195-1.98420.024331
27-0.061-0.84520.199516
28-0.004693-0.0650.474108
29-0.022331-0.30940.378664
30-0.026003-0.36030.359505
310.0223620.30990.378505
32-0.029596-0.41010.341097
33-0.084179-1.16640.122445
34-0.042056-0.58270.280376
350.0524870.72730.233971
360.12861.78190.03817
37-0.092075-1.27580.101779
38-0.029206-0.40470.343078
390.0034350.04760.481042
400.0606210.840.20098
410.0478060.66240.254247
420.0070980.09840.460878
43-0.050006-0.69290.244605
440.0172830.23950.405494
45-0.051632-0.71540.237604
460.0812751.12620.130749
47-0.133898-1.85530.03254
480.009520.13190.447594


Parameters (Session):
par1 = 48 ; par2 = 1 ; par3 = 0 ; par4 = 0 ; par5 = 12 ; par6 = White Noise ; par7 = 0.95 ;
Parameters (R input):
par1 = 48 ; par2 = 1 ; par3 = 0 ; par4 = 0 ; par5 = 12 ; par6 = White Noise ; par7 = 0.95 ; par8 = ;
R code (references can be found in the software module):
if (par1 == 'Default') {
par1 = 10*log10(length(x))
} else {
par1 <- as.numeric(par1)
}
par2 <- as.numeric(par2)
par3 <- as.numeric(par3)
par4 <- as.numeric(par4)
par5 <- as.numeric(par5)
if (par6 == 'White Noise') par6 <- 'white' else par6 <- 'ma'
par7 <- as.numeric(par7)
if (par8 != '') par8 <- as.numeric(par8)
ox <- x
if (par8 == '') {
if (par2 == 0) {
x <- log(x)
} else {
x <- (x ^ par2 - 1) / par2
}
} else {
x <- log(x,base=par8)
}
if (par3 > 0) x <- diff(x,lag=1,difference=par3)
if (par4 > 0) x <- diff(x,lag=par5,difference=par4)
bitmap(file='picts.png')
op <- par(mfrow=c(2,1))
plot(ox,type='l',main='Original Time Series',xlab='time',ylab='value')
if (par8=='') {
mytitle <- paste('Working Time Series (lambda=',par2,', d=',par3,', D=',par4,')',sep='')
mysub <- paste('(lambda=',par2,', d=',par3,', D=',par4,', CI=', par7, ', CI type=',par6,')',sep='')
} else {
mytitle <- paste('Working Time Series (base=',par8,', d=',par3,', D=',par4,')',sep='')
mysub <- paste('(base=',par8,', d=',par3,', D=',par4,', CI=', par7, ', CI type=',par6,')',sep='')
}
plot(x,type='l', main=mytitle,xlab='time',ylab='value')
par(op)
dev.off()
bitmap(file='pic1.png')
racf <- acf(x, par1, main='Autocorrelation', xlab='time lag', ylab='ACF', ci.type=par6, ci=par7, sub=mysub)
dev.off()
bitmap(file='pic2.png')
rpacf <- pacf(x,par1,main='Partial Autocorrelation',xlab='lags',ylab='PACF',sub=mysub)
dev.off()
(myacf <- c(racf$acf))
(mypacf <- c(rpacf$acf))
lengthx <- length(x)
sqrtn <- sqrt(lengthx)
load(file='createtable')
a<-table.start()
a<-table.row.start(a)
a<-table.element(a,'Autocorrelation Function',4,TRUE)
a<-table.row.end(a)
a<-table.row.start(a)
a<-table.element(a,'Time lag k',header=TRUE)
a<-table.element(a,hyperlink('basics.htm','ACF(k)','click here for more information about the Autocorrelation Function'),header=TRUE)
a<-table.element(a,'T-STAT',header=TRUE)
a<-table.element(a,'P-value',header=TRUE)
a<-table.row.end(a)
for (i in 2:(par1+1)) {
a<-table.row.start(a)
a<-table.element(a,i-1,header=TRUE)
a<-table.element(a,round(myacf[i],6))
mytstat <- myacf[i]*sqrtn
a<-table.element(a,round(mytstat,4))
a<-table.element(a,round(1-pt(abs(mytstat),lengthx),6))
a<-table.row.end(a)
}
a<-table.end(a)
table.save(a,file='mytable.tab')
a<-table.start()
a<-table.row.start(a)
a<-table.element(a,'Partial Autocorrelation Function',4,TRUE)
a<-table.row.end(a)
a<-table.row.start(a)
a<-table.element(a,'Time lag k',header=TRUE)
a<-table.element(a,hyperlink('basics.htm','PACF(k)','click here for more information about the Partial Autocorrelation Function'),header=TRUE)
a<-table.element(a,'T-STAT',header=TRUE)
a<-table.element(a,'P-value',header=TRUE)
a<-table.row.end(a)
for (i in 1:par1) {
a<-table.row.start(a)
a<-table.element(a,i,header=TRUE)
a<-table.element(a,round(mypacf[i],6))
mytstat <- mypacf[i]*sqrtn
a<-table.element(a,round(mytstat,4))
a<-table.element(a,round(1-pt(abs(mytstat),lengthx),6))
a<-table.row.end(a)
}
a<-table.end(a)
table.save(a,file='mytable1.tab')