Free Statistics

of Irreproducible Research!

Author's title

Author*Unverified author*
R Software Modulerwasp_autocorrelation.wasp
Title produced by software(Partial) Autocorrelation Function
Date of computationMon, 02 Mar 2015 14:14:41 +0000
Cite this page as followsStatistical Computations at FreeStatistics.org, Office for Research Development and Education, URL https://freestatistics.org/blog/index.php?v=date/2015/Mar/02/t1425305801czvjwueg8sja0vq.htm/, Retrieved Sun, 19 May 2024 10:44:09 +0000
Statistical Computations at FreeStatistics.org, Office for Research Development and Education, URL https://freestatistics.org/blog/index.php?pk=277810, Retrieved Sun, 19 May 2024 10:44:09 +0000
QR Codes:

Original text written by user:
IsPrivate?No (this computation is public)
User-defined keywords
Estimated Impact114
Family? (F = Feedback message, R = changed R code, M = changed R Module, P = changed Parameters, D = changed Data)
-       [(Partial) Autocorrelation Function] [] [2015-03-02 14:14:41] [679411f6187277139d0a9a0a87b165a8] [Current]
Feedback Forum

Post a new message
Dataseries X:
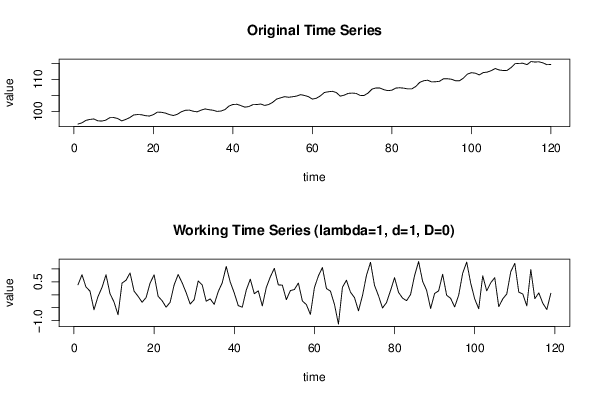
96.01
96.39
97.16
97.46
97.6
97.02
96.95
97.23
98
98.04
97.76
96.99
97.44
98
98.84
98.98
98.92
98.63
98.52
98.97
99.74
99.68
99.45
98.97
98.68
99.06
99.84
100.3
100.38
100.02
99.83
100.36
100.74
100.49
100.33
99.96
100.08
100.54
101.63
102.12
102.19
101.77
101.29
101.47
102.07
102.11
102.26
101.83
102.11
102.8
103.82
104.2
104.57
104.38
104.54
104.74
105.19
104.95
104.57
103.81
104.08
104.81
105.86
106.1
106.24
105.87
104.74
105.03
105.59
105.69
105.58
104.96
104.93
105.68
106.93
107.29
107.25
106.74
106.44
106.6
107.26
107.35
107.22
106.99
107
107.74
109.02
109.54
109.71
109.18
109.23
109.38
110.17
110.15
110.01
109.54
109.52
110.35
111.61
112.06
111.9
111.36
112.09
112.24
112.7
113.36
112.9
112.74
112.77
113.66
114.87
114.97
115
114.57
115.54
115.39
115.46
115.13
114.56
114.62


Summary of computational transaction
Raw Inputview raw input (R code)
Raw Outputview raw output of R engine
Computing time1 seconds
R Server'George Udny Yule' @ yule.wessa.net

\begin{tabular}{lllllllll}
\hline
Summary of computational transaction \tabularnewline
Raw Input & view raw input (R code)  \tabularnewline
Raw Output & view raw output of R engine  \tabularnewline
Computing time & 1 seconds \tabularnewline
R Server & 'George Udny Yule' @ yule.wessa.net \tabularnewline
\hline
\end{tabular}
%Source: https://freestatistics.org/blog/index.php?pk=277810&T=0

[TABLE]
[ROW][C]Summary of computational transaction[/C][/ROW]
[ROW][C]Raw Input[/C][C]view raw input (R code) [/C][/ROW]
[ROW][C]Raw Output[/C][C]view raw output of R engine [/C][/ROW]
[ROW][C]Computing time[/C][C]1 seconds[/C][/ROW]
[ROW][C]R Server[/C][C]'George Udny Yule' @ yule.wessa.net[/C][/ROW]
[/TABLE]
Source: https://freestatistics.org/blog/index.php?pk=277810&T=0

Globally Unique Identifier (entire table): ba.freestatistics.org/blog/index.php?pk=277810&T=0

As an alternative you can also use a QR Code:  

The GUIDs for individual cells are displayed in the table below:

Summary of computational transaction
Raw Inputview raw input (R code)
Raw Outputview raw output of R engine
Computing time1 seconds
R Server'George Udny Yule' @ yule.wessa.net


Autocorrelation Function
Time lag kACF(k)T-STATP-value
10.3428793.74040.000142
2-0.228382-2.49140.007052
3-0.633545-6.91120
4-0.311718-3.40040.000458
50.2226892.42930.008312
60.5016095.47190
70.1563351.70540.045363
8-0.356461-3.88858.3e-05
9-0.58415-6.37230
10-0.176138-1.92140.028534
110.3399543.70850.000159
120.7281917.94360
130.2731372.97960.00175
14-0.247618-2.70120.003959
15-0.543952-5.93380
16-0.261513-2.85280.002556
170.1823561.98930.024483
180.4501844.91091e-06
190.1091461.19060.118081
20-0.350709-3.82580.000105
21-0.530973-5.79220
22-0.132695-1.44750.075189
230.3168683.45660.00038
240.6201386.76490
250.2486032.71190.00384
26-0.208545-2.2750.012349
27-0.483758-5.27720
28-0.219256-2.39180.009166
290.1542861.68310.047492
300.367744.01165.3e-05
310.0651730.7110.239252
32-0.291133-3.17590.000951
33-0.439967-4.79952e-06
34-0.096157-1.04890.148164
350.2749522.99940.001648
360.5110025.57440
370.2317492.52810.006389
38-0.168797-1.84140.03403
39-0.455066-4.96421e-06
40-0.151154-1.64890.050903
410.1275161.3910.083406
420.3558163.88158.5e-05
430.03830.41780.33842
44-0.246627-2.69040.004082
45-0.366505-3.99815.6e-05
46-0.098853-1.07840.141527
470.2403972.62240.004936
480.4171344.55046e-06

\begin{tabular}{lllllllll}
\hline
Autocorrelation Function \tabularnewline
Time lag k & ACF(k) & T-STAT & P-value \tabularnewline
1 & 0.342879 & 3.7404 & 0.000142 \tabularnewline
2 & -0.228382 & -2.4914 & 0.007052 \tabularnewline
3 & -0.633545 & -6.9112 & 0 \tabularnewline
4 & -0.311718 & -3.4004 & 0.000458 \tabularnewline
5 & 0.222689 & 2.4293 & 0.008312 \tabularnewline
6 & 0.501609 & 5.4719 & 0 \tabularnewline
7 & 0.156335 & 1.7054 & 0.045363 \tabularnewline
8 & -0.356461 & -3.8885 & 8.3e-05 \tabularnewline
9 & -0.58415 & -6.3723 & 0 \tabularnewline
10 & -0.176138 & -1.9214 & 0.028534 \tabularnewline
11 & 0.339954 & 3.7085 & 0.000159 \tabularnewline
12 & 0.728191 & 7.9436 & 0 \tabularnewline
13 & 0.273137 & 2.9796 & 0.00175 \tabularnewline
14 & -0.247618 & -2.7012 & 0.003959 \tabularnewline
15 & -0.543952 & -5.9338 & 0 \tabularnewline
16 & -0.261513 & -2.8528 & 0.002556 \tabularnewline
17 & 0.182356 & 1.9893 & 0.024483 \tabularnewline
18 & 0.450184 & 4.9109 & 1e-06 \tabularnewline
19 & 0.109146 & 1.1906 & 0.118081 \tabularnewline
20 & -0.350709 & -3.8258 & 0.000105 \tabularnewline
21 & -0.530973 & -5.7922 & 0 \tabularnewline
22 & -0.132695 & -1.4475 & 0.075189 \tabularnewline
23 & 0.316868 & 3.4566 & 0.00038 \tabularnewline
24 & 0.620138 & 6.7649 & 0 \tabularnewline
25 & 0.248603 & 2.7119 & 0.00384 \tabularnewline
26 & -0.208545 & -2.275 & 0.012349 \tabularnewline
27 & -0.483758 & -5.2772 & 0 \tabularnewline
28 & -0.219256 & -2.3918 & 0.009166 \tabularnewline
29 & 0.154286 & 1.6831 & 0.047492 \tabularnewline
30 & 0.36774 & 4.0116 & 5.3e-05 \tabularnewline
31 & 0.065173 & 0.711 & 0.239252 \tabularnewline
32 & -0.291133 & -3.1759 & 0.000951 \tabularnewline
33 & -0.439967 & -4.7995 & 2e-06 \tabularnewline
34 & -0.096157 & -1.0489 & 0.148164 \tabularnewline
35 & 0.274952 & 2.9994 & 0.001648 \tabularnewline
36 & 0.511002 & 5.5744 & 0 \tabularnewline
37 & 0.231749 & 2.5281 & 0.006389 \tabularnewline
38 & -0.168797 & -1.8414 & 0.03403 \tabularnewline
39 & -0.455066 & -4.9642 & 1e-06 \tabularnewline
40 & -0.151154 & -1.6489 & 0.050903 \tabularnewline
41 & 0.127516 & 1.391 & 0.083406 \tabularnewline
42 & 0.355816 & 3.8815 & 8.5e-05 \tabularnewline
43 & 0.0383 & 0.4178 & 0.33842 \tabularnewline
44 & -0.246627 & -2.6904 & 0.004082 \tabularnewline
45 & -0.366505 & -3.9981 & 5.6e-05 \tabularnewline
46 & -0.098853 & -1.0784 & 0.141527 \tabularnewline
47 & 0.240397 & 2.6224 & 0.004936 \tabularnewline
48 & 0.417134 & 4.5504 & 6e-06 \tabularnewline
\hline
\end{tabular}
%Source: https://freestatistics.org/blog/index.php?pk=277810&T=1

[TABLE]
[ROW][C]Autocorrelation Function[/C][/ROW]
[ROW][C]Time lag k[/C][C]ACF(k)[/C][C]T-STAT[/C][C]P-value[/C][/ROW]
[ROW][C]1[/C][C]0.342879[/C][C]3.7404[/C][C]0.000142[/C][/ROW]
[ROW][C]2[/C][C]-0.228382[/C][C]-2.4914[/C][C]0.007052[/C][/ROW]
[ROW][C]3[/C][C]-0.633545[/C][C]-6.9112[/C][C]0[/C][/ROW]
[ROW][C]4[/C][C]-0.311718[/C][C]-3.4004[/C][C]0.000458[/C][/ROW]
[ROW][C]5[/C][C]0.222689[/C][C]2.4293[/C][C]0.008312[/C][/ROW]
[ROW][C]6[/C][C]0.501609[/C][C]5.4719[/C][C]0[/C][/ROW]
[ROW][C]7[/C][C]0.156335[/C][C]1.7054[/C][C]0.045363[/C][/ROW]
[ROW][C]8[/C][C]-0.356461[/C][C]-3.8885[/C][C]8.3e-05[/C][/ROW]
[ROW][C]9[/C][C]-0.58415[/C][C]-6.3723[/C][C]0[/C][/ROW]
[ROW][C]10[/C][C]-0.176138[/C][C]-1.9214[/C][C]0.028534[/C][/ROW]
[ROW][C]11[/C][C]0.339954[/C][C]3.7085[/C][C]0.000159[/C][/ROW]
[ROW][C]12[/C][C]0.728191[/C][C]7.9436[/C][C]0[/C][/ROW]
[ROW][C]13[/C][C]0.273137[/C][C]2.9796[/C][C]0.00175[/C][/ROW]
[ROW][C]14[/C][C]-0.247618[/C][C]-2.7012[/C][C]0.003959[/C][/ROW]
[ROW][C]15[/C][C]-0.543952[/C][C]-5.9338[/C][C]0[/C][/ROW]
[ROW][C]16[/C][C]-0.261513[/C][C]-2.8528[/C][C]0.002556[/C][/ROW]
[ROW][C]17[/C][C]0.182356[/C][C]1.9893[/C][C]0.024483[/C][/ROW]
[ROW][C]18[/C][C]0.450184[/C][C]4.9109[/C][C]1e-06[/C][/ROW]
[ROW][C]19[/C][C]0.109146[/C][C]1.1906[/C][C]0.118081[/C][/ROW]
[ROW][C]20[/C][C]-0.350709[/C][C]-3.8258[/C][C]0.000105[/C][/ROW]
[ROW][C]21[/C][C]-0.530973[/C][C]-5.7922[/C][C]0[/C][/ROW]
[ROW][C]22[/C][C]-0.132695[/C][C]-1.4475[/C][C]0.075189[/C][/ROW]
[ROW][C]23[/C][C]0.316868[/C][C]3.4566[/C][C]0.00038[/C][/ROW]
[ROW][C]24[/C][C]0.620138[/C][C]6.7649[/C][C]0[/C][/ROW]
[ROW][C]25[/C][C]0.248603[/C][C]2.7119[/C][C]0.00384[/C][/ROW]
[ROW][C]26[/C][C]-0.208545[/C][C]-2.275[/C][C]0.012349[/C][/ROW]
[ROW][C]27[/C][C]-0.483758[/C][C]-5.2772[/C][C]0[/C][/ROW]
[ROW][C]28[/C][C]-0.219256[/C][C]-2.3918[/C][C]0.009166[/C][/ROW]
[ROW][C]29[/C][C]0.154286[/C][C]1.6831[/C][C]0.047492[/C][/ROW]
[ROW][C]30[/C][C]0.36774[/C][C]4.0116[/C][C]5.3e-05[/C][/ROW]
[ROW][C]31[/C][C]0.065173[/C][C]0.711[/C][C]0.239252[/C][/ROW]
[ROW][C]32[/C][C]-0.291133[/C][C]-3.1759[/C][C]0.000951[/C][/ROW]
[ROW][C]33[/C][C]-0.439967[/C][C]-4.7995[/C][C]2e-06[/C][/ROW]
[ROW][C]34[/C][C]-0.096157[/C][C]-1.0489[/C][C]0.148164[/C][/ROW]
[ROW][C]35[/C][C]0.274952[/C][C]2.9994[/C][C]0.001648[/C][/ROW]
[ROW][C]36[/C][C]0.511002[/C][C]5.5744[/C][C]0[/C][/ROW]
[ROW][C]37[/C][C]0.231749[/C][C]2.5281[/C][C]0.006389[/C][/ROW]
[ROW][C]38[/C][C]-0.168797[/C][C]-1.8414[/C][C]0.03403[/C][/ROW]
[ROW][C]39[/C][C]-0.455066[/C][C]-4.9642[/C][C]1e-06[/C][/ROW]
[ROW][C]40[/C][C]-0.151154[/C][C]-1.6489[/C][C]0.050903[/C][/ROW]
[ROW][C]41[/C][C]0.127516[/C][C]1.391[/C][C]0.083406[/C][/ROW]
[ROW][C]42[/C][C]0.355816[/C][C]3.8815[/C][C]8.5e-05[/C][/ROW]
[ROW][C]43[/C][C]0.0383[/C][C]0.4178[/C][C]0.33842[/C][/ROW]
[ROW][C]44[/C][C]-0.246627[/C][C]-2.6904[/C][C]0.004082[/C][/ROW]
[ROW][C]45[/C][C]-0.366505[/C][C]-3.9981[/C][C]5.6e-05[/C][/ROW]
[ROW][C]46[/C][C]-0.098853[/C][C]-1.0784[/C][C]0.141527[/C][/ROW]
[ROW][C]47[/C][C]0.240397[/C][C]2.6224[/C][C]0.004936[/C][/ROW]
[ROW][C]48[/C][C]0.417134[/C][C]4.5504[/C][C]6e-06[/C][/ROW]
[/TABLE]
Source: https://freestatistics.org/blog/index.php?pk=277810&T=1

Globally Unique Identifier (entire table): ba.freestatistics.org/blog/index.php?pk=277810&T=1

As an alternative you can also use a QR Code:  

The GUIDs for individual cells are displayed in the table below:

Autocorrelation Function
Time lag kACF(k)T-STATP-value
10.3428793.74040.000142
2-0.228382-2.49140.007052
3-0.633545-6.91120
4-0.311718-3.40040.000458
50.2226892.42930.008312
60.5016095.47190
70.1563351.70540.045363
8-0.356461-3.88858.3e-05
9-0.58415-6.37230
10-0.176138-1.92140.028534
110.3399543.70850.000159
120.7281917.94360
130.2731372.97960.00175
14-0.247618-2.70120.003959
15-0.543952-5.93380
16-0.261513-2.85280.002556
170.1823561.98930.024483
180.4501844.91091e-06
190.1091461.19060.118081
20-0.350709-3.82580.000105
21-0.530973-5.79220
22-0.132695-1.44750.075189
230.3168683.45660.00038
240.6201386.76490
250.2486032.71190.00384
26-0.208545-2.2750.012349
27-0.483758-5.27720
28-0.219256-2.39180.009166
290.1542861.68310.047492
300.367744.01165.3e-05
310.0651730.7110.239252
32-0.291133-3.17590.000951
33-0.439967-4.79952e-06
34-0.096157-1.04890.148164
350.2749522.99940.001648
360.5110025.57440
370.2317492.52810.006389
38-0.168797-1.84140.03403
39-0.455066-4.96421e-06
40-0.151154-1.64890.050903
410.1275161.3910.083406
420.3558163.88158.5e-05
430.03830.41780.33842
44-0.246627-2.69040.004082
45-0.366505-3.99815.6e-05
46-0.098853-1.07840.141527
470.2403972.62240.004936
480.4171344.55046e-06


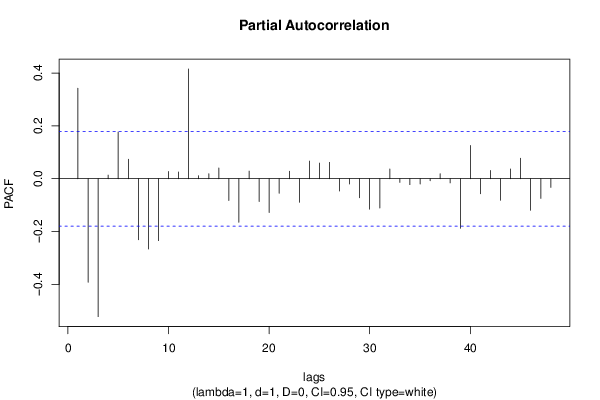
Partial Autocorrelation Function
Time lag kPACF(k)T-STATP-value
10.3428793.74040.000142
2-0.392039-4.27661.9e-05
3-0.522378-5.69850
40.0137170.14960.440655
50.1765241.92570.028267
60.0735690.80250.21192
7-0.230962-2.51950.006539
8-0.266484-2.9070.002177
9-0.234339-2.55630.005918
100.0275120.30010.382304
110.0252770.27570.391613
120.4158734.53667e-06
130.0112470.12270.45128
140.0189790.2070.418169
150.0407140.44410.328874
16-0.082178-0.89650.185909
17-0.165133-1.80140.037087
180.0288710.31490.376679
19-0.086174-0.940.174549
20-0.127597-1.39190.083271
21-0.054948-0.59940.275018
220.0285220.31110.37812
23-0.089199-0.9730.166252
240.0667820.72850.233869
250.059130.6450.260074
260.0619850.67620.250122
27-0.046292-0.5050.30725
28-0.020152-0.21980.413189
29-0.072185-0.78740.216293
30-0.115234-1.25710.105597
31-0.1109-1.20980.114381
320.0372230.40610.342714
33-0.013781-0.15030.440378
34-0.022418-0.24460.403611
35-0.019685-0.21470.415171
36-0.007659-0.08360.466777
370.0191140.20850.417594
38-0.015772-0.17210.431843
39-0.187372-2.0440.021581
400.1259561.3740.086009
41-0.056687-0.61840.268753
420.0309680.33780.368046
43-0.081514-0.88920.18784
440.0371850.40560.342869
450.0773340.84360.200289
46-0.119421-1.30270.09759
47-0.074437-0.8120.209204
48-0.032716-0.35690.360902

\begin{tabular}{lllllllll}
\hline
Partial Autocorrelation Function \tabularnewline
Time lag k & PACF(k) & T-STAT & P-value \tabularnewline
1 & 0.342879 & 3.7404 & 0.000142 \tabularnewline
2 & -0.392039 & -4.2766 & 1.9e-05 \tabularnewline
3 & -0.522378 & -5.6985 & 0 \tabularnewline
4 & 0.013717 & 0.1496 & 0.440655 \tabularnewline
5 & 0.176524 & 1.9257 & 0.028267 \tabularnewline
6 & 0.073569 & 0.8025 & 0.21192 \tabularnewline
7 & -0.230962 & -2.5195 & 0.006539 \tabularnewline
8 & -0.266484 & -2.907 & 0.002177 \tabularnewline
9 & -0.234339 & -2.5563 & 0.005918 \tabularnewline
10 & 0.027512 & 0.3001 & 0.382304 \tabularnewline
11 & 0.025277 & 0.2757 & 0.391613 \tabularnewline
12 & 0.415873 & 4.5366 & 7e-06 \tabularnewline
13 & 0.011247 & 0.1227 & 0.45128 \tabularnewline
14 & 0.018979 & 0.207 & 0.418169 \tabularnewline
15 & 0.040714 & 0.4441 & 0.328874 \tabularnewline
16 & -0.082178 & -0.8965 & 0.185909 \tabularnewline
17 & -0.165133 & -1.8014 & 0.037087 \tabularnewline
18 & 0.028871 & 0.3149 & 0.376679 \tabularnewline
19 & -0.086174 & -0.94 & 0.174549 \tabularnewline
20 & -0.127597 & -1.3919 & 0.083271 \tabularnewline
21 & -0.054948 & -0.5994 & 0.275018 \tabularnewline
22 & 0.028522 & 0.3111 & 0.37812 \tabularnewline
23 & -0.089199 & -0.973 & 0.166252 \tabularnewline
24 & 0.066782 & 0.7285 & 0.233869 \tabularnewline
25 & 0.05913 & 0.645 & 0.260074 \tabularnewline
26 & 0.061985 & 0.6762 & 0.250122 \tabularnewline
27 & -0.046292 & -0.505 & 0.30725 \tabularnewline
28 & -0.020152 & -0.2198 & 0.413189 \tabularnewline
29 & -0.072185 & -0.7874 & 0.216293 \tabularnewline
30 & -0.115234 & -1.2571 & 0.105597 \tabularnewline
31 & -0.1109 & -1.2098 & 0.114381 \tabularnewline
32 & 0.037223 & 0.4061 & 0.342714 \tabularnewline
33 & -0.013781 & -0.1503 & 0.440378 \tabularnewline
34 & -0.022418 & -0.2446 & 0.403611 \tabularnewline
35 & -0.019685 & -0.2147 & 0.415171 \tabularnewline
36 & -0.007659 & -0.0836 & 0.466777 \tabularnewline
37 & 0.019114 & 0.2085 & 0.417594 \tabularnewline
38 & -0.015772 & -0.1721 & 0.431843 \tabularnewline
39 & -0.187372 & -2.044 & 0.021581 \tabularnewline
40 & 0.125956 & 1.374 & 0.086009 \tabularnewline
41 & -0.056687 & -0.6184 & 0.268753 \tabularnewline
42 & 0.030968 & 0.3378 & 0.368046 \tabularnewline
43 & -0.081514 & -0.8892 & 0.18784 \tabularnewline
44 & 0.037185 & 0.4056 & 0.342869 \tabularnewline
45 & 0.077334 & 0.8436 & 0.200289 \tabularnewline
46 & -0.119421 & -1.3027 & 0.09759 \tabularnewline
47 & -0.074437 & -0.812 & 0.209204 \tabularnewline
48 & -0.032716 & -0.3569 & 0.360902 \tabularnewline
\hline
\end{tabular}
%Source: https://freestatistics.org/blog/index.php?pk=277810&T=2

[TABLE]
[ROW][C]Partial Autocorrelation Function[/C][/ROW]
[ROW][C]Time lag k[/C][C]PACF(k)[/C][C]T-STAT[/C][C]P-value[/C][/ROW]
[ROW][C]1[/C][C]0.342879[/C][C]3.7404[/C][C]0.000142[/C][/ROW]
[ROW][C]2[/C][C]-0.392039[/C][C]-4.2766[/C][C]1.9e-05[/C][/ROW]
[ROW][C]3[/C][C]-0.522378[/C][C]-5.6985[/C][C]0[/C][/ROW]
[ROW][C]4[/C][C]0.013717[/C][C]0.1496[/C][C]0.440655[/C][/ROW]
[ROW][C]5[/C][C]0.176524[/C][C]1.9257[/C][C]0.028267[/C][/ROW]
[ROW][C]6[/C][C]0.073569[/C][C]0.8025[/C][C]0.21192[/C][/ROW]
[ROW][C]7[/C][C]-0.230962[/C][C]-2.5195[/C][C]0.006539[/C][/ROW]
[ROW][C]8[/C][C]-0.266484[/C][C]-2.907[/C][C]0.002177[/C][/ROW]
[ROW][C]9[/C][C]-0.234339[/C][C]-2.5563[/C][C]0.005918[/C][/ROW]
[ROW][C]10[/C][C]0.027512[/C][C]0.3001[/C][C]0.382304[/C][/ROW]
[ROW][C]11[/C][C]0.025277[/C][C]0.2757[/C][C]0.391613[/C][/ROW]
[ROW][C]12[/C][C]0.415873[/C][C]4.5366[/C][C]7e-06[/C][/ROW]
[ROW][C]13[/C][C]0.011247[/C][C]0.1227[/C][C]0.45128[/C][/ROW]
[ROW][C]14[/C][C]0.018979[/C][C]0.207[/C][C]0.418169[/C][/ROW]
[ROW][C]15[/C][C]0.040714[/C][C]0.4441[/C][C]0.328874[/C][/ROW]
[ROW][C]16[/C][C]-0.082178[/C][C]-0.8965[/C][C]0.185909[/C][/ROW]
[ROW][C]17[/C][C]-0.165133[/C][C]-1.8014[/C][C]0.037087[/C][/ROW]
[ROW][C]18[/C][C]0.028871[/C][C]0.3149[/C][C]0.376679[/C][/ROW]
[ROW][C]19[/C][C]-0.086174[/C][C]-0.94[/C][C]0.174549[/C][/ROW]
[ROW][C]20[/C][C]-0.127597[/C][C]-1.3919[/C][C]0.083271[/C][/ROW]
[ROW][C]21[/C][C]-0.054948[/C][C]-0.5994[/C][C]0.275018[/C][/ROW]
[ROW][C]22[/C][C]0.028522[/C][C]0.3111[/C][C]0.37812[/C][/ROW]
[ROW][C]23[/C][C]-0.089199[/C][C]-0.973[/C][C]0.166252[/C][/ROW]
[ROW][C]24[/C][C]0.066782[/C][C]0.7285[/C][C]0.233869[/C][/ROW]
[ROW][C]25[/C][C]0.05913[/C][C]0.645[/C][C]0.260074[/C][/ROW]
[ROW][C]26[/C][C]0.061985[/C][C]0.6762[/C][C]0.250122[/C][/ROW]
[ROW][C]27[/C][C]-0.046292[/C][C]-0.505[/C][C]0.30725[/C][/ROW]
[ROW][C]28[/C][C]-0.020152[/C][C]-0.2198[/C][C]0.413189[/C][/ROW]
[ROW][C]29[/C][C]-0.072185[/C][C]-0.7874[/C][C]0.216293[/C][/ROW]
[ROW][C]30[/C][C]-0.115234[/C][C]-1.2571[/C][C]0.105597[/C][/ROW]
[ROW][C]31[/C][C]-0.1109[/C][C]-1.2098[/C][C]0.114381[/C][/ROW]
[ROW][C]32[/C][C]0.037223[/C][C]0.4061[/C][C]0.342714[/C][/ROW]
[ROW][C]33[/C][C]-0.013781[/C][C]-0.1503[/C][C]0.440378[/C][/ROW]
[ROW][C]34[/C][C]-0.022418[/C][C]-0.2446[/C][C]0.403611[/C][/ROW]
[ROW][C]35[/C][C]-0.019685[/C][C]-0.2147[/C][C]0.415171[/C][/ROW]
[ROW][C]36[/C][C]-0.007659[/C][C]-0.0836[/C][C]0.466777[/C][/ROW]
[ROW][C]37[/C][C]0.019114[/C][C]0.2085[/C][C]0.417594[/C][/ROW]
[ROW][C]38[/C][C]-0.015772[/C][C]-0.1721[/C][C]0.431843[/C][/ROW]
[ROW][C]39[/C][C]-0.187372[/C][C]-2.044[/C][C]0.021581[/C][/ROW]
[ROW][C]40[/C][C]0.125956[/C][C]1.374[/C][C]0.086009[/C][/ROW]
[ROW][C]41[/C][C]-0.056687[/C][C]-0.6184[/C][C]0.268753[/C][/ROW]
[ROW][C]42[/C][C]0.030968[/C][C]0.3378[/C][C]0.368046[/C][/ROW]
[ROW][C]43[/C][C]-0.081514[/C][C]-0.8892[/C][C]0.18784[/C][/ROW]
[ROW][C]44[/C][C]0.037185[/C][C]0.4056[/C][C]0.342869[/C][/ROW]
[ROW][C]45[/C][C]0.077334[/C][C]0.8436[/C][C]0.200289[/C][/ROW]
[ROW][C]46[/C][C]-0.119421[/C][C]-1.3027[/C][C]0.09759[/C][/ROW]
[ROW][C]47[/C][C]-0.074437[/C][C]-0.812[/C][C]0.209204[/C][/ROW]
[ROW][C]48[/C][C]-0.032716[/C][C]-0.3569[/C][C]0.360902[/C][/ROW]
[/TABLE]
Source: https://freestatistics.org/blog/index.php?pk=277810&T=2

Globally Unique Identifier (entire table): ba.freestatistics.org/blog/index.php?pk=277810&T=2

As an alternative you can also use a QR Code:  

The GUIDs for individual cells are displayed in the table below:

Partial Autocorrelation Function
Time lag kPACF(k)T-STATP-value
10.3428793.74040.000142
2-0.392039-4.27661.9e-05
3-0.522378-5.69850
40.0137170.14960.440655
50.1765241.92570.028267
60.0735690.80250.21192
7-0.230962-2.51950.006539
8-0.266484-2.9070.002177
9-0.234339-2.55630.005918
100.0275120.30010.382304
110.0252770.27570.391613
120.4158734.53667e-06
130.0112470.12270.45128
140.0189790.2070.418169
150.0407140.44410.328874
16-0.082178-0.89650.185909
17-0.165133-1.80140.037087
180.0288710.31490.376679
19-0.086174-0.940.174549
20-0.127597-1.39190.083271
21-0.054948-0.59940.275018
220.0285220.31110.37812
23-0.089199-0.9730.166252
240.0667820.72850.233869
250.059130.6450.260074
260.0619850.67620.250122
27-0.046292-0.5050.30725
28-0.020152-0.21980.413189
29-0.072185-0.78740.216293
30-0.115234-1.25710.105597
31-0.1109-1.20980.114381
320.0372230.40610.342714
33-0.013781-0.15030.440378
34-0.022418-0.24460.403611
35-0.019685-0.21470.415171
36-0.007659-0.08360.466777
370.0191140.20850.417594
38-0.015772-0.17210.431843
39-0.187372-2.0440.021581
400.1259561.3740.086009
41-0.056687-0.61840.268753
420.0309680.33780.368046
43-0.081514-0.88920.18784
440.0371850.40560.342869
450.0773340.84360.200289
46-0.119421-1.30270.09759
47-0.074437-0.8120.209204
48-0.032716-0.35690.360902


Parameters (Session):
par1 = 48 ; par2 = 1 ; par3 = 1 ; par4 = 0 ; par5 = 12 ; par6 = White Noise ; par7 = 0.95 ;
Parameters (R input):
par1 = 48 ; par2 = 1 ; par3 = 1 ; par4 = 0 ; par5 = 12 ; par6 = White Noise ; par7 = 0.95 ; par8 = ;
R code (references can be found in the software module):
if (par1 == 'Default') {
par1 = 10*log10(length(x))
} else {
par1 <- as.numeric(par1)
}
par2 <- as.numeric(par2)
par3 <- as.numeric(par3)
par4 <- as.numeric(par4)
par5 <- as.numeric(par5)
if (par6 == 'White Noise') par6 <- 'white' else par6 <- 'ma'
par7 <- as.numeric(par7)
if (par8 != '') par8 <- as.numeric(par8)
ox <- x
if (par8 == '') {
if (par2 == 0) {
x <- log(x)
} else {
x <- (x ^ par2 - 1) / par2
}
} else {
x <- log(x,base=par8)
}
if (par3 > 0) x <- diff(x,lag=1,difference=par3)
if (par4 > 0) x <- diff(x,lag=par5,difference=par4)
bitmap(file='picts.png')
op <- par(mfrow=c(2,1))
plot(ox,type='l',main='Original Time Series',xlab='time',ylab='value')
if (par8=='') {
mytitle <- paste('Working Time Series (lambda=',par2,', d=',par3,', D=',par4,')',sep='')
mysub <- paste('(lambda=',par2,', d=',par3,', D=',par4,', CI=', par7, ', CI type=',par6,')',sep='')
} else {
mytitle <- paste('Working Time Series (base=',par8,', d=',par3,', D=',par4,')',sep='')
mysub <- paste('(base=',par8,', d=',par3,', D=',par4,', CI=', par7, ', CI type=',par6,')',sep='')
}
plot(x,type='l', main=mytitle,xlab='time',ylab='value')
par(op)
dev.off()
bitmap(file='pic1.png')
racf <- acf(x, par1, main='Autocorrelation', xlab='time lag', ylab='ACF', ci.type=par6, ci=par7, sub=mysub)
dev.off()
bitmap(file='pic2.png')
rpacf <- pacf(x,par1,main='Partial Autocorrelation',xlab='lags',ylab='PACF',sub=mysub)
dev.off()
(myacf <- c(racf$acf))
(mypacf <- c(rpacf$acf))
lengthx <- length(x)
sqrtn <- sqrt(lengthx)
load(file='createtable')
a<-table.start()
a<-table.row.start(a)
a<-table.element(a,'Autocorrelation Function',4,TRUE)
a<-table.row.end(a)
a<-table.row.start(a)
a<-table.element(a,'Time lag k',header=TRUE)
a<-table.element(a,hyperlink('basics.htm','ACF(k)','click here for more information about the Autocorrelation Function'),header=TRUE)
a<-table.element(a,'T-STAT',header=TRUE)
a<-table.element(a,'P-value',header=TRUE)
a<-table.row.end(a)
for (i in 2:(par1+1)) {
a<-table.row.start(a)
a<-table.element(a,i-1,header=TRUE)
a<-table.element(a,round(myacf[i],6))
mytstat <- myacf[i]*sqrtn
a<-table.element(a,round(mytstat,4))
a<-table.element(a,round(1-pt(abs(mytstat),lengthx),6))
a<-table.row.end(a)
}
a<-table.end(a)
table.save(a,file='mytable.tab')
a<-table.start()
a<-table.row.start(a)
a<-table.element(a,'Partial Autocorrelation Function',4,TRUE)
a<-table.row.end(a)
a<-table.row.start(a)
a<-table.element(a,'Time lag k',header=TRUE)
a<-table.element(a,hyperlink('basics.htm','PACF(k)','click here for more information about the Partial Autocorrelation Function'),header=TRUE)
a<-table.element(a,'T-STAT',header=TRUE)
a<-table.element(a,'P-value',header=TRUE)
a<-table.row.end(a)
for (i in 1:par1) {
a<-table.row.start(a)
a<-table.element(a,i,header=TRUE)
a<-table.element(a,round(mypacf[i],6))
mytstat <- mypacf[i]*sqrtn
a<-table.element(a,round(mytstat,4))
a<-table.element(a,round(1-pt(abs(mytstat),lengthx),6))
a<-table.row.end(a)
}
a<-table.end(a)
table.save(a,file='mytable1.tab')