Free Statistics

of Irreproducible Research!

Author's title

Author*Unverified author*
R Software Modulerwasp_autocorrelation.wasp
Title produced by software(Partial) Autocorrelation Function
Date of computationMon, 02 Mar 2015 14:10:25 +0000
Cite this page as followsStatistical Computations at FreeStatistics.org, Office for Research Development and Education, URL https://freestatistics.org/blog/index.php?v=date/2015/Mar/02/t1425305494wg6fxtetmeyfavg.htm/, Retrieved Sun, 19 May 2024 10:50:31 +0000
Statistical Computations at FreeStatistics.org, Office for Research Development and Education, URL https://freestatistics.org/blog/index.php?pk=277808, Retrieved Sun, 19 May 2024 10:50:31 +0000
QR Codes:

Original text written by user:
IsPrivate?No (this computation is public)
User-defined keywords
Estimated Impact106
Family? (F = Feedback message, R = changed R code, M = changed R Module, P = changed Parameters, D = changed Data)
-       [(Partial) Autocorrelation Function] [] [2015-03-02 14:10:25] [679411f6187277139d0a9a0a87b165a8] [Current]
Feedback Forum

Post a new message
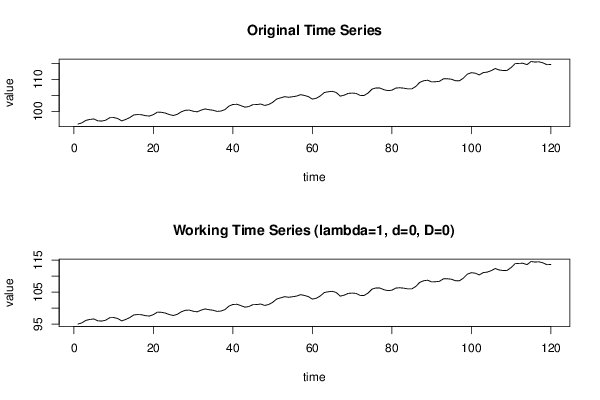
Dataseries X:
96,01
96,39
97,16
97,46
97,6
97,02
96,95
97,23
98
98,04
97,76
96,99
97,44
98
98,84
98,98
98,92
98,63
98,52
98,97
99,74
99,68
99,45
98,97
98,68
99,06
99,84
100,3
100,38
100,02
99,83
100,36
100,74
100,49
100,33
99,96
100,08
100,54
101,63
102,12
102,19
101,77
101,29
101,47
102,07
102,11
102,26
101,83
102,11
102,8
103,82
104,2
104,57
104,38
104,54
104,74
105,19
104,95
104,57
103,81
104,08
104,81
105,86
106,1
106,24
105,87
104,74
105,03
105,59
105,69
105,58
104,96
104,93
105,68
106,93
107,29
107,25
106,74
106,44
106,6
107,26
107,35
107,22
106,99
107
107,74
109,02
109,54
109,71
109,18
109,23
109,38
110,17
110,15
110,01
109,54
109,52
110,35
111,61
112,06
111,9
111,36
112,09
112,24
112,7
113,36
112,9
112,74
112,77
113,66
114,87
114,97
115
114,57
115,54
115,39
115,46
115,13
114,56
114,62


Summary of computational transaction
Raw Inputview raw input (R code)
Raw Outputview raw output of R engine
Computing time2 seconds
R Server'George Udny Yule' @ yule.wessa.net

\begin{tabular}{lllllllll}
\hline
Summary of computational transaction \tabularnewline
Raw Input & view raw input (R code)  \tabularnewline
Raw Output & view raw output of R engine  \tabularnewline
Computing time & 2 seconds \tabularnewline
R Server & 'George Udny Yule' @ yule.wessa.net \tabularnewline
\hline
\end{tabular}
%Source: https://freestatistics.org/blog/index.php?pk=277808&T=0

[TABLE]
[ROW][C]Summary of computational transaction[/C][/ROW]
[ROW][C]Raw Input[/C][C]view raw input (R code) [/C][/ROW]
[ROW][C]Raw Output[/C][C]view raw output of R engine [/C][/ROW]
[ROW][C]Computing time[/C][C]2 seconds[/C][/ROW]
[ROW][C]R Server[/C][C]'George Udny Yule' @ yule.wessa.net[/C][/ROW]
[/TABLE]
Source: https://freestatistics.org/blog/index.php?pk=277808&T=0

Globally Unique Identifier (entire table): ba.freestatistics.org/blog/index.php?pk=277808&T=0

As an alternative you can also use a QR Code:  

The GUIDs for individual cells are displayed in the table below:

Summary of computational transaction
Raw Inputview raw input (R code)
Raw Outputview raw output of R engine
Computing time2 seconds
R Server'George Udny Yule' @ yule.wessa.net


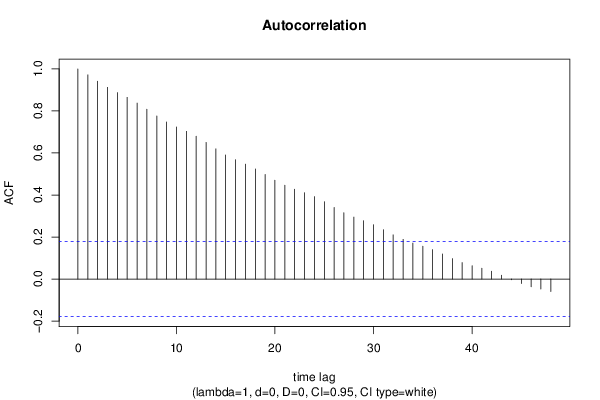
Autocorrelation Function
Time lag kACF(k)T-STATP-value
10.97195510.64720
20.94154410.31410
30.9125159.99610
40.8874979.7220
50.8646479.47170
60.8374159.17340
70.8078698.84980
80.7758498.4990
90.7477968.19170
100.7238767.92970
110.703097.7020
120.6793667.44210
130.6504157.12490
140.6195646.7870
150.5907746.47160
160.5676216.2180
170.5468975.9910
180.5237465.73730
190.4980745.45610
200.4705495.15461e-06
210.4465634.89192e-06
220.4271054.67874e-06
230.410834.50048e-06
240.3924954.29961.8e-05
250.3679364.03054.9e-05
260.3404943.72990.000147
270.3156083.45730.000378
280.2949643.23120.000796
290.277743.04250.001441
300.2582362.82880.002739
310.2349312.57350.005642
320.2104112.30490.011444
330.1889512.06980.020306
340.1710921.87420.031666
350.1564261.71360.044595
360.1401281.5350.063704
370.1196331.31050.096263
380.0973191.06610.144265
390.0781550.85610.196813
400.0634960.69560.244023
410.0514740.56390.286947
420.0373750.40940.34148
430.0180170.19740.421939
44-0.003081-0.03380.486566
45-0.021408-0.23450.407495
46-0.036337-0.3980.345651
47-0.047279-0.51790.302735
48-0.059617-0.65310.257479

\begin{tabular}{lllllllll}
\hline
Autocorrelation Function \tabularnewline
Time lag k & ACF(k) & T-STAT & P-value \tabularnewline
1 & 0.971955 & 10.6472 & 0 \tabularnewline
2 & 0.941544 & 10.3141 & 0 \tabularnewline
3 & 0.912515 & 9.9961 & 0 \tabularnewline
4 & 0.887497 & 9.722 & 0 \tabularnewline
5 & 0.864647 & 9.4717 & 0 \tabularnewline
6 & 0.837415 & 9.1734 & 0 \tabularnewline
7 & 0.807869 & 8.8498 & 0 \tabularnewline
8 & 0.775849 & 8.499 & 0 \tabularnewline
9 & 0.747796 & 8.1917 & 0 \tabularnewline
10 & 0.723876 & 7.9297 & 0 \tabularnewline
11 & 0.70309 & 7.702 & 0 \tabularnewline
12 & 0.679366 & 7.4421 & 0 \tabularnewline
13 & 0.650415 & 7.1249 & 0 \tabularnewline
14 & 0.619564 & 6.787 & 0 \tabularnewline
15 & 0.590774 & 6.4716 & 0 \tabularnewline
16 & 0.567621 & 6.218 & 0 \tabularnewline
17 & 0.546897 & 5.991 & 0 \tabularnewline
18 & 0.523746 & 5.7373 & 0 \tabularnewline
19 & 0.498074 & 5.4561 & 0 \tabularnewline
20 & 0.470549 & 5.1546 & 1e-06 \tabularnewline
21 & 0.446563 & 4.8919 & 2e-06 \tabularnewline
22 & 0.427105 & 4.6787 & 4e-06 \tabularnewline
23 & 0.41083 & 4.5004 & 8e-06 \tabularnewline
24 & 0.392495 & 4.2996 & 1.8e-05 \tabularnewline
25 & 0.367936 & 4.0305 & 4.9e-05 \tabularnewline
26 & 0.340494 & 3.7299 & 0.000147 \tabularnewline
27 & 0.315608 & 3.4573 & 0.000378 \tabularnewline
28 & 0.294964 & 3.2312 & 0.000796 \tabularnewline
29 & 0.27774 & 3.0425 & 0.001441 \tabularnewline
30 & 0.258236 & 2.8288 & 0.002739 \tabularnewline
31 & 0.234931 & 2.5735 & 0.005642 \tabularnewline
32 & 0.210411 & 2.3049 & 0.011444 \tabularnewline
33 & 0.188951 & 2.0698 & 0.020306 \tabularnewline
34 & 0.171092 & 1.8742 & 0.031666 \tabularnewline
35 & 0.156426 & 1.7136 & 0.044595 \tabularnewline
36 & 0.140128 & 1.535 & 0.063704 \tabularnewline
37 & 0.119633 & 1.3105 & 0.096263 \tabularnewline
38 & 0.097319 & 1.0661 & 0.144265 \tabularnewline
39 & 0.078155 & 0.8561 & 0.196813 \tabularnewline
40 & 0.063496 & 0.6956 & 0.244023 \tabularnewline
41 & 0.051474 & 0.5639 & 0.286947 \tabularnewline
42 & 0.037375 & 0.4094 & 0.34148 \tabularnewline
43 & 0.018017 & 0.1974 & 0.421939 \tabularnewline
44 & -0.003081 & -0.0338 & 0.486566 \tabularnewline
45 & -0.021408 & -0.2345 & 0.407495 \tabularnewline
46 & -0.036337 & -0.398 & 0.345651 \tabularnewline
47 & -0.047279 & -0.5179 & 0.302735 \tabularnewline
48 & -0.059617 & -0.6531 & 0.257479 \tabularnewline
\hline
\end{tabular}
%Source: https://freestatistics.org/blog/index.php?pk=277808&T=1

[TABLE]
[ROW][C]Autocorrelation Function[/C][/ROW]
[ROW][C]Time lag k[/C][C]ACF(k)[/C][C]T-STAT[/C][C]P-value[/C][/ROW]
[ROW][C]1[/C][C]0.971955[/C][C]10.6472[/C][C]0[/C][/ROW]
[ROW][C]2[/C][C]0.941544[/C][C]10.3141[/C][C]0[/C][/ROW]
[ROW][C]3[/C][C]0.912515[/C][C]9.9961[/C][C]0[/C][/ROW]
[ROW][C]4[/C][C]0.887497[/C][C]9.722[/C][C]0[/C][/ROW]
[ROW][C]5[/C][C]0.864647[/C][C]9.4717[/C][C]0[/C][/ROW]
[ROW][C]6[/C][C]0.837415[/C][C]9.1734[/C][C]0[/C][/ROW]
[ROW][C]7[/C][C]0.807869[/C][C]8.8498[/C][C]0[/C][/ROW]
[ROW][C]8[/C][C]0.775849[/C][C]8.499[/C][C]0[/C][/ROW]
[ROW][C]9[/C][C]0.747796[/C][C]8.1917[/C][C]0[/C][/ROW]
[ROW][C]10[/C][C]0.723876[/C][C]7.9297[/C][C]0[/C][/ROW]
[ROW][C]11[/C][C]0.70309[/C][C]7.702[/C][C]0[/C][/ROW]
[ROW][C]12[/C][C]0.679366[/C][C]7.4421[/C][C]0[/C][/ROW]
[ROW][C]13[/C][C]0.650415[/C][C]7.1249[/C][C]0[/C][/ROW]
[ROW][C]14[/C][C]0.619564[/C][C]6.787[/C][C]0[/C][/ROW]
[ROW][C]15[/C][C]0.590774[/C][C]6.4716[/C][C]0[/C][/ROW]
[ROW][C]16[/C][C]0.567621[/C][C]6.218[/C][C]0[/C][/ROW]
[ROW][C]17[/C][C]0.546897[/C][C]5.991[/C][C]0[/C][/ROW]
[ROW][C]18[/C][C]0.523746[/C][C]5.7373[/C][C]0[/C][/ROW]
[ROW][C]19[/C][C]0.498074[/C][C]5.4561[/C][C]0[/C][/ROW]
[ROW][C]20[/C][C]0.470549[/C][C]5.1546[/C][C]1e-06[/C][/ROW]
[ROW][C]21[/C][C]0.446563[/C][C]4.8919[/C][C]2e-06[/C][/ROW]
[ROW][C]22[/C][C]0.427105[/C][C]4.6787[/C][C]4e-06[/C][/ROW]
[ROW][C]23[/C][C]0.41083[/C][C]4.5004[/C][C]8e-06[/C][/ROW]
[ROW][C]24[/C][C]0.392495[/C][C]4.2996[/C][C]1.8e-05[/C][/ROW]
[ROW][C]25[/C][C]0.367936[/C][C]4.0305[/C][C]4.9e-05[/C][/ROW]
[ROW][C]26[/C][C]0.340494[/C][C]3.7299[/C][C]0.000147[/C][/ROW]
[ROW][C]27[/C][C]0.315608[/C][C]3.4573[/C][C]0.000378[/C][/ROW]
[ROW][C]28[/C][C]0.294964[/C][C]3.2312[/C][C]0.000796[/C][/ROW]
[ROW][C]29[/C][C]0.27774[/C][C]3.0425[/C][C]0.001441[/C][/ROW]
[ROW][C]30[/C][C]0.258236[/C][C]2.8288[/C][C]0.002739[/C][/ROW]
[ROW][C]31[/C][C]0.234931[/C][C]2.5735[/C][C]0.005642[/C][/ROW]
[ROW][C]32[/C][C]0.210411[/C][C]2.3049[/C][C]0.011444[/C][/ROW]
[ROW][C]33[/C][C]0.188951[/C][C]2.0698[/C][C]0.020306[/C][/ROW]
[ROW][C]34[/C][C]0.171092[/C][C]1.8742[/C][C]0.031666[/C][/ROW]
[ROW][C]35[/C][C]0.156426[/C][C]1.7136[/C][C]0.044595[/C][/ROW]
[ROW][C]36[/C][C]0.140128[/C][C]1.535[/C][C]0.063704[/C][/ROW]
[ROW][C]37[/C][C]0.119633[/C][C]1.3105[/C][C]0.096263[/C][/ROW]
[ROW][C]38[/C][C]0.097319[/C][C]1.0661[/C][C]0.144265[/C][/ROW]
[ROW][C]39[/C][C]0.078155[/C][C]0.8561[/C][C]0.196813[/C][/ROW]
[ROW][C]40[/C][C]0.063496[/C][C]0.6956[/C][C]0.244023[/C][/ROW]
[ROW][C]41[/C][C]0.051474[/C][C]0.5639[/C][C]0.286947[/C][/ROW]
[ROW][C]42[/C][C]0.037375[/C][C]0.4094[/C][C]0.34148[/C][/ROW]
[ROW][C]43[/C][C]0.018017[/C][C]0.1974[/C][C]0.421939[/C][/ROW]
[ROW][C]44[/C][C]-0.003081[/C][C]-0.0338[/C][C]0.486566[/C][/ROW]
[ROW][C]45[/C][C]-0.021408[/C][C]-0.2345[/C][C]0.407495[/C][/ROW]
[ROW][C]46[/C][C]-0.036337[/C][C]-0.398[/C][C]0.345651[/C][/ROW]
[ROW][C]47[/C][C]-0.047279[/C][C]-0.5179[/C][C]0.302735[/C][/ROW]
[ROW][C]48[/C][C]-0.059617[/C][C]-0.6531[/C][C]0.257479[/C][/ROW]
[/TABLE]
Source: https://freestatistics.org/blog/index.php?pk=277808&T=1

Globally Unique Identifier (entire table): ba.freestatistics.org/blog/index.php?pk=277808&T=1

As an alternative you can also use a QR Code:  

The GUIDs for individual cells are displayed in the table below:

Autocorrelation Function
Time lag kACF(k)T-STATP-value
10.97195510.64720
20.94154410.31410
30.9125159.99610
40.8874979.7220
50.8646479.47170
60.8374159.17340
70.8078698.84980
80.7758498.4990
90.7477968.19170
100.7238767.92970
110.703097.7020
120.6793667.44210
130.6504157.12490
140.6195646.7870
150.5907746.47160
160.5676216.2180
170.5468975.9910
180.5237465.73730
190.4980745.45610
200.4705495.15461e-06
210.4465634.89192e-06
220.4271054.67874e-06
230.410834.50048e-06
240.3924954.29961.8e-05
250.3679364.03054.9e-05
260.3404943.72990.000147
270.3156083.45730.000378
280.2949643.23120.000796
290.277743.04250.001441
300.2582362.82880.002739
310.2349312.57350.005642
320.2104112.30490.011444
330.1889512.06980.020306
340.1710921.87420.031666
350.1564261.71360.044595
360.1401281.5350.063704
370.1196331.31050.096263
380.0973191.06610.144265
390.0781550.85610.196813
400.0634960.69560.244023
410.0514740.56390.286947
420.0373750.40940.34148
430.0180170.19740.421939
44-0.003081-0.03380.486566
45-0.021408-0.23450.407495
46-0.036337-0.3980.345651
47-0.047279-0.51790.302735
48-0.059617-0.65310.257479


Partial Autocorrelation Function
Time lag kPACF(k)T-STATP-value
10.97195510.64720
2-0.056988-0.62430.266818
30.0111530.12220.45148
40.0554090.6070.272509
50.0207020.22680.41049
6-0.09194-1.00720.157943
7-0.044151-0.48360.314758
8-0.056914-0.62350.267081
90.0478370.5240.300614
100.0425280.46590.321078
110.0390620.42790.334743
12-0.058314-0.63880.262088
13-0.085188-0.93320.176297
14-0.045018-0.49320.311403
150.005460.05980.476203
160.0547830.60010.27478
170.0201770.2210.412725
18-0.040302-0.44150.329826
19-0.026108-0.2860.387686
20-0.038056-0.41690.338756
210.0241330.26440.395979
220.0307340.33670.368474
230.0298760.32730.372015
24-0.030369-0.33270.369978
25-0.088015-0.96420.168454
26-0.054296-0.59480.276555
270.0078620.08610.465756
280.012270.13440.446651
290.0312420.34220.366386
30-0.030746-0.33680.368428
31-0.038932-0.42650.335264
32-0.019932-0.21830.413765
330.0102940.11280.455203
34-0.003928-0.0430.482876
350.022430.24570.403166
36-0.019352-0.2120.416238
37-0.04015-0.43980.330429
38-0.028229-0.30920.37884
390.0192220.21060.41679
400.0098920.10840.456944
410.0110910.12150.451749
42-0.025903-0.28370.388546
43-0.062714-0.6870.246704
44-0.028589-0.31320.377347
450.0054610.05980.4762
46-0.01329-0.14560.442249
470.0350790.38430.350728
48-0.011708-0.12830.44908

\begin{tabular}{lllllllll}
\hline
Partial Autocorrelation Function \tabularnewline
Time lag k & PACF(k) & T-STAT & P-value \tabularnewline
1 & 0.971955 & 10.6472 & 0 \tabularnewline
2 & -0.056988 & -0.6243 & 0.266818 \tabularnewline
3 & 0.011153 & 0.1222 & 0.45148 \tabularnewline
4 & 0.055409 & 0.607 & 0.272509 \tabularnewline
5 & 0.020702 & 0.2268 & 0.41049 \tabularnewline
6 & -0.09194 & -1.0072 & 0.157943 \tabularnewline
7 & -0.044151 & -0.4836 & 0.314758 \tabularnewline
8 & -0.056914 & -0.6235 & 0.267081 \tabularnewline
9 & 0.047837 & 0.524 & 0.300614 \tabularnewline
10 & 0.042528 & 0.4659 & 0.321078 \tabularnewline
11 & 0.039062 & 0.4279 & 0.334743 \tabularnewline
12 & -0.058314 & -0.6388 & 0.262088 \tabularnewline
13 & -0.085188 & -0.9332 & 0.176297 \tabularnewline
14 & -0.045018 & -0.4932 & 0.311403 \tabularnewline
15 & 0.00546 & 0.0598 & 0.476203 \tabularnewline
16 & 0.054783 & 0.6001 & 0.27478 \tabularnewline
17 & 0.020177 & 0.221 & 0.412725 \tabularnewline
18 & -0.040302 & -0.4415 & 0.329826 \tabularnewline
19 & -0.026108 & -0.286 & 0.387686 \tabularnewline
20 & -0.038056 & -0.4169 & 0.338756 \tabularnewline
21 & 0.024133 & 0.2644 & 0.395979 \tabularnewline
22 & 0.030734 & 0.3367 & 0.368474 \tabularnewline
23 & 0.029876 & 0.3273 & 0.372015 \tabularnewline
24 & -0.030369 & -0.3327 & 0.369978 \tabularnewline
25 & -0.088015 & -0.9642 & 0.168454 \tabularnewline
26 & -0.054296 & -0.5948 & 0.276555 \tabularnewline
27 & 0.007862 & 0.0861 & 0.465756 \tabularnewline
28 & 0.01227 & 0.1344 & 0.446651 \tabularnewline
29 & 0.031242 & 0.3422 & 0.366386 \tabularnewline
30 & -0.030746 & -0.3368 & 0.368428 \tabularnewline
31 & -0.038932 & -0.4265 & 0.335264 \tabularnewline
32 & -0.019932 & -0.2183 & 0.413765 \tabularnewline
33 & 0.010294 & 0.1128 & 0.455203 \tabularnewline
34 & -0.003928 & -0.043 & 0.482876 \tabularnewline
35 & 0.02243 & 0.2457 & 0.403166 \tabularnewline
36 & -0.019352 & -0.212 & 0.416238 \tabularnewline
37 & -0.04015 & -0.4398 & 0.330429 \tabularnewline
38 & -0.028229 & -0.3092 & 0.37884 \tabularnewline
39 & 0.019222 & 0.2106 & 0.41679 \tabularnewline
40 & 0.009892 & 0.1084 & 0.456944 \tabularnewline
41 & 0.011091 & 0.1215 & 0.451749 \tabularnewline
42 & -0.025903 & -0.2837 & 0.388546 \tabularnewline
43 & -0.062714 & -0.687 & 0.246704 \tabularnewline
44 & -0.028589 & -0.3132 & 0.377347 \tabularnewline
45 & 0.005461 & 0.0598 & 0.4762 \tabularnewline
46 & -0.01329 & -0.1456 & 0.442249 \tabularnewline
47 & 0.035079 & 0.3843 & 0.350728 \tabularnewline
48 & -0.011708 & -0.1283 & 0.44908 \tabularnewline
\hline
\end{tabular}
%Source: https://freestatistics.org/blog/index.php?pk=277808&T=2

[TABLE]
[ROW][C]Partial Autocorrelation Function[/C][/ROW]
[ROW][C]Time lag k[/C][C]PACF(k)[/C][C]T-STAT[/C][C]P-value[/C][/ROW]
[ROW][C]1[/C][C]0.971955[/C][C]10.6472[/C][C]0[/C][/ROW]
[ROW][C]2[/C][C]-0.056988[/C][C]-0.6243[/C][C]0.266818[/C][/ROW]
[ROW][C]3[/C][C]0.011153[/C][C]0.1222[/C][C]0.45148[/C][/ROW]
[ROW][C]4[/C][C]0.055409[/C][C]0.607[/C][C]0.272509[/C][/ROW]
[ROW][C]5[/C][C]0.020702[/C][C]0.2268[/C][C]0.41049[/C][/ROW]
[ROW][C]6[/C][C]-0.09194[/C][C]-1.0072[/C][C]0.157943[/C][/ROW]
[ROW][C]7[/C][C]-0.044151[/C][C]-0.4836[/C][C]0.314758[/C][/ROW]
[ROW][C]8[/C][C]-0.056914[/C][C]-0.6235[/C][C]0.267081[/C][/ROW]
[ROW][C]9[/C][C]0.047837[/C][C]0.524[/C][C]0.300614[/C][/ROW]
[ROW][C]10[/C][C]0.042528[/C][C]0.4659[/C][C]0.321078[/C][/ROW]
[ROW][C]11[/C][C]0.039062[/C][C]0.4279[/C][C]0.334743[/C][/ROW]
[ROW][C]12[/C][C]-0.058314[/C][C]-0.6388[/C][C]0.262088[/C][/ROW]
[ROW][C]13[/C][C]-0.085188[/C][C]-0.9332[/C][C]0.176297[/C][/ROW]
[ROW][C]14[/C][C]-0.045018[/C][C]-0.4932[/C][C]0.311403[/C][/ROW]
[ROW][C]15[/C][C]0.00546[/C][C]0.0598[/C][C]0.476203[/C][/ROW]
[ROW][C]16[/C][C]0.054783[/C][C]0.6001[/C][C]0.27478[/C][/ROW]
[ROW][C]17[/C][C]0.020177[/C][C]0.221[/C][C]0.412725[/C][/ROW]
[ROW][C]18[/C][C]-0.040302[/C][C]-0.4415[/C][C]0.329826[/C][/ROW]
[ROW][C]19[/C][C]-0.026108[/C][C]-0.286[/C][C]0.387686[/C][/ROW]
[ROW][C]20[/C][C]-0.038056[/C][C]-0.4169[/C][C]0.338756[/C][/ROW]
[ROW][C]21[/C][C]0.024133[/C][C]0.2644[/C][C]0.395979[/C][/ROW]
[ROW][C]22[/C][C]0.030734[/C][C]0.3367[/C][C]0.368474[/C][/ROW]
[ROW][C]23[/C][C]0.029876[/C][C]0.3273[/C][C]0.372015[/C][/ROW]
[ROW][C]24[/C][C]-0.030369[/C][C]-0.3327[/C][C]0.369978[/C][/ROW]
[ROW][C]25[/C][C]-0.088015[/C][C]-0.9642[/C][C]0.168454[/C][/ROW]
[ROW][C]26[/C][C]-0.054296[/C][C]-0.5948[/C][C]0.276555[/C][/ROW]
[ROW][C]27[/C][C]0.007862[/C][C]0.0861[/C][C]0.465756[/C][/ROW]
[ROW][C]28[/C][C]0.01227[/C][C]0.1344[/C][C]0.446651[/C][/ROW]
[ROW][C]29[/C][C]0.031242[/C][C]0.3422[/C][C]0.366386[/C][/ROW]
[ROW][C]30[/C][C]-0.030746[/C][C]-0.3368[/C][C]0.368428[/C][/ROW]
[ROW][C]31[/C][C]-0.038932[/C][C]-0.4265[/C][C]0.335264[/C][/ROW]
[ROW][C]32[/C][C]-0.019932[/C][C]-0.2183[/C][C]0.413765[/C][/ROW]
[ROW][C]33[/C][C]0.010294[/C][C]0.1128[/C][C]0.455203[/C][/ROW]
[ROW][C]34[/C][C]-0.003928[/C][C]-0.043[/C][C]0.482876[/C][/ROW]
[ROW][C]35[/C][C]0.02243[/C][C]0.2457[/C][C]0.403166[/C][/ROW]
[ROW][C]36[/C][C]-0.019352[/C][C]-0.212[/C][C]0.416238[/C][/ROW]
[ROW][C]37[/C][C]-0.04015[/C][C]-0.4398[/C][C]0.330429[/C][/ROW]
[ROW][C]38[/C][C]-0.028229[/C][C]-0.3092[/C][C]0.37884[/C][/ROW]
[ROW][C]39[/C][C]0.019222[/C][C]0.2106[/C][C]0.41679[/C][/ROW]
[ROW][C]40[/C][C]0.009892[/C][C]0.1084[/C][C]0.456944[/C][/ROW]
[ROW][C]41[/C][C]0.011091[/C][C]0.1215[/C][C]0.451749[/C][/ROW]
[ROW][C]42[/C][C]-0.025903[/C][C]-0.2837[/C][C]0.388546[/C][/ROW]
[ROW][C]43[/C][C]-0.062714[/C][C]-0.687[/C][C]0.246704[/C][/ROW]
[ROW][C]44[/C][C]-0.028589[/C][C]-0.3132[/C][C]0.377347[/C][/ROW]
[ROW][C]45[/C][C]0.005461[/C][C]0.0598[/C][C]0.4762[/C][/ROW]
[ROW][C]46[/C][C]-0.01329[/C][C]-0.1456[/C][C]0.442249[/C][/ROW]
[ROW][C]47[/C][C]0.035079[/C][C]0.3843[/C][C]0.350728[/C][/ROW]
[ROW][C]48[/C][C]-0.011708[/C][C]-0.1283[/C][C]0.44908[/C][/ROW]
[/TABLE]
Source: https://freestatistics.org/blog/index.php?pk=277808&T=2

Globally Unique Identifier (entire table): ba.freestatistics.org/blog/index.php?pk=277808&T=2

As an alternative you can also use a QR Code:  

The GUIDs for individual cells are displayed in the table below:

Partial Autocorrelation Function
Time lag kPACF(k)T-STATP-value
10.97195510.64720
2-0.056988-0.62430.266818
30.0111530.12220.45148
40.0554090.6070.272509
50.0207020.22680.41049
6-0.09194-1.00720.157943
7-0.044151-0.48360.314758
8-0.056914-0.62350.267081
90.0478370.5240.300614
100.0425280.46590.321078
110.0390620.42790.334743
12-0.058314-0.63880.262088
13-0.085188-0.93320.176297
14-0.045018-0.49320.311403
150.005460.05980.476203
160.0547830.60010.27478
170.0201770.2210.412725
18-0.040302-0.44150.329826
19-0.026108-0.2860.387686
20-0.038056-0.41690.338756
210.0241330.26440.395979
220.0307340.33670.368474
230.0298760.32730.372015
24-0.030369-0.33270.369978
25-0.088015-0.96420.168454
26-0.054296-0.59480.276555
270.0078620.08610.465756
280.012270.13440.446651
290.0312420.34220.366386
30-0.030746-0.33680.368428
31-0.038932-0.42650.335264
32-0.019932-0.21830.413765
330.0102940.11280.455203
34-0.003928-0.0430.482876
350.022430.24570.403166
36-0.019352-0.2120.416238
37-0.04015-0.43980.330429
38-0.028229-0.30920.37884
390.0192220.21060.41679
400.0098920.10840.456944
410.0110910.12150.451749
42-0.025903-0.28370.388546
43-0.062714-0.6870.246704
44-0.028589-0.31320.377347
450.0054610.05980.4762
46-0.01329-0.14560.442249
470.0350790.38430.350728
48-0.011708-0.12830.44908


Parameters (Session):
par1 = 48 ; par2 = 1 ; par3 = 0 ; par4 = 0 ; par5 = 12 ; par6 = White Noise ; par7 = 0.95 ;
Parameters (R input):
par1 = 48 ; par2 = 1 ; par3 = 0 ; par4 = 0 ; par5 = 12 ; par6 = White Noise ; par7 = 0.95 ; par8 = ;
R code (references can be found in the software module):
if (par1 == 'Default') {
par1 = 10*log10(length(x))
} else {
par1 <- as.numeric(par1)
}
par2 <- as.numeric(par2)
par3 <- as.numeric(par3)
par4 <- as.numeric(par4)
par5 <- as.numeric(par5)
if (par6 == 'White Noise') par6 <- 'white' else par6 <- 'ma'
par7 <- as.numeric(par7)
if (par8 != '') par8 <- as.numeric(par8)
ox <- x
if (par8 == '') {
if (par2 == 0) {
x <- log(x)
} else {
x <- (x ^ par2 - 1) / par2
}
} else {
x <- log(x,base=par8)
}
if (par3 > 0) x <- diff(x,lag=1,difference=par3)
if (par4 > 0) x <- diff(x,lag=par5,difference=par4)
bitmap(file='picts.png')
op <- par(mfrow=c(2,1))
plot(ox,type='l',main='Original Time Series',xlab='time',ylab='value')
if (par8=='') {
mytitle <- paste('Working Time Series (lambda=',par2,', d=',par3,', D=',par4,')',sep='')
mysub <- paste('(lambda=',par2,', d=',par3,', D=',par4,', CI=', par7, ', CI type=',par6,')',sep='')
} else {
mytitle <- paste('Working Time Series (base=',par8,', d=',par3,', D=',par4,')',sep='')
mysub <- paste('(base=',par8,', d=',par3,', D=',par4,', CI=', par7, ', CI type=',par6,')',sep='')
}
plot(x,type='l', main=mytitle,xlab='time',ylab='value')
par(op)
dev.off()
bitmap(file='pic1.png')
racf <- acf(x, par1, main='Autocorrelation', xlab='time lag', ylab='ACF', ci.type=par6, ci=par7, sub=mysub)
dev.off()
bitmap(file='pic2.png')
rpacf <- pacf(x,par1,main='Partial Autocorrelation',xlab='lags',ylab='PACF',sub=mysub)
dev.off()
(myacf <- c(racf$acf))
(mypacf <- c(rpacf$acf))
lengthx <- length(x)
sqrtn <- sqrt(lengthx)
load(file='createtable')
a<-table.start()
a<-table.row.start(a)
a<-table.element(a,'Autocorrelation Function',4,TRUE)
a<-table.row.end(a)
a<-table.row.start(a)
a<-table.element(a,'Time lag k',header=TRUE)
a<-table.element(a,hyperlink('basics.htm','ACF(k)','click here for more information about the Autocorrelation Function'),header=TRUE)
a<-table.element(a,'T-STAT',header=TRUE)
a<-table.element(a,'P-value',header=TRUE)
a<-table.row.end(a)
for (i in 2:(par1+1)) {
a<-table.row.start(a)
a<-table.element(a,i-1,header=TRUE)
a<-table.element(a,round(myacf[i],6))
mytstat <- myacf[i]*sqrtn
a<-table.element(a,round(mytstat,4))
a<-table.element(a,round(1-pt(abs(mytstat),lengthx),6))
a<-table.row.end(a)
}
a<-table.end(a)
table.save(a,file='mytable.tab')
a<-table.start()
a<-table.row.start(a)
a<-table.element(a,'Partial Autocorrelation Function',4,TRUE)
a<-table.row.end(a)
a<-table.row.start(a)
a<-table.element(a,'Time lag k',header=TRUE)
a<-table.element(a,hyperlink('basics.htm','PACF(k)','click here for more information about the Partial Autocorrelation Function'),header=TRUE)
a<-table.element(a,'T-STAT',header=TRUE)
a<-table.element(a,'P-value',header=TRUE)
a<-table.row.end(a)
for (i in 1:par1) {
a<-table.row.start(a)
a<-table.element(a,i,header=TRUE)
a<-table.element(a,round(mypacf[i],6))
mytstat <- mypacf[i]*sqrtn
a<-table.element(a,round(mytstat,4))
a<-table.element(a,round(1-pt(abs(mytstat),lengthx),6))
a<-table.row.end(a)
}
a<-table.end(a)
table.save(a,file='mytable1.tab')