Free Statistics

of Irreproducible Research!

Author's title

Author*Unverified author*
R Software Modulerwasp_autocorrelation.wasp
Title produced by software(Partial) Autocorrelation Function
Date of computationMon, 02 Mar 2015 09:59:15 +0000
Cite this page as followsStatistical Computations at FreeStatistics.org, Office for Research Development and Education, URL https://freestatistics.org/blog/index.php?v=date/2015/Mar/02/t1425290500sipp8hlvwf9yg9k.htm/, Retrieved Sun, 19 May 2024 12:42:38 +0000
Statistical Computations at FreeStatistics.org, Office for Research Development and Education, URL https://freestatistics.org/blog/index.php?pk=277776, Retrieved Sun, 19 May 2024 12:42:38 +0000
QR Codes:

Original text written by user:
IsPrivate?No (this computation is public)
User-defined keywords
Estimated Impact118
Family? (F = Feedback message, R = changed R code, M = changed R Module, P = changed Parameters, D = changed Data)
-       [(Partial) Autocorrelation Function] [] [2015-03-02 09:59:15] [10a961572d82585f4ece1fe77e85ff9b] [Current]
Feedback Forum

Post a new message
Dataseries X:
96.86
96.89
96.9
96.94
96.88
96.89
96.89
96.95
97.03
97.29
97.37
97.41
97.41
97.32
97.33
97.38
97.47
97.5
97.5
97.58
97.7
97.9
97.98
98.03
98.03
97.94
98.12
98.19
98.34
98.42
98.43
98.45
98.77
99.24
99.46
99.54
99.55
99.24
99.43
99.47
99.57
99.62
99.64
99.75
99.85
100.28
100.52
100.57
100.57
100.27
100.27
100.18
100.16
100.18
100.18
100.59
100.69
101.06
101.15
101.16
101.16
100.81
100.94
101.13
101.29
101.34
101.35
101.7
102.05
102.48
102.66
102.72
102.73
102.18
102.22
102.37
102.53
102.61
102.62
103
103.17
103.52
103.69
103.73
99.57
99.09
99.14
99.36
99.6
99.65
99.8
100.15
100.45
100.89
101.13
101.17


Summary of computational transaction
Raw Inputview raw input (R code)
Raw Outputview raw output of R engine
Computing time2 seconds
R Server'Herman Ole Andreas Wold' @ wold.wessa.net

\begin{tabular}{lllllllll}
\hline
Summary of computational transaction \tabularnewline
Raw Input & view raw input (R code)  \tabularnewline
Raw Output & view raw output of R engine  \tabularnewline
Computing time & 2 seconds \tabularnewline
R Server & 'Herman Ole Andreas Wold' @ wold.wessa.net \tabularnewline
\hline
\end{tabular}
%Source: https://freestatistics.org/blog/index.php?pk=277776&T=0

[TABLE]
[ROW][C]Summary of computational transaction[/C][/ROW]
[ROW][C]Raw Input[/C][C]view raw input (R code) [/C][/ROW]
[ROW][C]Raw Output[/C][C]view raw output of R engine [/C][/ROW]
[ROW][C]Computing time[/C][C]2 seconds[/C][/ROW]
[ROW][C]R Server[/C][C]'Herman Ole Andreas Wold' @ wold.wessa.net[/C][/ROW]
[/TABLE]
Source: https://freestatistics.org/blog/index.php?pk=277776&T=0

Globally Unique Identifier (entire table): ba.freestatistics.org/blog/index.php?pk=277776&T=0

As an alternative you can also use a QR Code:  

The GUIDs for individual cells are displayed in the table below:

Summary of computational transaction
Raw Inputview raw input (R code)
Raw Outputview raw output of R engine
Computing time2 seconds
R Server'Herman Ole Andreas Wold' @ wold.wessa.net


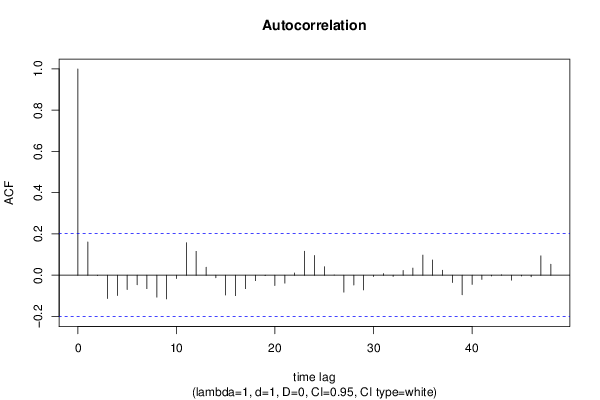
Autocorrelation Function
Time lag kACF(k)T-STATP-value
10.1608771.5680.060099
2-0.001846-0.0180.49284
3-0.112878-1.10020.137013
4-0.098371-0.95880.170047
5-0.069206-0.67450.250803
6-0.046073-0.44910.327204
7-0.065311-0.63660.262966
8-0.106601-1.0390.150717
9-0.115124-1.12210.132326
10-0.01624-0.15830.437282
110.1571491.53170.06446
120.1154961.12570.131561
130.0386260.37650.353698
14-0.01222-0.11910.45272
15-0.096241-0.9380.175302
16-0.099369-0.96850.167619
17-0.065328-0.63670.262914
18-0.026487-0.25820.398419
19-0.00207-0.02020.491973
20-0.050189-0.48920.31292
21-0.038731-0.37750.353321
220.0109890.10710.457466
230.1161731.13230.130177
240.0953140.9290.177619
250.0411240.40080.344724
260.0003310.00320.498715
27-0.082252-0.80170.212365
28-0.047431-0.46230.322461
29-0.071432-0.69620.243992
30-0.006649-0.06480.47423
310.0077320.07540.470043
32-0.005834-0.05690.477388
330.0227630.22190.412448
340.0342640.3340.36957
350.09730.94840.172674
360.0738750.720.236632
370.0239540.23350.407947
38-0.035699-0.3480.364322
39-0.094674-0.92280.179233
40-0.044625-0.4350.332291
41-0.020545-0.20020.420858
42-0.004024-0.03920.4844
430.0009440.00920.496341
44-0.024101-0.23490.407393
45-0.003688-0.03590.485702
46-0.007736-0.07540.470026
470.0936110.91240.181931
480.052740.5140.304207

\begin{tabular}{lllllllll}
\hline
Autocorrelation Function \tabularnewline
Time lag k & ACF(k) & T-STAT & P-value \tabularnewline
1 & 0.160877 & 1.568 & 0.060099 \tabularnewline
2 & -0.001846 & -0.018 & 0.49284 \tabularnewline
3 & -0.112878 & -1.1002 & 0.137013 \tabularnewline
4 & -0.098371 & -0.9588 & 0.170047 \tabularnewline
5 & -0.069206 & -0.6745 & 0.250803 \tabularnewline
6 & -0.046073 & -0.4491 & 0.327204 \tabularnewline
7 & -0.065311 & -0.6366 & 0.262966 \tabularnewline
8 & -0.106601 & -1.039 & 0.150717 \tabularnewline
9 & -0.115124 & -1.1221 & 0.132326 \tabularnewline
10 & -0.01624 & -0.1583 & 0.437282 \tabularnewline
11 & 0.157149 & 1.5317 & 0.06446 \tabularnewline
12 & 0.115496 & 1.1257 & 0.131561 \tabularnewline
13 & 0.038626 & 0.3765 & 0.353698 \tabularnewline
14 & -0.01222 & -0.1191 & 0.45272 \tabularnewline
15 & -0.096241 & -0.938 & 0.175302 \tabularnewline
16 & -0.099369 & -0.9685 & 0.167619 \tabularnewline
17 & -0.065328 & -0.6367 & 0.262914 \tabularnewline
18 & -0.026487 & -0.2582 & 0.398419 \tabularnewline
19 & -0.00207 & -0.0202 & 0.491973 \tabularnewline
20 & -0.050189 & -0.4892 & 0.31292 \tabularnewline
21 & -0.038731 & -0.3775 & 0.353321 \tabularnewline
22 & 0.010989 & 0.1071 & 0.457466 \tabularnewline
23 & 0.116173 & 1.1323 & 0.130177 \tabularnewline
24 & 0.095314 & 0.929 & 0.177619 \tabularnewline
25 & 0.041124 & 0.4008 & 0.344724 \tabularnewline
26 & 0.000331 & 0.0032 & 0.498715 \tabularnewline
27 & -0.082252 & -0.8017 & 0.212365 \tabularnewline
28 & -0.047431 & -0.4623 & 0.322461 \tabularnewline
29 & -0.071432 & -0.6962 & 0.243992 \tabularnewline
30 & -0.006649 & -0.0648 & 0.47423 \tabularnewline
31 & 0.007732 & 0.0754 & 0.470043 \tabularnewline
32 & -0.005834 & -0.0569 & 0.477388 \tabularnewline
33 & 0.022763 & 0.2219 & 0.412448 \tabularnewline
34 & 0.034264 & 0.334 & 0.36957 \tabularnewline
35 & 0.0973 & 0.9484 & 0.172674 \tabularnewline
36 & 0.073875 & 0.72 & 0.236632 \tabularnewline
37 & 0.023954 & 0.2335 & 0.407947 \tabularnewline
38 & -0.035699 & -0.348 & 0.364322 \tabularnewline
39 & -0.094674 & -0.9228 & 0.179233 \tabularnewline
40 & -0.044625 & -0.435 & 0.332291 \tabularnewline
41 & -0.020545 & -0.2002 & 0.420858 \tabularnewline
42 & -0.004024 & -0.0392 & 0.4844 \tabularnewline
43 & 0.000944 & 0.0092 & 0.496341 \tabularnewline
44 & -0.024101 & -0.2349 & 0.407393 \tabularnewline
45 & -0.003688 & -0.0359 & 0.485702 \tabularnewline
46 & -0.007736 & -0.0754 & 0.470026 \tabularnewline
47 & 0.093611 & 0.9124 & 0.181931 \tabularnewline
48 & 0.05274 & 0.514 & 0.304207 \tabularnewline
\hline
\end{tabular}
%Source: https://freestatistics.org/blog/index.php?pk=277776&T=1

[TABLE]
[ROW][C]Autocorrelation Function[/C][/ROW]
[ROW][C]Time lag k[/C][C]ACF(k)[/C][C]T-STAT[/C][C]P-value[/C][/ROW]
[ROW][C]1[/C][C]0.160877[/C][C]1.568[/C][C]0.060099[/C][/ROW]
[ROW][C]2[/C][C]-0.001846[/C][C]-0.018[/C][C]0.49284[/C][/ROW]
[ROW][C]3[/C][C]-0.112878[/C][C]-1.1002[/C][C]0.137013[/C][/ROW]
[ROW][C]4[/C][C]-0.098371[/C][C]-0.9588[/C][C]0.170047[/C][/ROW]
[ROW][C]5[/C][C]-0.069206[/C][C]-0.6745[/C][C]0.250803[/C][/ROW]
[ROW][C]6[/C][C]-0.046073[/C][C]-0.4491[/C][C]0.327204[/C][/ROW]
[ROW][C]7[/C][C]-0.065311[/C][C]-0.6366[/C][C]0.262966[/C][/ROW]
[ROW][C]8[/C][C]-0.106601[/C][C]-1.039[/C][C]0.150717[/C][/ROW]
[ROW][C]9[/C][C]-0.115124[/C][C]-1.1221[/C][C]0.132326[/C][/ROW]
[ROW][C]10[/C][C]-0.01624[/C][C]-0.1583[/C][C]0.437282[/C][/ROW]
[ROW][C]11[/C][C]0.157149[/C][C]1.5317[/C][C]0.06446[/C][/ROW]
[ROW][C]12[/C][C]0.115496[/C][C]1.1257[/C][C]0.131561[/C][/ROW]
[ROW][C]13[/C][C]0.038626[/C][C]0.3765[/C][C]0.353698[/C][/ROW]
[ROW][C]14[/C][C]-0.01222[/C][C]-0.1191[/C][C]0.45272[/C][/ROW]
[ROW][C]15[/C][C]-0.096241[/C][C]-0.938[/C][C]0.175302[/C][/ROW]
[ROW][C]16[/C][C]-0.099369[/C][C]-0.9685[/C][C]0.167619[/C][/ROW]
[ROW][C]17[/C][C]-0.065328[/C][C]-0.6367[/C][C]0.262914[/C][/ROW]
[ROW][C]18[/C][C]-0.026487[/C][C]-0.2582[/C][C]0.398419[/C][/ROW]
[ROW][C]19[/C][C]-0.00207[/C][C]-0.0202[/C][C]0.491973[/C][/ROW]
[ROW][C]20[/C][C]-0.050189[/C][C]-0.4892[/C][C]0.31292[/C][/ROW]
[ROW][C]21[/C][C]-0.038731[/C][C]-0.3775[/C][C]0.353321[/C][/ROW]
[ROW][C]22[/C][C]0.010989[/C][C]0.1071[/C][C]0.457466[/C][/ROW]
[ROW][C]23[/C][C]0.116173[/C][C]1.1323[/C][C]0.130177[/C][/ROW]
[ROW][C]24[/C][C]0.095314[/C][C]0.929[/C][C]0.177619[/C][/ROW]
[ROW][C]25[/C][C]0.041124[/C][C]0.4008[/C][C]0.344724[/C][/ROW]
[ROW][C]26[/C][C]0.000331[/C][C]0.0032[/C][C]0.498715[/C][/ROW]
[ROW][C]27[/C][C]-0.082252[/C][C]-0.8017[/C][C]0.212365[/C][/ROW]
[ROW][C]28[/C][C]-0.047431[/C][C]-0.4623[/C][C]0.322461[/C][/ROW]
[ROW][C]29[/C][C]-0.071432[/C][C]-0.6962[/C][C]0.243992[/C][/ROW]
[ROW][C]30[/C][C]-0.006649[/C][C]-0.0648[/C][C]0.47423[/C][/ROW]
[ROW][C]31[/C][C]0.007732[/C][C]0.0754[/C][C]0.470043[/C][/ROW]
[ROW][C]32[/C][C]-0.005834[/C][C]-0.0569[/C][C]0.477388[/C][/ROW]
[ROW][C]33[/C][C]0.022763[/C][C]0.2219[/C][C]0.412448[/C][/ROW]
[ROW][C]34[/C][C]0.034264[/C][C]0.334[/C][C]0.36957[/C][/ROW]
[ROW][C]35[/C][C]0.0973[/C][C]0.9484[/C][C]0.172674[/C][/ROW]
[ROW][C]36[/C][C]0.073875[/C][C]0.72[/C][C]0.236632[/C][/ROW]
[ROW][C]37[/C][C]0.023954[/C][C]0.2335[/C][C]0.407947[/C][/ROW]
[ROW][C]38[/C][C]-0.035699[/C][C]-0.348[/C][C]0.364322[/C][/ROW]
[ROW][C]39[/C][C]-0.094674[/C][C]-0.9228[/C][C]0.179233[/C][/ROW]
[ROW][C]40[/C][C]-0.044625[/C][C]-0.435[/C][C]0.332291[/C][/ROW]
[ROW][C]41[/C][C]-0.020545[/C][C]-0.2002[/C][C]0.420858[/C][/ROW]
[ROW][C]42[/C][C]-0.004024[/C][C]-0.0392[/C][C]0.4844[/C][/ROW]
[ROW][C]43[/C][C]0.000944[/C][C]0.0092[/C][C]0.496341[/C][/ROW]
[ROW][C]44[/C][C]-0.024101[/C][C]-0.2349[/C][C]0.407393[/C][/ROW]
[ROW][C]45[/C][C]-0.003688[/C][C]-0.0359[/C][C]0.485702[/C][/ROW]
[ROW][C]46[/C][C]-0.007736[/C][C]-0.0754[/C][C]0.470026[/C][/ROW]
[ROW][C]47[/C][C]0.093611[/C][C]0.9124[/C][C]0.181931[/C][/ROW]
[ROW][C]48[/C][C]0.05274[/C][C]0.514[/C][C]0.304207[/C][/ROW]
[/TABLE]
Source: https://freestatistics.org/blog/index.php?pk=277776&T=1

Globally Unique Identifier (entire table): ba.freestatistics.org/blog/index.php?pk=277776&T=1

As an alternative you can also use a QR Code:  

The GUIDs for individual cells are displayed in the table below:

Autocorrelation Function
Time lag kACF(k)T-STATP-value
10.1608771.5680.060099
2-0.001846-0.0180.49284
3-0.112878-1.10020.137013
4-0.098371-0.95880.170047
5-0.069206-0.67450.250803
6-0.046073-0.44910.327204
7-0.065311-0.63660.262966
8-0.106601-1.0390.150717
9-0.115124-1.12210.132326
10-0.01624-0.15830.437282
110.1571491.53170.06446
120.1154961.12570.131561
130.0386260.37650.353698
14-0.01222-0.11910.45272
15-0.096241-0.9380.175302
16-0.099369-0.96850.167619
17-0.065328-0.63670.262914
18-0.026487-0.25820.398419
19-0.00207-0.02020.491973
20-0.050189-0.48920.31292
21-0.038731-0.37750.353321
220.0109890.10710.457466
230.1161731.13230.130177
240.0953140.9290.177619
250.0411240.40080.344724
260.0003310.00320.498715
27-0.082252-0.80170.212365
28-0.047431-0.46230.322461
29-0.071432-0.69620.243992
30-0.006649-0.06480.47423
310.0077320.07540.470043
32-0.005834-0.05690.477388
330.0227630.22190.412448
340.0342640.3340.36957
350.09730.94840.172674
360.0738750.720.236632
370.0239540.23350.407947
38-0.035699-0.3480.364322
39-0.094674-0.92280.179233
40-0.044625-0.4350.332291
41-0.020545-0.20020.420858
42-0.004024-0.03920.4844
430.0009440.00920.496341
44-0.024101-0.23490.407393
45-0.003688-0.03590.485702
46-0.007736-0.07540.470026
470.0936110.91240.181931
480.052740.5140.304207


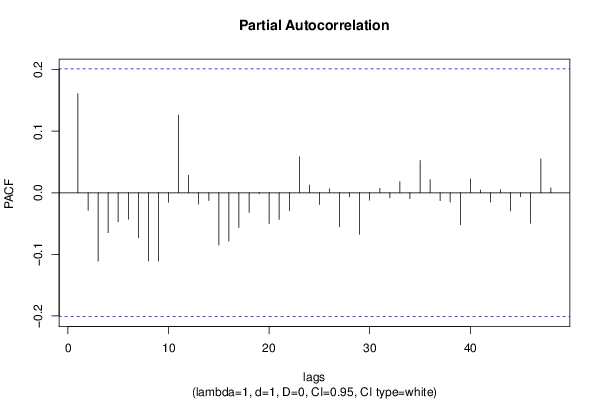
Partial Autocorrelation Function
Time lag kPACF(k)T-STATP-value
10.1608771.5680.060099
2-0.028464-0.27740.391024
3-0.110952-1.08140.141122
4-0.064722-0.63080.264834
5-0.046939-0.45750.324178
6-0.042944-0.41860.338239
7-0.073125-0.71270.238878
8-0.110746-1.07940.141568
9-0.1107-1.0790.141666
10-0.015438-0.15050.440356
110.1262481.23050.110771
120.0286140.27890.390464
13-0.018228-0.17770.429683
14-0.012414-0.1210.451973
15-0.084771-0.82620.205366
16-0.078382-0.7640.223388
17-0.056263-0.54840.292358
18-0.031924-0.31120.37818
19-0.001636-0.01590.493656
20-0.04986-0.4860.314052
21-0.043142-0.42050.337538
22-0.029035-0.2830.388896
230.0586030.57120.28461
240.0125160.1220.451584
25-0.019129-0.18640.426247
260.0065220.06360.474725
27-0.055004-0.53610.296567
28-0.006484-0.06320.474869
29-0.067343-0.65640.256584
30-0.011908-0.11610.453925
310.0071590.06980.472258
32-0.008051-0.07850.468811
330.0181430.17680.430008
34-0.009448-0.09210.463413
350.0524020.51080.305354
360.0213080.20770.417961
37-0.012728-0.12410.450766
38-0.014819-0.14440.442729
39-0.051919-0.5060.306999
400.0225130.21940.413393
410.0045440.04430.482382
42-0.014827-0.14450.442699
430.0049150.04790.480945
44-0.029501-0.28750.387164
45-0.006325-0.06160.475486
46-0.049567-0.48310.315063
470.0549670.53580.29669
480.0077390.07540.470014

\begin{tabular}{lllllllll}
\hline
Partial Autocorrelation Function \tabularnewline
Time lag k & PACF(k) & T-STAT & P-value \tabularnewline
1 & 0.160877 & 1.568 & 0.060099 \tabularnewline
2 & -0.028464 & -0.2774 & 0.391024 \tabularnewline
3 & -0.110952 & -1.0814 & 0.141122 \tabularnewline
4 & -0.064722 & -0.6308 & 0.264834 \tabularnewline
5 & -0.046939 & -0.4575 & 0.324178 \tabularnewline
6 & -0.042944 & -0.4186 & 0.338239 \tabularnewline
7 & -0.073125 & -0.7127 & 0.238878 \tabularnewline
8 & -0.110746 & -1.0794 & 0.141568 \tabularnewline
9 & -0.1107 & -1.079 & 0.141666 \tabularnewline
10 & -0.015438 & -0.1505 & 0.440356 \tabularnewline
11 & 0.126248 & 1.2305 & 0.110771 \tabularnewline
12 & 0.028614 & 0.2789 & 0.390464 \tabularnewline
13 & -0.018228 & -0.1777 & 0.429683 \tabularnewline
14 & -0.012414 & -0.121 & 0.451973 \tabularnewline
15 & -0.084771 & -0.8262 & 0.205366 \tabularnewline
16 & -0.078382 & -0.764 & 0.223388 \tabularnewline
17 & -0.056263 & -0.5484 & 0.292358 \tabularnewline
18 & -0.031924 & -0.3112 & 0.37818 \tabularnewline
19 & -0.001636 & -0.0159 & 0.493656 \tabularnewline
20 & -0.04986 & -0.486 & 0.314052 \tabularnewline
21 & -0.043142 & -0.4205 & 0.337538 \tabularnewline
22 & -0.029035 & -0.283 & 0.388896 \tabularnewline
23 & 0.058603 & 0.5712 & 0.28461 \tabularnewline
24 & 0.012516 & 0.122 & 0.451584 \tabularnewline
25 & -0.019129 & -0.1864 & 0.426247 \tabularnewline
26 & 0.006522 & 0.0636 & 0.474725 \tabularnewline
27 & -0.055004 & -0.5361 & 0.296567 \tabularnewline
28 & -0.006484 & -0.0632 & 0.474869 \tabularnewline
29 & -0.067343 & -0.6564 & 0.256584 \tabularnewline
30 & -0.011908 & -0.1161 & 0.453925 \tabularnewline
31 & 0.007159 & 0.0698 & 0.472258 \tabularnewline
32 & -0.008051 & -0.0785 & 0.468811 \tabularnewline
33 & 0.018143 & 0.1768 & 0.430008 \tabularnewline
34 & -0.009448 & -0.0921 & 0.463413 \tabularnewline
35 & 0.052402 & 0.5108 & 0.305354 \tabularnewline
36 & 0.021308 & 0.2077 & 0.417961 \tabularnewline
37 & -0.012728 & -0.1241 & 0.450766 \tabularnewline
38 & -0.014819 & -0.1444 & 0.442729 \tabularnewline
39 & -0.051919 & -0.506 & 0.306999 \tabularnewline
40 & 0.022513 & 0.2194 & 0.413393 \tabularnewline
41 & 0.004544 & 0.0443 & 0.482382 \tabularnewline
42 & -0.014827 & -0.1445 & 0.442699 \tabularnewline
43 & 0.004915 & 0.0479 & 0.480945 \tabularnewline
44 & -0.029501 & -0.2875 & 0.387164 \tabularnewline
45 & -0.006325 & -0.0616 & 0.475486 \tabularnewline
46 & -0.049567 & -0.4831 & 0.315063 \tabularnewline
47 & 0.054967 & 0.5358 & 0.29669 \tabularnewline
48 & 0.007739 & 0.0754 & 0.470014 \tabularnewline
\hline
\end{tabular}
%Source: https://freestatistics.org/blog/index.php?pk=277776&T=2

[TABLE]
[ROW][C]Partial Autocorrelation Function[/C][/ROW]
[ROW][C]Time lag k[/C][C]PACF(k)[/C][C]T-STAT[/C][C]P-value[/C][/ROW]
[ROW][C]1[/C][C]0.160877[/C][C]1.568[/C][C]0.060099[/C][/ROW]
[ROW][C]2[/C][C]-0.028464[/C][C]-0.2774[/C][C]0.391024[/C][/ROW]
[ROW][C]3[/C][C]-0.110952[/C][C]-1.0814[/C][C]0.141122[/C][/ROW]
[ROW][C]4[/C][C]-0.064722[/C][C]-0.6308[/C][C]0.264834[/C][/ROW]
[ROW][C]5[/C][C]-0.046939[/C][C]-0.4575[/C][C]0.324178[/C][/ROW]
[ROW][C]6[/C][C]-0.042944[/C][C]-0.4186[/C][C]0.338239[/C][/ROW]
[ROW][C]7[/C][C]-0.073125[/C][C]-0.7127[/C][C]0.238878[/C][/ROW]
[ROW][C]8[/C][C]-0.110746[/C][C]-1.0794[/C][C]0.141568[/C][/ROW]
[ROW][C]9[/C][C]-0.1107[/C][C]-1.079[/C][C]0.141666[/C][/ROW]
[ROW][C]10[/C][C]-0.015438[/C][C]-0.1505[/C][C]0.440356[/C][/ROW]
[ROW][C]11[/C][C]0.126248[/C][C]1.2305[/C][C]0.110771[/C][/ROW]
[ROW][C]12[/C][C]0.028614[/C][C]0.2789[/C][C]0.390464[/C][/ROW]
[ROW][C]13[/C][C]-0.018228[/C][C]-0.1777[/C][C]0.429683[/C][/ROW]
[ROW][C]14[/C][C]-0.012414[/C][C]-0.121[/C][C]0.451973[/C][/ROW]
[ROW][C]15[/C][C]-0.084771[/C][C]-0.8262[/C][C]0.205366[/C][/ROW]
[ROW][C]16[/C][C]-0.078382[/C][C]-0.764[/C][C]0.223388[/C][/ROW]
[ROW][C]17[/C][C]-0.056263[/C][C]-0.5484[/C][C]0.292358[/C][/ROW]
[ROW][C]18[/C][C]-0.031924[/C][C]-0.3112[/C][C]0.37818[/C][/ROW]
[ROW][C]19[/C][C]-0.001636[/C][C]-0.0159[/C][C]0.493656[/C][/ROW]
[ROW][C]20[/C][C]-0.04986[/C][C]-0.486[/C][C]0.314052[/C][/ROW]
[ROW][C]21[/C][C]-0.043142[/C][C]-0.4205[/C][C]0.337538[/C][/ROW]
[ROW][C]22[/C][C]-0.029035[/C][C]-0.283[/C][C]0.388896[/C][/ROW]
[ROW][C]23[/C][C]0.058603[/C][C]0.5712[/C][C]0.28461[/C][/ROW]
[ROW][C]24[/C][C]0.012516[/C][C]0.122[/C][C]0.451584[/C][/ROW]
[ROW][C]25[/C][C]-0.019129[/C][C]-0.1864[/C][C]0.426247[/C][/ROW]
[ROW][C]26[/C][C]0.006522[/C][C]0.0636[/C][C]0.474725[/C][/ROW]
[ROW][C]27[/C][C]-0.055004[/C][C]-0.5361[/C][C]0.296567[/C][/ROW]
[ROW][C]28[/C][C]-0.006484[/C][C]-0.0632[/C][C]0.474869[/C][/ROW]
[ROW][C]29[/C][C]-0.067343[/C][C]-0.6564[/C][C]0.256584[/C][/ROW]
[ROW][C]30[/C][C]-0.011908[/C][C]-0.1161[/C][C]0.453925[/C][/ROW]
[ROW][C]31[/C][C]0.007159[/C][C]0.0698[/C][C]0.472258[/C][/ROW]
[ROW][C]32[/C][C]-0.008051[/C][C]-0.0785[/C][C]0.468811[/C][/ROW]
[ROW][C]33[/C][C]0.018143[/C][C]0.1768[/C][C]0.430008[/C][/ROW]
[ROW][C]34[/C][C]-0.009448[/C][C]-0.0921[/C][C]0.463413[/C][/ROW]
[ROW][C]35[/C][C]0.052402[/C][C]0.5108[/C][C]0.305354[/C][/ROW]
[ROW][C]36[/C][C]0.021308[/C][C]0.2077[/C][C]0.417961[/C][/ROW]
[ROW][C]37[/C][C]-0.012728[/C][C]-0.1241[/C][C]0.450766[/C][/ROW]
[ROW][C]38[/C][C]-0.014819[/C][C]-0.1444[/C][C]0.442729[/C][/ROW]
[ROW][C]39[/C][C]-0.051919[/C][C]-0.506[/C][C]0.306999[/C][/ROW]
[ROW][C]40[/C][C]0.022513[/C][C]0.2194[/C][C]0.413393[/C][/ROW]
[ROW][C]41[/C][C]0.004544[/C][C]0.0443[/C][C]0.482382[/C][/ROW]
[ROW][C]42[/C][C]-0.014827[/C][C]-0.1445[/C][C]0.442699[/C][/ROW]
[ROW][C]43[/C][C]0.004915[/C][C]0.0479[/C][C]0.480945[/C][/ROW]
[ROW][C]44[/C][C]-0.029501[/C][C]-0.2875[/C][C]0.387164[/C][/ROW]
[ROW][C]45[/C][C]-0.006325[/C][C]-0.0616[/C][C]0.475486[/C][/ROW]
[ROW][C]46[/C][C]-0.049567[/C][C]-0.4831[/C][C]0.315063[/C][/ROW]
[ROW][C]47[/C][C]0.054967[/C][C]0.5358[/C][C]0.29669[/C][/ROW]
[ROW][C]48[/C][C]0.007739[/C][C]0.0754[/C][C]0.470014[/C][/ROW]
[/TABLE]
Source: https://freestatistics.org/blog/index.php?pk=277776&T=2

Globally Unique Identifier (entire table): ba.freestatistics.org/blog/index.php?pk=277776&T=2

As an alternative you can also use a QR Code:  

The GUIDs for individual cells are displayed in the table below:

Partial Autocorrelation Function
Time lag kPACF(k)T-STATP-value
10.1608771.5680.060099
2-0.028464-0.27740.391024
3-0.110952-1.08140.141122
4-0.064722-0.63080.264834
5-0.046939-0.45750.324178
6-0.042944-0.41860.338239
7-0.073125-0.71270.238878
8-0.110746-1.07940.141568
9-0.1107-1.0790.141666
10-0.015438-0.15050.440356
110.1262481.23050.110771
120.0286140.27890.390464
13-0.018228-0.17770.429683
14-0.012414-0.1210.451973
15-0.084771-0.82620.205366
16-0.078382-0.7640.223388
17-0.056263-0.54840.292358
18-0.031924-0.31120.37818
19-0.001636-0.01590.493656
20-0.04986-0.4860.314052
21-0.043142-0.42050.337538
22-0.029035-0.2830.388896
230.0586030.57120.28461
240.0125160.1220.451584
25-0.019129-0.18640.426247
260.0065220.06360.474725
27-0.055004-0.53610.296567
28-0.006484-0.06320.474869
29-0.067343-0.65640.256584
30-0.011908-0.11610.453925
310.0071590.06980.472258
32-0.008051-0.07850.468811
330.0181430.17680.430008
34-0.009448-0.09210.463413
350.0524020.51080.305354
360.0213080.20770.417961
37-0.012728-0.12410.450766
38-0.014819-0.14440.442729
39-0.051919-0.5060.306999
400.0225130.21940.413393
410.0045440.04430.482382
42-0.014827-0.14450.442699
430.0049150.04790.480945
44-0.029501-0.28750.387164
45-0.006325-0.06160.475486
46-0.049567-0.48310.315063
470.0549670.53580.29669
480.0077390.07540.470014


Parameters (Session):
par1 = 48 ; par2 = 1 ; par3 = 1 ; par4 = 0 ; par5 = 12 ; par6 = White Noise ; par7 = 0.95 ;
Parameters (R input):
par1 = 48 ; par2 = 1 ; par3 = 1 ; par4 = 0 ; par5 = 12 ; par6 = White Noise ; par7 = 0.95 ; par8 = ;
R code (references can be found in the software module):
par8 <- ''
par7 <- '0.95'
par6 <- 'White Noise'
par5 <- '12'
par4 <- '0'
par3 <- '0'
par2 <- '1'
par1 <- '48'
if (par1 == 'Default') {
par1 = 10*log10(length(x))
} else {
par1 <- as.numeric(par1)
}
par2 <- as.numeric(par2)
par3 <- as.numeric(par3)
par4 <- as.numeric(par4)
par5 <- as.numeric(par5)
if (par6 == 'White Noise') par6 <- 'white' else par6 <- 'ma'
par7 <- as.numeric(par7)
if (par8 != '') par8 <- as.numeric(par8)
ox <- x
if (par8 == '') {
if (par2 == 0) {
x <- log(x)
} else {
x <- (x ^ par2 - 1) / par2
}
} else {
x <- log(x,base=par8)
}
if (par3 > 0) x <- diff(x,lag=1,difference=par3)
if (par4 > 0) x <- diff(x,lag=par5,difference=par4)
bitmap(file='picts.png')
op <- par(mfrow=c(2,1))
plot(ox,type='l',main='Original Time Series',xlab='time',ylab='value')
if (par8=='') {
mytitle <- paste('Working Time Series (lambda=',par2,', d=',par3,', D=',par4,')',sep='')
mysub <- paste('(lambda=',par2,', d=',par3,', D=',par4,', CI=', par7, ', CI type=',par6,')',sep='')
} else {
mytitle <- paste('Working Time Series (base=',par8,', d=',par3,', D=',par4,')',sep='')
mysub <- paste('(base=',par8,', d=',par3,', D=',par4,', CI=', par7, ', CI type=',par6,')',sep='')
}
plot(x,type='l', main=mytitle,xlab='time',ylab='value')
par(op)
dev.off()
bitmap(file='pic1.png')
racf <- acf(x, par1, main='Autocorrelation', xlab='time lag', ylab='ACF', ci.type=par6, ci=par7, sub=mysub)
dev.off()
bitmap(file='pic2.png')
rpacf <- pacf(x,par1,main='Partial Autocorrelation',xlab='lags',ylab='PACF',sub=mysub)
dev.off()
(myacf <- c(racf$acf))
(mypacf <- c(rpacf$acf))
lengthx <- length(x)
sqrtn <- sqrt(lengthx)
load(file='createtable')
a<-table.start()
a<-table.row.start(a)
a<-table.element(a,'Autocorrelation Function',4,TRUE)
a<-table.row.end(a)
a<-table.row.start(a)
a<-table.element(a,'Time lag k',header=TRUE)
a<-table.element(a,hyperlink('basics.htm','ACF(k)','click here for more information about the Autocorrelation Function'),header=TRUE)
a<-table.element(a,'T-STAT',header=TRUE)
a<-table.element(a,'P-value',header=TRUE)
a<-table.row.end(a)
for (i in 2:(par1+1)) {
a<-table.row.start(a)
a<-table.element(a,i-1,header=TRUE)
a<-table.element(a,round(myacf[i],6))
mytstat <- myacf[i]*sqrtn
a<-table.element(a,round(mytstat,4))
a<-table.element(a,round(1-pt(abs(mytstat),lengthx),6))
a<-table.row.end(a)
}
a<-table.end(a)
table.save(a,file='mytable.tab')
a<-table.start()
a<-table.row.start(a)
a<-table.element(a,'Partial Autocorrelation Function',4,TRUE)
a<-table.row.end(a)
a<-table.row.start(a)
a<-table.element(a,'Time lag k',header=TRUE)
a<-table.element(a,hyperlink('basics.htm','PACF(k)','click here for more information about the Partial Autocorrelation Function'),header=TRUE)
a<-table.element(a,'T-STAT',header=TRUE)
a<-table.element(a,'P-value',header=TRUE)
a<-table.row.end(a)
for (i in 1:par1) {
a<-table.row.start(a)
a<-table.element(a,i,header=TRUE)
a<-table.element(a,round(mypacf[i],6))
mytstat <- mypacf[i]*sqrtn
a<-table.element(a,round(mytstat,4))
a<-table.element(a,round(1-pt(abs(mytstat),lengthx),6))
a<-table.row.end(a)
}
a<-table.end(a)
table.save(a,file='mytable1.tab')