Free Statistics
of Irreproducible Research!
Description of Statistical Computation | |||||||||||||||||||||||||||||||||||||||||
|---|---|---|---|---|---|---|---|---|---|---|---|---|---|---|---|---|---|---|---|---|---|---|---|---|---|---|---|---|---|---|---|---|---|---|---|---|---|---|---|---|---|
| Author's title | |||||||||||||||||||||||||||||||||||||||||
| Author | *Unverified author* | ||||||||||||||||||||||||||||||||||||||||
| R Software Module | rwasp_univariatedataseries.wasp | ||||||||||||||||||||||||||||||||||||||||
| Title produced by software | Univariate Data Series | ||||||||||||||||||||||||||||||||||||||||
| Date of computation | Wed, 22 Jul 2015 08:43:14 +0100 | ||||||||||||||||||||||||||||||||||||||||
| Cite this page as follows | Statistical Computations at FreeStatistics.org, Office for Research Development and Education, URL https://freestatistics.org/blog/index.php?v=date/2015/Jul/22/t1437551134vv0gfqixqwqzmn4.htm/, Retrieved Fri, 17 May 2024 03:22:11 +0000 | ||||||||||||||||||||||||||||||||||||||||
| Statistical Computations at FreeStatistics.org, Office for Research Development and Education, URL https://freestatistics.org/blog/index.php?pk=279629, Retrieved Fri, 17 May 2024 03:22:11 +0000 | |||||||||||||||||||||||||||||||||||||||||
| QR Codes: | |||||||||||||||||||||||||||||||||||||||||
|
| |||||||||||||||||||||||||||||||||||||||||
| Original text written by user: | |||||||||||||||||||||||||||||||||||||||||
| IsPrivate? | No (this computation is public) | ||||||||||||||||||||||||||||||||||||||||
| User-defined keywords | |||||||||||||||||||||||||||||||||||||||||
| Estimated Impact | 149 | ||||||||||||||||||||||||||||||||||||||||
Tree of Dependent Computations | |||||||||||||||||||||||||||||||||||||||||
| Family? (F = Feedback message, R = changed R code, M = changed R Module, P = changed Parameters, D = changed Data) | |||||||||||||||||||||||||||||||||||||||||
| - [Univariate Data Series] [Omzet product ban...] [2015-07-22 07:43:14] [318ebe2e7bf55ee158992108d321fa26] [Current] | |||||||||||||||||||||||||||||||||||||||||
| Feedback Forum | |||||||||||||||||||||||||||||||||||||||||
Post a new message | |||||||||||||||||||||||||||||||||||||||||
Dataset | |||||||||||||||||||||||||||||||||||||||||
| Dataseries X: | |||||||||||||||||||||||||||||||||||||||||
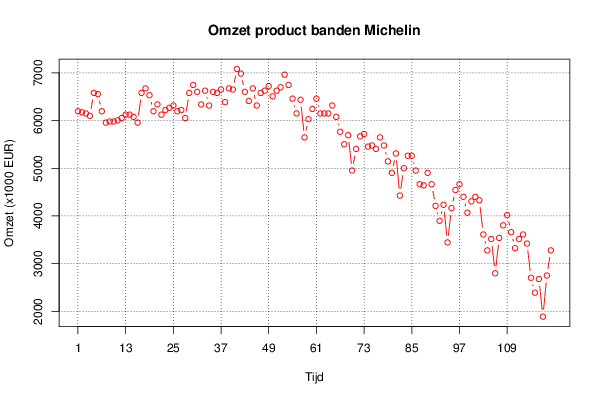
6195.800 6172.725 6149.325 6100.900 6579.950 6554.600 6195.800 5957.250 5980.325 5980.325 6006.000 6052.150 6123.975 6123.975 6077.825 5957.250 6579.950 6674.850 6531.525 6195.800 6339.450 6123.975 6221.150 6267.625 6316.050 6195.800 6221.150 6052.150 6579.950 6746.675 6603.350 6339.450 6626.425 6316.050 6603.350 6579.950 6651.775 6387.875 6674.850 6651.775 7082.400 6985.225 6603.350 6410.950 6674.850 6316.050 6579.950 6626.425 6723.600 6508.450 6626.425 6698.250 6962.150 6746.675 6459.700 6149.325 6436.625 5646.875 6029.075 6244.225 6459.700 6149.325 6149.325 6149.325 6316.050 6077.825 5765.175 5503.550 5693.350 4952.350 5406.375 5670.275 5718.700 5454.800 5477.875 5406.375 5646.875 5477.875 5144.750 4903.925 5311.150 4426.825 5001.100 5262.725 5262.725 4952.350 4665.375 4642.300 4903.925 4665.375 4211.675 3899.025 4234.750 3445.325 4162.925 4544.800 4665.375 4401.475 4068.025 4306.575 4401.475 4329.650 3611.725 3278.600 3516.825 2799.225 3540.225 3804.125 4019.275 3660.475 3324.750 3516.825 3611.725 3421.925 2704.325 2391.675 2678.650 1889.225 2750.475 3278.600 | |||||||||||||||||||||||||||||||||||||||||
Tables (Output of Computation) | |||||||||||||||||||||||||||||||||||||||||
| |||||||||||||||||||||||||||||||||||||||||
Figures (Output of Computation) | |||||||||||||||||||||||||||||||||||||||||
Input Parameters & R Code | |||||||||||||||||||||||||||||||||||||||||
| Parameters (Session): | |||||||||||||||||||||||||||||||||||||||||
| par1 = Omzet product banden Michelin ; par2 = niet gekend ; par3 = Omzet product banden Michelin ; par4 = 12 ; | |||||||||||||||||||||||||||||||||||||||||
| Parameters (R input): | |||||||||||||||||||||||||||||||||||||||||
| par1 = Omzet product banden Michelin ; par2 = niet gekend ; par3 = Omzet product banden Michelin ; par4 = 12 ; | |||||||||||||||||||||||||||||||||||||||||
| R code (references can be found in the software module): | |||||||||||||||||||||||||||||||||||||||||
par4 <- '12' | |||||||||||||||||||||||||||||||||||||||||