Free Statistics
of Irreproducible Research!
Description of Statistical Computation | |||||||||||||||||||||||||||||||||||||||||
|---|---|---|---|---|---|---|---|---|---|---|---|---|---|---|---|---|---|---|---|---|---|---|---|---|---|---|---|---|---|---|---|---|---|---|---|---|---|---|---|---|---|
| Author's title | |||||||||||||||||||||||||||||||||||||||||
| Author | *Unverified author* | ||||||||||||||||||||||||||||||||||||||||
| R Software Module | rwasp_univariatedataseries.wasp | ||||||||||||||||||||||||||||||||||||||||
| Title produced by software | Univariate Data Series | ||||||||||||||||||||||||||||||||||||||||
| Date of computation | Thu, 09 Jul 2015 15:33:36 +0100 | ||||||||||||||||||||||||||||||||||||||||
| Cite this page as follows | Statistical Computations at FreeStatistics.org, Office for Research Development and Education, URL https://freestatistics.org/blog/index.php?v=date/2015/Jul/09/t1436452607adr9ac3v66j7dct.htm/, Retrieved Fri, 17 May 2024 05:34:22 +0000 | ||||||||||||||||||||||||||||||||||||||||
| Statistical Computations at FreeStatistics.org, Office for Research Development and Education, URL https://freestatistics.org/blog/index.php?pk=279537, Retrieved Fri, 17 May 2024 05:34:22 +0000 | |||||||||||||||||||||||||||||||||||||||||
| QR Codes: | |||||||||||||||||||||||||||||||||||||||||
|
| |||||||||||||||||||||||||||||||||||||||||
| Original text written by user: | |||||||||||||||||||||||||||||||||||||||||
| IsPrivate? | No (this computation is public) | ||||||||||||||||||||||||||||||||||||||||
| User-defined keywords | |||||||||||||||||||||||||||||||||||||||||
| Estimated Impact | 180 | ||||||||||||||||||||||||||||||||||||||||
Tree of Dependent Computations | |||||||||||||||||||||||||||||||||||||||||
| Family? (F = Feedback message, R = changed R code, M = changed R Module, P = changed Parameters, D = changed Data) | |||||||||||||||||||||||||||||||||||||||||
| - [Univariate Data Series] [consumptieprijzen...] [2015-02-09 16:46:22] [6b666be92a2717ec998be34b30849c21] - R PD [Univariate Data Series] [REEKS A: stap 1] [2015-07-09 14:33:36] [b81b5adcb18a6dd731e9cb79a54989dd] [Current] | |||||||||||||||||||||||||||||||||||||||||
| Feedback Forum | |||||||||||||||||||||||||||||||||||||||||
Post a new message | |||||||||||||||||||||||||||||||||||||||||
Dataset | |||||||||||||||||||||||||||||||||||||||||
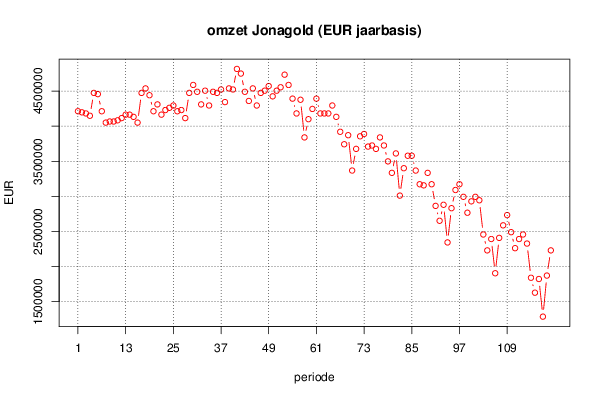
| Dataseries X: | |||||||||||||||||||||||||||||||||||||||||
4213144 4197453 4181541 4148612 4474366 4457128 4213144 4050930 4066621 4066621 4084080 4115462 4164303 4164303 4132921 4050930 4474366 4538898 4441437 4213144 4310826 4164303 4230382 4261985 4294914 4213144 4230382 4115462 4474366 4587739 4490278 4310826 4505969 4294914 4490278 4474366 4523207 4343755 4538898 4523207 4816032 4749953 4490278 4359446 4538898 4294914 4474366 4505969 4572048 4425746 4505969 4554810 4734262 4587739 4392596 4181541 4376905 3839875 4099771 4246073 4392596 4181541 4181541 4181541 4294914 4132921 3920319 3742414 3871478 3367598 3676335 3855787 3888716 3709264 3724955 3676335 3839875 3724955 3498430 3334669 3611582 3010241 3400748 3578653 3578653 3367598 3172455 3156764 3334669 3172455 2863939 2651337 2879630 2342821 2830789 3090464 3172455 2993003 2766257 2928471 2993003 2944162 2455973 2229448 2391441 1903473 2407353 2586805 2733107 2489123 2260830 2391441 2455973 2326909 1838941 1626339 1821482 1284673 1870323 2229448 | |||||||||||||||||||||||||||||||||||||||||
Tables (Output of Computation) | |||||||||||||||||||||||||||||||||||||||||
| |||||||||||||||||||||||||||||||||||||||||
Figures (Output of Computation) | |||||||||||||||||||||||||||||||||||||||||
Input Parameters & R Code | |||||||||||||||||||||||||||||||||||||||||
| Parameters (Session): | |||||||||||||||||||||||||||||||||||||||||
| par1 = reeks A - plot and describe database ; par2 = niet gekend ; par3 = omzet product Jonagold (EUR jaarbasis) ; par4 = 12 ; | |||||||||||||||||||||||||||||||||||||||||
| Parameters (R input): | |||||||||||||||||||||||||||||||||||||||||
| par1 = reeks A - plot and describe database ; par2 = niet gekend ; par3 = omzet product Jonagold (EUR jaarbasis) ; par4 = 12 ; | |||||||||||||||||||||||||||||||||||||||||
| R code (references can be found in the software module): | |||||||||||||||||||||||||||||||||||||||||
par4 <- '12' | |||||||||||||||||||||||||||||||||||||||||