Free Statistics

of Irreproducible Research!

Author's title

Author*Unverified author*
R Software Modulerwasp_centraltendency.wasp
Title produced by softwareCentral Tendency
Date of computationThu, 26 Feb 2015 14:07:41 +0000
Cite this page as followsStatistical Computations at FreeStatistics.org, Office for Research Development and Education, URL https://freestatistics.org/blog/index.php?v=date/2015/Feb/26/t142495970269cyrhugsbc5zly.htm/, Retrieved Sat, 18 May 2024 05:03:11 +0000
Statistical Computations at FreeStatistics.org, Office for Research Development and Education, URL https://freestatistics.org/blog/index.php?pk=277590, Retrieved Sat, 18 May 2024 05:03:11 +0000
QR Codes:

Original text written by user:
IsPrivate?No (this computation is public)
User-defined keywords
Estimated Impact80
Family? (F = Feedback message, R = changed R code, M = changed R Module, P = changed Parameters, D = changed Data)
-       [Central Tendency] [Aantal nieuwe res...] [2015-02-26 14:07:41] [4436f154edbd6dc391df500b76aea682] [Current]
Feedback Forum

Post a new message
Dataseries X:
65
96
66
55
36
63
49
59
89
33
65
62
63
69
84
46
54
83
34
87
55
47
77
38
73
64
75
81
133
107
43
50
27
34
52
29
48
37
64
48
38
39
52
66
67
58
40
31
101
82
72
46
45
62
64
29
57
71
46
71
56
75
78
76
53
43
52
93
52
67
58
52


Summary of computational transaction
Raw Inputview raw input (R code)
Raw Outputview raw output of R engine
Computing time2 seconds
R Server'Gertrude Mary Cox' @ cox.wessa.net

\begin{tabular}{lllllllll}
\hline
Summary of computational transaction \tabularnewline
Raw Input & view raw input (R code)  \tabularnewline
Raw Output & view raw output of R engine  \tabularnewline
Computing time & 2 seconds \tabularnewline
R Server & 'Gertrude Mary Cox' @ cox.wessa.net \tabularnewline
\hline
\end{tabular}
%Source: https://freestatistics.org/blog/index.php?pk=277590&T=0

[TABLE]
[ROW][C]Summary of computational transaction[/C][/ROW]
[ROW][C]Raw Input[/C][C]view raw input (R code) [/C][/ROW]
[ROW][C]Raw Output[/C][C]view raw output of R engine [/C][/ROW]
[ROW][C]Computing time[/C][C]2 seconds[/C][/ROW]
[ROW][C]R Server[/C][C]'Gertrude Mary Cox' @ cox.wessa.net[/C][/ROW]
[/TABLE]
Source: https://freestatistics.org/blog/index.php?pk=277590&T=0

Globally Unique Identifier (entire table): ba.freestatistics.org/blog/index.php?pk=277590&T=0

As an alternative you can also use a QR Code:  

The GUIDs for individual cells are displayed in the table below:

Summary of computational transaction
Raw Inputview raw input (R code)
Raw Outputview raw output of R engine
Computing time2 seconds
R Server'Gertrude Mary Cox' @ cox.wessa.net


Central Tendency - Ungrouped Data
MeasureValueS.E.Value/S.E.
Arithmetic Mean60.16666666666672.3758698267139625.3240585785302
Geometric Mean56.9782011501019
Harmonic Mean53.8782430496224
Quadratic Mean63.4098222324866
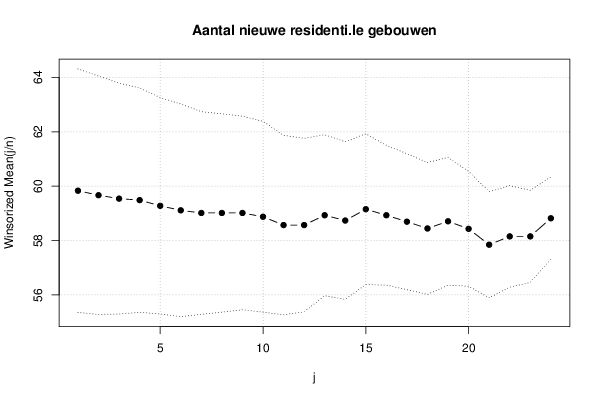
Winsorized Mean ( 1 / 24 )59.83333333333332.2381665870442926.7331903173252
Winsorized Mean ( 2 / 24 )59.66666666666672.1912652035954627.229322388164
Winsorized Mean ( 3 / 24 )59.54166666666672.1222365350728828.0560935044981
Winsorized Mean ( 4 / 24 )59.48611111111112.062405976000328.8430657219461
Winsorized Mean ( 5 / 24 )59.27777777777781.9888403662522429.8051964268406
Winsorized Mean ( 6 / 24 )59.11111111111111.9545456383539130.2428912127597
Winsorized Mean ( 7 / 24 )59.01388888888891.8631267843430831.6746500478745
Winsorized Mean ( 8 / 24 )59.01388888888891.8232214794715432.3679210416027
Winsorized Mean ( 9 / 24 )59.01388888888891.7792374374942333.1680795633439
Winsorized Mean ( 10 / 24 )58.8751.7542634740720233.5610932281105
Winsorized Mean ( 11 / 24 )58.56944444444441.6498952388719435.4988868775021
Winsorized Mean ( 12 / 24 )58.56944444444441.5949139611225936.7226357484637
Winsorized Mean ( 13 / 24 )58.93055555555561.4799555872572239.8191378599209
Winsorized Mean ( 14 / 24 )58.73611111111111.4487857221424140.5416137206642
Winsorized Mean ( 15 / 24 )59.15277777777781.386930348347342.6501430646938
Winsorized Mean ( 16 / 24 )58.93055555555561.2851210627359945.8560343179607
Winsorized Mean ( 17 / 24 )58.69444444444441.2491998830313846.985630755915
Winsorized Mean ( 18 / 24 )58.44444444444441.2122046433562248.2133481048464
Winsorized Mean ( 19 / 24 )58.70833333333331.174593709931949.9818216604763
Winsorized Mean ( 20 / 24 )58.43055555555561.0555439728381955.3558705834349
Winsorized Mean ( 21 / 24 )57.84722222222220.97577458542328859.2833868460801
Winsorized Mean ( 22 / 24 )58.15277777777780.93293496742890662.333152693421
Winsorized Mean ( 23 / 24 )58.15277777777780.84699129719285368.6580582002567
Winsorized Mean ( 24 / 24 )58.81944444444440.75948009276239977.4469864384529
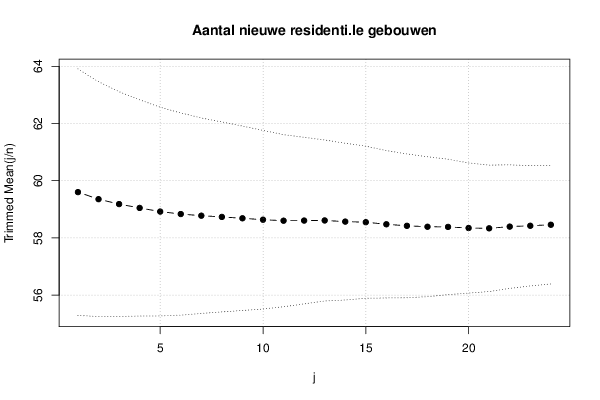
Trimmed Mean ( 1 / 24 )59.62.1549115741346727.6577474061474
Trimmed Mean ( 2 / 24 )59.35294117647062.0550762335428528.8811384257746
Trimmed Mean ( 3 / 24 )59.18181818181821.9661362831385130.1005676408898
Trimmed Mean ( 4 / 24 )59.0468751.8919773302040331.2090816614766
Trimmed Mean ( 5 / 24 )58.91935483870971.825302273830232.2792316009522
Trimmed Mean ( 6 / 24 )58.83333333333331.7687121726072933.2633733427673
Trimmed Mean ( 7 / 24 )58.77586206896551.7097356725066234.3771630984309
Trimmed Mean ( 8 / 24 )58.73214285714291.6621241048395535.3355941870612
Trimmed Mean ( 9 / 24 )58.68518518518521.6131500307519236.3792480962423
Trimmed Mean ( 10 / 24 )58.63461538461541.5626747494808537.5219574029048
Trimmed Mean ( 11 / 24 )58.61.5050933932646838.9344609857675
Trimmed Mean ( 12 / 24 )58.60416666666671.457050474251140.2210957700611
Trimmed Mean ( 13 / 24 )58.60869565217391.4082154605914741.6191252633722
Trimmed Mean ( 14 / 24 )58.56818181818181.3714846384105542.7042200677202
Trimmed Mean ( 15 / 24 )58.54761904761911.3300783647555144.0181726122439
Trimmed Mean ( 16 / 24 )58.4751.2890005569810445.3646041371416
Trimmed Mean ( 17 / 24 )58.42105263157891.2580503662274346.4377692657638
Trimmed Mean ( 18 / 24 )58.38888888888891.2236283397882647.7178298264917
Trimmed Mean ( 19 / 24 )58.38235294117651.1844316204850849.2914507949951
Trimmed Mean ( 20 / 24 )58.343751.1382369776714851.2579991201438
Trimmed Mean ( 21 / 24 )58.33333333333331.1062345091670352.7314351974581
Trimmed Mean ( 22 / 24 )58.39285714285711.080538869232154.0404966499305
Trimmed Mean ( 23 / 24 )58.42307692307691.0527225902729655.4971247533774
Trimmed Mean ( 24 / 24 )58.45833333333331.0355618209571856.4508387140998
Median58
Midrange80
Midmean - Weighted Average at Xnp57.7368421052632
Midmean - Weighted Average at X(n+1)p57.7368421052632
Midmean - Empirical Distribution Function57.7368421052632
Midmean - Empirical Distribution Function - Averaging57.7368421052632
Midmean - Empirical Distribution Function - Interpolation57.7368421052632
Midmean - Closest Observation57.7368421052632
Midmean - True Basic - Statistics Graphics Toolkit57.7368421052632
Midmean - MS Excel (old versions)58.1025641025641
Number of observations72

\begin{tabular}{lllllllll}
\hline
Central Tendency - Ungrouped Data \tabularnewline
Measure & Value & S.E. & Value/S.E. \tabularnewline
Arithmetic Mean & 60.1666666666667 & 2.37586982671396 & 25.3240585785302 \tabularnewline
Geometric Mean & 56.9782011501019 &  &  \tabularnewline
Harmonic Mean & 53.8782430496224 &  &  \tabularnewline
Quadratic Mean & 63.4098222324866 &  &  \tabularnewline
Winsorized Mean ( 1 / 24 ) & 59.8333333333333 & 2.23816658704429 & 26.7331903173252 \tabularnewline
Winsorized Mean ( 2 / 24 ) & 59.6666666666667 & 2.19126520359546 & 27.229322388164 \tabularnewline
Winsorized Mean ( 3 / 24 ) & 59.5416666666667 & 2.12223653507288 & 28.0560935044981 \tabularnewline
Winsorized Mean ( 4 / 24 ) & 59.4861111111111 & 2.0624059760003 & 28.8430657219461 \tabularnewline
Winsorized Mean ( 5 / 24 ) & 59.2777777777778 & 1.98884036625224 & 29.8051964268406 \tabularnewline
Winsorized Mean ( 6 / 24 ) & 59.1111111111111 & 1.95454563835391 & 30.2428912127597 \tabularnewline
Winsorized Mean ( 7 / 24 ) & 59.0138888888889 & 1.86312678434308 & 31.6746500478745 \tabularnewline
Winsorized Mean ( 8 / 24 ) & 59.0138888888889 & 1.82322147947154 & 32.3679210416027 \tabularnewline
Winsorized Mean ( 9 / 24 ) & 59.0138888888889 & 1.77923743749423 & 33.1680795633439 \tabularnewline
Winsorized Mean ( 10 / 24 ) & 58.875 & 1.75426347407202 & 33.5610932281105 \tabularnewline
Winsorized Mean ( 11 / 24 ) & 58.5694444444444 & 1.64989523887194 & 35.4988868775021 \tabularnewline
Winsorized Mean ( 12 / 24 ) & 58.5694444444444 & 1.59491396112259 & 36.7226357484637 \tabularnewline
Winsorized Mean ( 13 / 24 ) & 58.9305555555556 & 1.47995558725722 & 39.8191378599209 \tabularnewline
Winsorized Mean ( 14 / 24 ) & 58.7361111111111 & 1.44878572214241 & 40.5416137206642 \tabularnewline
Winsorized Mean ( 15 / 24 ) & 59.1527777777778 & 1.3869303483473 & 42.6501430646938 \tabularnewline
Winsorized Mean ( 16 / 24 ) & 58.9305555555556 & 1.28512106273599 & 45.8560343179607 \tabularnewline
Winsorized Mean ( 17 / 24 ) & 58.6944444444444 & 1.24919988303138 & 46.985630755915 \tabularnewline
Winsorized Mean ( 18 / 24 ) & 58.4444444444444 & 1.21220464335622 & 48.2133481048464 \tabularnewline
Winsorized Mean ( 19 / 24 ) & 58.7083333333333 & 1.1745937099319 & 49.9818216604763 \tabularnewline
Winsorized Mean ( 20 / 24 ) & 58.4305555555556 & 1.05554397283819 & 55.3558705834349 \tabularnewline
Winsorized Mean ( 21 / 24 ) & 57.8472222222222 & 0.975774585423288 & 59.2833868460801 \tabularnewline
Winsorized Mean ( 22 / 24 ) & 58.1527777777778 & 0.932934967428906 & 62.333152693421 \tabularnewline
Winsorized Mean ( 23 / 24 ) & 58.1527777777778 & 0.846991297192853 & 68.6580582002567 \tabularnewline
Winsorized Mean ( 24 / 24 ) & 58.8194444444444 & 0.759480092762399 & 77.4469864384529 \tabularnewline
Trimmed Mean ( 1 / 24 ) & 59.6 & 2.15491157413467 & 27.6577474061474 \tabularnewline
Trimmed Mean ( 2 / 24 ) & 59.3529411764706 & 2.05507623354285 & 28.8811384257746 \tabularnewline
Trimmed Mean ( 3 / 24 ) & 59.1818181818182 & 1.96613628313851 & 30.1005676408898 \tabularnewline
Trimmed Mean ( 4 / 24 ) & 59.046875 & 1.89197733020403 & 31.2090816614766 \tabularnewline
Trimmed Mean ( 5 / 24 ) & 58.9193548387097 & 1.8253022738302 & 32.2792316009522 \tabularnewline
Trimmed Mean ( 6 / 24 ) & 58.8333333333333 & 1.76871217260729 & 33.2633733427673 \tabularnewline
Trimmed Mean ( 7 / 24 ) & 58.7758620689655 & 1.70973567250662 & 34.3771630984309 \tabularnewline
Trimmed Mean ( 8 / 24 ) & 58.7321428571429 & 1.66212410483955 & 35.3355941870612 \tabularnewline
Trimmed Mean ( 9 / 24 ) & 58.6851851851852 & 1.61315003075192 & 36.3792480962423 \tabularnewline
Trimmed Mean ( 10 / 24 ) & 58.6346153846154 & 1.56267474948085 & 37.5219574029048 \tabularnewline
Trimmed Mean ( 11 / 24 ) & 58.6 & 1.50509339326468 & 38.9344609857675 \tabularnewline
Trimmed Mean ( 12 / 24 ) & 58.6041666666667 & 1.4570504742511 & 40.2210957700611 \tabularnewline
Trimmed Mean ( 13 / 24 ) & 58.6086956521739 & 1.40821546059147 & 41.6191252633722 \tabularnewline
Trimmed Mean ( 14 / 24 ) & 58.5681818181818 & 1.37148463841055 & 42.7042200677202 \tabularnewline
Trimmed Mean ( 15 / 24 ) & 58.5476190476191 & 1.33007836475551 & 44.0181726122439 \tabularnewline
Trimmed Mean ( 16 / 24 ) & 58.475 & 1.28900055698104 & 45.3646041371416 \tabularnewline
Trimmed Mean ( 17 / 24 ) & 58.4210526315789 & 1.25805036622743 & 46.4377692657638 \tabularnewline
Trimmed Mean ( 18 / 24 ) & 58.3888888888889 & 1.22362833978826 & 47.7178298264917 \tabularnewline
Trimmed Mean ( 19 / 24 ) & 58.3823529411765 & 1.18443162048508 & 49.2914507949951 \tabularnewline
Trimmed Mean ( 20 / 24 ) & 58.34375 & 1.13823697767148 & 51.2579991201438 \tabularnewline
Trimmed Mean ( 21 / 24 ) & 58.3333333333333 & 1.10623450916703 & 52.7314351974581 \tabularnewline
Trimmed Mean ( 22 / 24 ) & 58.3928571428571 & 1.0805388692321 & 54.0404966499305 \tabularnewline
Trimmed Mean ( 23 / 24 ) & 58.4230769230769 & 1.05272259027296 & 55.4971247533774 \tabularnewline
Trimmed Mean ( 24 / 24 ) & 58.4583333333333 & 1.03556182095718 & 56.4508387140998 \tabularnewline
Median & 58 &  &  \tabularnewline
Midrange & 80 &  &  \tabularnewline
Midmean - Weighted Average at Xnp & 57.7368421052632 &  &  \tabularnewline
Midmean - Weighted Average at X(n+1)p & 57.7368421052632 &  &  \tabularnewline
Midmean - Empirical Distribution Function & 57.7368421052632 &  &  \tabularnewline
Midmean - Empirical Distribution Function - Averaging & 57.7368421052632 &  &  \tabularnewline
Midmean - Empirical Distribution Function - Interpolation & 57.7368421052632 &  &  \tabularnewline
Midmean - Closest Observation & 57.7368421052632 &  &  \tabularnewline
Midmean - True Basic - Statistics Graphics Toolkit & 57.7368421052632 &  &  \tabularnewline
Midmean - MS Excel (old versions) & 58.1025641025641 &  &  \tabularnewline
Number of observations & 72 &  &  \tabularnewline
\hline
\end{tabular}
%Source: https://freestatistics.org/blog/index.php?pk=277590&T=1

[TABLE]
[ROW][C]Central Tendency - Ungrouped Data[/C][/ROW]
[ROW][C]Measure[/C][C]Value[/C][C]S.E.[/C][C]Value/S.E.[/C][/ROW]
[ROW][C]Arithmetic Mean[/C][C]60.1666666666667[/C][C]2.37586982671396[/C][C]25.3240585785302[/C][/ROW]
[ROW][C]Geometric Mean[/C][C]56.9782011501019[/C][C][/C][C][/C][/ROW]
[ROW][C]Harmonic Mean[/C][C]53.8782430496224[/C][C][/C][C][/C][/ROW]
[ROW][C]Quadratic Mean[/C][C]63.4098222324866[/C][C][/C][C][/C][/ROW]
[ROW][C]Winsorized Mean ( 1 / 24 )[/C][C]59.8333333333333[/C][C]2.23816658704429[/C][C]26.7331903173252[/C][/ROW]
[ROW][C]Winsorized Mean ( 2 / 24 )[/C][C]59.6666666666667[/C][C]2.19126520359546[/C][C]27.229322388164[/C][/ROW]
[ROW][C]Winsorized Mean ( 3 / 24 )[/C][C]59.5416666666667[/C][C]2.12223653507288[/C][C]28.0560935044981[/C][/ROW]
[ROW][C]Winsorized Mean ( 4 / 24 )[/C][C]59.4861111111111[/C][C]2.0624059760003[/C][C]28.8430657219461[/C][/ROW]
[ROW][C]Winsorized Mean ( 5 / 24 )[/C][C]59.2777777777778[/C][C]1.98884036625224[/C][C]29.8051964268406[/C][/ROW]
[ROW][C]Winsorized Mean ( 6 / 24 )[/C][C]59.1111111111111[/C][C]1.95454563835391[/C][C]30.2428912127597[/C][/ROW]
[ROW][C]Winsorized Mean ( 7 / 24 )[/C][C]59.0138888888889[/C][C]1.86312678434308[/C][C]31.6746500478745[/C][/ROW]
[ROW][C]Winsorized Mean ( 8 / 24 )[/C][C]59.0138888888889[/C][C]1.82322147947154[/C][C]32.3679210416027[/C][/ROW]
[ROW][C]Winsorized Mean ( 9 / 24 )[/C][C]59.0138888888889[/C][C]1.77923743749423[/C][C]33.1680795633439[/C][/ROW]
[ROW][C]Winsorized Mean ( 10 / 24 )[/C][C]58.875[/C][C]1.75426347407202[/C][C]33.5610932281105[/C][/ROW]
[ROW][C]Winsorized Mean ( 11 / 24 )[/C][C]58.5694444444444[/C][C]1.64989523887194[/C][C]35.4988868775021[/C][/ROW]
[ROW][C]Winsorized Mean ( 12 / 24 )[/C][C]58.5694444444444[/C][C]1.59491396112259[/C][C]36.7226357484637[/C][/ROW]
[ROW][C]Winsorized Mean ( 13 / 24 )[/C][C]58.9305555555556[/C][C]1.47995558725722[/C][C]39.8191378599209[/C][/ROW]
[ROW][C]Winsorized Mean ( 14 / 24 )[/C][C]58.7361111111111[/C][C]1.44878572214241[/C][C]40.5416137206642[/C][/ROW]
[ROW][C]Winsorized Mean ( 15 / 24 )[/C][C]59.1527777777778[/C][C]1.3869303483473[/C][C]42.6501430646938[/C][/ROW]
[ROW][C]Winsorized Mean ( 16 / 24 )[/C][C]58.9305555555556[/C][C]1.28512106273599[/C][C]45.8560343179607[/C][/ROW]
[ROW][C]Winsorized Mean ( 17 / 24 )[/C][C]58.6944444444444[/C][C]1.24919988303138[/C][C]46.985630755915[/C][/ROW]
[ROW][C]Winsorized Mean ( 18 / 24 )[/C][C]58.4444444444444[/C][C]1.21220464335622[/C][C]48.2133481048464[/C][/ROW]
[ROW][C]Winsorized Mean ( 19 / 24 )[/C][C]58.7083333333333[/C][C]1.1745937099319[/C][C]49.9818216604763[/C][/ROW]
[ROW][C]Winsorized Mean ( 20 / 24 )[/C][C]58.4305555555556[/C][C]1.05554397283819[/C][C]55.3558705834349[/C][/ROW]
[ROW][C]Winsorized Mean ( 21 / 24 )[/C][C]57.8472222222222[/C][C]0.975774585423288[/C][C]59.2833868460801[/C][/ROW]
[ROW][C]Winsorized Mean ( 22 / 24 )[/C][C]58.1527777777778[/C][C]0.932934967428906[/C][C]62.333152693421[/C][/ROW]
[ROW][C]Winsorized Mean ( 23 / 24 )[/C][C]58.1527777777778[/C][C]0.846991297192853[/C][C]68.6580582002567[/C][/ROW]
[ROW][C]Winsorized Mean ( 24 / 24 )[/C][C]58.8194444444444[/C][C]0.759480092762399[/C][C]77.4469864384529[/C][/ROW]
[ROW][C]Trimmed Mean ( 1 / 24 )[/C][C]59.6[/C][C]2.15491157413467[/C][C]27.6577474061474[/C][/ROW]
[ROW][C]Trimmed Mean ( 2 / 24 )[/C][C]59.3529411764706[/C][C]2.05507623354285[/C][C]28.8811384257746[/C][/ROW]
[ROW][C]Trimmed Mean ( 3 / 24 )[/C][C]59.1818181818182[/C][C]1.96613628313851[/C][C]30.1005676408898[/C][/ROW]
[ROW][C]Trimmed Mean ( 4 / 24 )[/C][C]59.046875[/C][C]1.89197733020403[/C][C]31.2090816614766[/C][/ROW]
[ROW][C]Trimmed Mean ( 5 / 24 )[/C][C]58.9193548387097[/C][C]1.8253022738302[/C][C]32.2792316009522[/C][/ROW]
[ROW][C]Trimmed Mean ( 6 / 24 )[/C][C]58.8333333333333[/C][C]1.76871217260729[/C][C]33.2633733427673[/C][/ROW]
[ROW][C]Trimmed Mean ( 7 / 24 )[/C][C]58.7758620689655[/C][C]1.70973567250662[/C][C]34.3771630984309[/C][/ROW]
[ROW][C]Trimmed Mean ( 8 / 24 )[/C][C]58.7321428571429[/C][C]1.66212410483955[/C][C]35.3355941870612[/C][/ROW]
[ROW][C]Trimmed Mean ( 9 / 24 )[/C][C]58.6851851851852[/C][C]1.61315003075192[/C][C]36.3792480962423[/C][/ROW]
[ROW][C]Trimmed Mean ( 10 / 24 )[/C][C]58.6346153846154[/C][C]1.56267474948085[/C][C]37.5219574029048[/C][/ROW]
[ROW][C]Trimmed Mean ( 11 / 24 )[/C][C]58.6[/C][C]1.50509339326468[/C][C]38.9344609857675[/C][/ROW]
[ROW][C]Trimmed Mean ( 12 / 24 )[/C][C]58.6041666666667[/C][C]1.4570504742511[/C][C]40.2210957700611[/C][/ROW]
[ROW][C]Trimmed Mean ( 13 / 24 )[/C][C]58.6086956521739[/C][C]1.40821546059147[/C][C]41.6191252633722[/C][/ROW]
[ROW][C]Trimmed Mean ( 14 / 24 )[/C][C]58.5681818181818[/C][C]1.37148463841055[/C][C]42.7042200677202[/C][/ROW]
[ROW][C]Trimmed Mean ( 15 / 24 )[/C][C]58.5476190476191[/C][C]1.33007836475551[/C][C]44.0181726122439[/C][/ROW]
[ROW][C]Trimmed Mean ( 16 / 24 )[/C][C]58.475[/C][C]1.28900055698104[/C][C]45.3646041371416[/C][/ROW]
[ROW][C]Trimmed Mean ( 17 / 24 )[/C][C]58.4210526315789[/C][C]1.25805036622743[/C][C]46.4377692657638[/C][/ROW]
[ROW][C]Trimmed Mean ( 18 / 24 )[/C][C]58.3888888888889[/C][C]1.22362833978826[/C][C]47.7178298264917[/C][/ROW]
[ROW][C]Trimmed Mean ( 19 / 24 )[/C][C]58.3823529411765[/C][C]1.18443162048508[/C][C]49.2914507949951[/C][/ROW]
[ROW][C]Trimmed Mean ( 20 / 24 )[/C][C]58.34375[/C][C]1.13823697767148[/C][C]51.2579991201438[/C][/ROW]
[ROW][C]Trimmed Mean ( 21 / 24 )[/C][C]58.3333333333333[/C][C]1.10623450916703[/C][C]52.7314351974581[/C][/ROW]
[ROW][C]Trimmed Mean ( 22 / 24 )[/C][C]58.3928571428571[/C][C]1.0805388692321[/C][C]54.0404966499305[/C][/ROW]
[ROW][C]Trimmed Mean ( 23 / 24 )[/C][C]58.4230769230769[/C][C]1.05272259027296[/C][C]55.4971247533774[/C][/ROW]
[ROW][C]Trimmed Mean ( 24 / 24 )[/C][C]58.4583333333333[/C][C]1.03556182095718[/C][C]56.4508387140998[/C][/ROW]
[ROW][C]Median[/C][C]58[/C][C][/C][C][/C][/ROW]
[ROW][C]Midrange[/C][C]80[/C][C][/C][C][/C][/ROW]
[ROW][C]Midmean - Weighted Average at Xnp[/C][C]57.7368421052632[/C][C][/C][C][/C][/ROW]
[ROW][C]Midmean - Weighted Average at X(n+1)p[/C][C]57.7368421052632[/C][C][/C][C][/C][/ROW]
[ROW][C]Midmean - Empirical Distribution Function[/C][C]57.7368421052632[/C][C][/C][C][/C][/ROW]
[ROW][C]Midmean - Empirical Distribution Function - Averaging[/C][C]57.7368421052632[/C][C][/C][C][/C][/ROW]
[ROW][C]Midmean - Empirical Distribution Function - Interpolation[/C][C]57.7368421052632[/C][C][/C][C][/C][/ROW]
[ROW][C]Midmean - Closest Observation[/C][C]57.7368421052632[/C][C][/C][C][/C][/ROW]
[ROW][C]Midmean - True Basic - Statistics Graphics Toolkit[/C][C]57.7368421052632[/C][C][/C][C][/C][/ROW]
[ROW][C]Midmean - MS Excel (old versions)[/C][C]58.1025641025641[/C][C][/C][C][/C][/ROW]
[ROW][C]Number of observations[/C][C]72[/C][C][/C][C][/C][/ROW]
[/TABLE]
Source: https://freestatistics.org/blog/index.php?pk=277590&T=1

Globally Unique Identifier (entire table): ba.freestatistics.org/blog/index.php?pk=277590&T=1

As an alternative you can also use a QR Code:  

The GUIDs for individual cells are displayed in the table below:

Central Tendency - Ungrouped Data
MeasureValueS.E.Value/S.E.
Arithmetic Mean60.16666666666672.3758698267139625.3240585785302
Geometric Mean56.9782011501019
Harmonic Mean53.8782430496224
Quadratic Mean63.4098222324866
Winsorized Mean ( 1 / 24 )59.83333333333332.2381665870442926.7331903173252
Winsorized Mean ( 2 / 24 )59.66666666666672.1912652035954627.229322388164
Winsorized Mean ( 3 / 24 )59.54166666666672.1222365350728828.0560935044981
Winsorized Mean ( 4 / 24 )59.48611111111112.062405976000328.8430657219461
Winsorized Mean ( 5 / 24 )59.27777777777781.9888403662522429.8051964268406
Winsorized Mean ( 6 / 24 )59.11111111111111.9545456383539130.2428912127597
Winsorized Mean ( 7 / 24 )59.01388888888891.8631267843430831.6746500478745
Winsorized Mean ( 8 / 24 )59.01388888888891.8232214794715432.3679210416027
Winsorized Mean ( 9 / 24 )59.01388888888891.7792374374942333.1680795633439
Winsorized Mean ( 10 / 24 )58.8751.7542634740720233.5610932281105
Winsorized Mean ( 11 / 24 )58.56944444444441.6498952388719435.4988868775021
Winsorized Mean ( 12 / 24 )58.56944444444441.5949139611225936.7226357484637
Winsorized Mean ( 13 / 24 )58.93055555555561.4799555872572239.8191378599209
Winsorized Mean ( 14 / 24 )58.73611111111111.4487857221424140.5416137206642
Winsorized Mean ( 15 / 24 )59.15277777777781.386930348347342.6501430646938
Winsorized Mean ( 16 / 24 )58.93055555555561.2851210627359945.8560343179607
Winsorized Mean ( 17 / 24 )58.69444444444441.2491998830313846.985630755915
Winsorized Mean ( 18 / 24 )58.44444444444441.2122046433562248.2133481048464
Winsorized Mean ( 19 / 24 )58.70833333333331.174593709931949.9818216604763
Winsorized Mean ( 20 / 24 )58.43055555555561.0555439728381955.3558705834349
Winsorized Mean ( 21 / 24 )57.84722222222220.97577458542328859.2833868460801
Winsorized Mean ( 22 / 24 )58.15277777777780.93293496742890662.333152693421
Winsorized Mean ( 23 / 24 )58.15277777777780.84699129719285368.6580582002567
Winsorized Mean ( 24 / 24 )58.81944444444440.75948009276239977.4469864384529
Trimmed Mean ( 1 / 24 )59.62.1549115741346727.6577474061474
Trimmed Mean ( 2 / 24 )59.35294117647062.0550762335428528.8811384257746
Trimmed Mean ( 3 / 24 )59.18181818181821.9661362831385130.1005676408898
Trimmed Mean ( 4 / 24 )59.0468751.8919773302040331.2090816614766
Trimmed Mean ( 5 / 24 )58.91935483870971.825302273830232.2792316009522
Trimmed Mean ( 6 / 24 )58.83333333333331.7687121726072933.2633733427673
Trimmed Mean ( 7 / 24 )58.77586206896551.7097356725066234.3771630984309
Trimmed Mean ( 8 / 24 )58.73214285714291.6621241048395535.3355941870612
Trimmed Mean ( 9 / 24 )58.68518518518521.6131500307519236.3792480962423
Trimmed Mean ( 10 / 24 )58.63461538461541.5626747494808537.5219574029048
Trimmed Mean ( 11 / 24 )58.61.5050933932646838.9344609857675
Trimmed Mean ( 12 / 24 )58.60416666666671.457050474251140.2210957700611
Trimmed Mean ( 13 / 24 )58.60869565217391.4082154605914741.6191252633722
Trimmed Mean ( 14 / 24 )58.56818181818181.3714846384105542.7042200677202
Trimmed Mean ( 15 / 24 )58.54761904761911.3300783647555144.0181726122439
Trimmed Mean ( 16 / 24 )58.4751.2890005569810445.3646041371416
Trimmed Mean ( 17 / 24 )58.42105263157891.2580503662274346.4377692657638
Trimmed Mean ( 18 / 24 )58.38888888888891.2236283397882647.7178298264917
Trimmed Mean ( 19 / 24 )58.38235294117651.1844316204850849.2914507949951
Trimmed Mean ( 20 / 24 )58.343751.1382369776714851.2579991201438
Trimmed Mean ( 21 / 24 )58.33333333333331.1062345091670352.7314351974581
Trimmed Mean ( 22 / 24 )58.39285714285711.080538869232154.0404966499305
Trimmed Mean ( 23 / 24 )58.42307692307691.0527225902729655.4971247533774
Trimmed Mean ( 24 / 24 )58.45833333333331.0355618209571856.4508387140998
Median58
Midrange80
Midmean - Weighted Average at Xnp57.7368421052632
Midmean - Weighted Average at X(n+1)p57.7368421052632
Midmean - Empirical Distribution Function57.7368421052632
Midmean - Empirical Distribution Function - Averaging57.7368421052632
Midmean - Empirical Distribution Function - Interpolation57.7368421052632
Midmean - Closest Observation57.7368421052632
Midmean - True Basic - Statistics Graphics Toolkit57.7368421052632
Midmean - MS Excel (old versions)58.1025641025641
Number of observations72


Parameters (Session):
Parameters (R input):
R code (references can be found in the software module):
geomean <- function(x) {
return(exp(mean(log(x))))
}
harmean <- function(x) {
return(1/mean(1/x))
}
quamean <- function(x) {
return(sqrt(mean(x*x)))
}
winmean <- function(x) {
x <-sort(x[!is.na(x)])
n<-length(x)
denom <- 3
nodenom <- n/denom
if (nodenom>40) denom <- n/40
sqrtn = sqrt(n)
roundnodenom = floor(nodenom)
win <- array(NA,dim=c(roundnodenom,2))
for (j in 1:roundnodenom) {
win[j,1] <- (j*x[j+1]+sum(x[(j+1):(n-j)])+j*x[n-j])/n
win[j,2] <- sd(c(rep(x[j+1],j),x[(j+1):(n-j)],rep(x[n-j],j)))/sqrtn
}
return(win)
}
trimean <- function(x) {
x <-sort(x[!is.na(x)])
n<-length(x)
denom <- 3
nodenom <- n/denom
if (nodenom>40) denom <- n/40
sqrtn = sqrt(n)
roundnodenom = floor(nodenom)
tri <- array(NA,dim=c(roundnodenom,2))
for (j in 1:roundnodenom) {
tri[j,1] <- mean(x,trim=j/n)
tri[j,2] <- sd(x[(j+1):(n-j)]) / sqrt(n-j*2)
}
return(tri)
}
midrange <- function(x) {
return((max(x)+min(x))/2)
}
q1 <- function(data,n,p,i,f) {
np <- n*p;
i <<- floor(np)
f <<- np - i
qvalue <- (1-f)*data[i] + f*data[i+1]
}
q2 <- function(data,n,p,i,f) {
np <- (n+1)*p
i <<- floor(np)
f <<- np - i
qvalue <- (1-f)*data[i] + f*data[i+1]
}
q3 <- function(data,n,p,i,f) {
np <- n*p
i <<- floor(np)
f <<- np - i
if (f==0) {
qvalue <- data[i]
} else {
qvalue <- data[i+1]
}
}
q4 <- function(data,n,p,i,f) {
np <- n*p
i <<- floor(np)
f <<- np - i
if (f==0) {
qvalue <- (data[i]+data[i+1])/2
} else {
qvalue <- data[i+1]
}
}
q5 <- function(data,n,p,i,f) {
np <- (n-1)*p
i <<- floor(np)
f <<- np - i
if (f==0) {
qvalue <- data[i+1]
} else {
qvalue <- data[i+1] + f*(data[i+2]-data[i+1])
}
}
q6 <- function(data,n,p,i,f) {
np <- n*p+0.5
i <<- floor(np)
f <<- np - i
qvalue <- data[i]
}
q7 <- function(data,n,p,i,f) {
np <- (n+1)*p
i <<- floor(np)
f <<- np - i
if (f==0) {
qvalue <- data[i]
} else {
qvalue <- f*data[i] + (1-f)*data[i+1]
}
}
q8 <- function(data,n,p,i,f) {
np <- (n+1)*p
i <<- floor(np)
f <<- np - i
if (f==0) {
qvalue <- data[i]
} else {
if (f == 0.5) {
qvalue <- (data[i]+data[i+1])/2
} else {
if (f < 0.5) {
qvalue <- data[i]
} else {
qvalue <- data[i+1]
}
}
}
}
midmean <- function(x,def) {
x <-sort(x[!is.na(x)])
n<-length(x)
if (def==1) {
qvalue1 <- q1(x,n,0.25,i,f)
qvalue3 <- q1(x,n,0.75,i,f)
}
if (def==2) {
qvalue1 <- q2(x,n,0.25,i,f)
qvalue3 <- q2(x,n,0.75,i,f)
}
if (def==3) {
qvalue1 <- q3(x,n,0.25,i,f)
qvalue3 <- q3(x,n,0.75,i,f)
}
if (def==4) {
qvalue1 <- q4(x,n,0.25,i,f)
qvalue3 <- q4(x,n,0.75,i,f)
}
if (def==5) {
qvalue1 <- q5(x,n,0.25,i,f)
qvalue3 <- q5(x,n,0.75,i,f)
}
if (def==6) {
qvalue1 <- q6(x,n,0.25,i,f)
qvalue3 <- q6(x,n,0.75,i,f)
}
if (def==7) {
qvalue1 <- q7(x,n,0.25,i,f)
qvalue3 <- q7(x,n,0.75,i,f)
}
if (def==8) {
qvalue1 <- q8(x,n,0.25,i,f)
qvalue3 <- q8(x,n,0.75,i,f)
}
midm <- 0
myn <- 0
roundno4 <- round(n/4)
round3no4 <- round(3*n/4)
for (i in 1:n) {
if ((x[i]>=qvalue1) & (x[i]<=qvalue3)){
midm = midm + x[i]
myn = myn + 1
}
}
midm = midm / myn
return(midm)
}
(arm <- mean(x))
sqrtn <- sqrt(length(x))
(armse <- sd(x) / sqrtn)
(armose <- arm / armse)
(geo <- geomean(x))
(har <- harmean(x))
(qua <- quamean(x))
(win <- winmean(x))
(tri <- trimean(x))
(midr <- midrange(x))
midm <- array(NA,dim=8)
for (j in 1:8) midm[j] <- midmean(x,j)
midm
bitmap(file='test1.png')
lb <- win[,1] - 2*win[,2]
ub <- win[,1] + 2*win[,2]
if ((ylimmin == '') | (ylimmax == '')) plot(win[,1],type='b',main=main, xlab='j', pch=19, ylab='Winsorized Mean(j/n)', ylim=c(min(lb),max(ub))) else plot(win[,1],type='l',main=main, xlab='j', pch=19, ylab='Winsorized Mean(j/n)', ylim=c(ylimmin,ylimmax))
lines(ub,lty=3)
lines(lb,lty=3)
grid()
dev.off()
bitmap(file='test2.png')
lb <- tri[,1] - 2*tri[,2]
ub <- tri[,1] + 2*tri[,2]
if ((ylimmin == '') | (ylimmax == '')) plot(tri[,1],type='b',main=main, xlab='j', pch=19, ylab='Trimmed Mean(j/n)', ylim=c(min(lb),max(ub))) else plot(tri[,1],type='l',main=main, xlab='j', pch=19, ylab='Trimmed Mean(j/n)', ylim=c(ylimmin,ylimmax))
lines(ub,lty=3)
lines(lb,lty=3)
grid()
dev.off()
load(file='createtable')
a<-table.start()
a<-table.row.start(a)
a<-table.element(a,'Central Tendency - Ungrouped Data',4,TRUE)
a<-table.row.end(a)
a<-table.row.start(a)
a<-table.element(a,'Measure',header=TRUE)
a<-table.element(a,'Value',header=TRUE)
a<-table.element(a,'S.E.',header=TRUE)
a<-table.element(a,'Value/S.E.',header=TRUE)
a<-table.row.end(a)
a<-table.row.start(a)
a<-table.element(a,hyperlink('arithmetic_mean.htm', 'Arithmetic Mean', 'click to view the definition of the Arithmetic Mean'),header=TRUE)
a<-table.element(a,arm)
a<-table.element(a,hyperlink('arithmetic_mean_standard_error.htm', armse, 'click to view the definition of the Standard Error of the Arithmetic Mean'))
a<-table.element(a,armose)
a<-table.row.end(a)
a<-table.row.start(a)
a<-table.element(a,hyperlink('geometric_mean.htm', 'Geometric Mean', 'click to view the definition of the Geometric Mean'),header=TRUE)
a<-table.element(a,geo)
a<-table.element(a,'')
a<-table.row.end(a)
a<-table.row.start(a)
a<-table.element(a,hyperlink('harmonic_mean.htm', 'Harmonic Mean', 'click to view the definition of the Harmonic Mean'),header=TRUE)
a<-table.element(a,har)
a<-table.element(a,'')
a<-table.row.end(a)
a<-table.row.start(a)
a<-table.element(a,hyperlink('quadratic_mean.htm', 'Quadratic Mean', 'click to view the definition of the Quadratic Mean'),header=TRUE)
a<-table.element(a,qua)
a<-table.element(a,'')
a<-table.row.end(a)
for (j in 1:length(win[,1])) {
a<-table.row.start(a)
mylabel <- paste('Winsorized Mean (',j)
mylabel <- paste(mylabel,'/')
mylabel <- paste(mylabel,length(win[,1]))
mylabel <- paste(mylabel,')')
a<-table.element(a,hyperlink('winsorized_mean.htm', mylabel, 'click to view the definition of the Winsorized Mean'),header=TRUE)
a<-table.element(a,win[j,1])
a<-table.element(a,win[j,2])
a<-table.element(a,win[j,1]/win[j,2])
a<-table.row.end(a)
}
for (j in 1:length(tri[,1])) {
a<-table.row.start(a)
mylabel <- paste('Trimmed Mean (',j)
mylabel <- paste(mylabel,'/')
mylabel <- paste(mylabel,length(tri[,1]))
mylabel <- paste(mylabel,')')
a<-table.element(a,hyperlink('arithmetic_mean.htm', mylabel, 'click to view the definition of the Trimmed Mean'),header=TRUE)
a<-table.element(a,tri[j,1])
a<-table.element(a,tri[j,2])
a<-table.element(a,tri[j,1]/tri[j,2])
a<-table.row.end(a)
}
a<-table.row.start(a)
a<-table.element(a,hyperlink('median_1.htm', 'Median', 'click to view the definition of the Median'),header=TRUE)
a<-table.element(a,median(x))
a<-table.element(a,'')
a<-table.row.end(a)
a<-table.row.start(a)
a<-table.element(a,hyperlink('midrange.htm', 'Midrange', 'click to view the definition of the Midrange'),header=TRUE)
a<-table.element(a,midr)
a<-table.element(a,'')
a<-table.row.end(a)
a<-table.row.start(a)
mymid <- hyperlink('midmean.htm', 'Midmean', 'click to view the definition of the Midmean')
mylabel <- paste(mymid,hyperlink('method_1.htm','Weighted Average at Xnp',''),sep=' - ')
a<-table.element(a,mylabel,header=TRUE)
a<-table.element(a,midm[1])
a<-table.element(a,'')
a<-table.row.end(a)
a<-table.row.start(a)
mymid <- hyperlink('midmean.htm', 'Midmean', 'click to view the definition of the Midmean')
mylabel <- paste(mymid,hyperlink('method_2.htm','Weighted Average at X(n+1)p',''),sep=' - ')
a<-table.element(a,mylabel,header=TRUE)
a<-table.element(a,midm[2])
a<-table.element(a,'')
a<-table.row.end(a)
a<-table.row.start(a)
mymid <- hyperlink('midmean.htm', 'Midmean', 'click to view the definition of the Midmean')
mylabel <- paste(mymid,hyperlink('method_3.htm','Empirical Distribution Function',''),sep=' - ')
a<-table.element(a,mylabel,header=TRUE)
a<-table.element(a,midm[3])
a<-table.element(a,'')
a<-table.row.end(a)
a<-table.row.start(a)
mymid <- hyperlink('midmean.htm', 'Midmean', 'click to view the definition of the Midmean')
mylabel <- paste(mymid,hyperlink('method_4.htm','Empirical Distribution Function - Averaging',''),sep=' - ')
a<-table.element(a,mylabel,header=TRUE)
a<-table.element(a,midm[4])
a<-table.element(a,'')
a<-table.row.end(a)
a<-table.row.start(a)
mymid <- hyperlink('midmean.htm', 'Midmean', 'click to view the definition of the Midmean')
mylabel <- paste(mymid,hyperlink('method_5.htm','Empirical Distribution Function - Interpolation',''),sep=' - ')
a<-table.element(a,mylabel,header=TRUE)
a<-table.element(a,midm[5])
a<-table.element(a,'')
a<-table.row.end(a)
a<-table.row.start(a)
mymid <- hyperlink('midmean.htm', 'Midmean', 'click to view the definition of the Midmean')
mylabel <- paste(mymid,hyperlink('method_6.htm','Closest Observation',''),sep=' - ')
a<-table.element(a,mylabel,header=TRUE)
a<-table.element(a,midm[6])
a<-table.element(a,'')
a<-table.row.end(a)
a<-table.row.start(a)
mymid <- hyperlink('midmean.htm', 'Midmean', 'click to view the definition of the Midmean')
mylabel <- paste(mymid,hyperlink('method_7.htm','True Basic - Statistics Graphics Toolkit',''),sep=' - ')
a<-table.element(a,mylabel,header=TRUE)
a<-table.element(a,midm[7])
a<-table.element(a,'')
a<-table.row.end(a)
a<-table.row.start(a)
mymid <- hyperlink('midmean.htm', 'Midmean', 'click to view the definition of the Midmean')
mylabel <- paste(mymid,hyperlink('method_8.htm','MS Excel (old versions)',''),sep=' - ')
a<-table.element(a,mylabel,header=TRUE)
a<-table.element(a,midm[8])
a<-table.element(a,'')
a<-table.row.end(a)
a<-table.row.start(a)
a<-table.element(a,'Number of observations',header=TRUE)
a<-table.element(a,length(x))
a<-table.element(a,'')
a<-table.row.end(a)
a<-table.end(a)
table.save(a,file='mytable.tab')