Free Statistics

of Irreproducible Research!

Author's title

Author*Unverified author*
R Software Modulerwasp_centraltendency.wasp
Title produced by softwareCentral Tendency
Date of computationWed, 25 Feb 2015 11:01:38 +0000
Cite this page as followsStatistical Computations at FreeStatistics.org, Office for Research Development and Education, URL https://freestatistics.org/blog/index.php?v=date/2015/Feb/25/t1424862410nacn6jfeinnuhj7.htm/, Retrieved Sat, 18 May 2024 02:43:32 +0000
Statistical Computations at FreeStatistics.org, Office for Research Development and Education, URL https://freestatistics.org/blog/index.php?pk=277480, Retrieved Sat, 18 May 2024 02:43:32 +0000
QR Codes:

Original text written by user:
IsPrivate?No (this computation is public)
User-defined keywords
Estimated Impact135
Family? (F = Feedback message, R = changed R code, M = changed R Module, P = changed Parameters, D = changed Data)
-       [Central Tendency] [Werkgelegenheid c...] [2015-02-25 11:01:38] [cab9dc260884be88f444bea8f40c034b] [Current]
Feedback Forum

Post a new message
Dataseries X:
3862,5
3875,7
3875,9
3877,7
3880,4
3883,4
3884,2
3884,8
3894,9
3903,3
3911,2
3928,9
3945,6
3965,7
3992,3
4008,7
4014,8
4020,6
4037,5
4058,5
4082,3
4102,4
4127,1
4144,4
4161
4168,2
4178,3
4174,1
4165,7
4167,9
4158,3
4158,3
4143,7
4157,5
4164,8
4173,9
4181,2
4190,7
4206,6
4222,1
4245,8
4255,4
4266,1
4273,6
4282,1
4299,8
4315,7
4331,7
4348,4
4367,8
4387,2
4410,9
4436
4453,8
4469,1
4472
4458,2
4449
4441,5
4445,7
4453,9
4469,7
4487,5
4504
4524,1
4540,5
4548,4
4554,2
4558
4557,5
4554,5
4550
4543,8
4538,2
4543,3
4545,1


Summary of computational transaction
Raw Inputview raw input (R code)
Raw Outputview raw output of R engine
Computing time1 seconds
R Server'George Udny Yule' @ yule.wessa.net

\begin{tabular}{lllllllll}
\hline
Summary of computational transaction \tabularnewline
Raw Input & view raw input (R code)  \tabularnewline
Raw Output & view raw output of R engine  \tabularnewline
Computing time & 1 seconds \tabularnewline
R Server & 'George Udny Yule' @ yule.wessa.net \tabularnewline
\hline
\end{tabular}
%Source: https://freestatistics.org/blog/index.php?pk=277480&T=0

[TABLE]
[ROW][C]Summary of computational transaction[/C][/ROW]
[ROW][C]Raw Input[/C][C]view raw input (R code) [/C][/ROW]
[ROW][C]Raw Output[/C][C]view raw output of R engine [/C][/ROW]
[ROW][C]Computing time[/C][C]1 seconds[/C][/ROW]
[ROW][C]R Server[/C][C]'George Udny Yule' @ yule.wessa.net[/C][/ROW]
[/TABLE]
Source: https://freestatistics.org/blog/index.php?pk=277480&T=0

Globally Unique Identifier (entire table): ba.freestatistics.org/blog/index.php?pk=277480&T=0

As an alternative you can also use a QR Code:  

The GUIDs for individual cells are displayed in the table below:

Summary of computational transaction
Raw Inputview raw input (R code)
Raw Outputview raw output of R engine
Computing time1 seconds
R Server'George Udny Yule' @ yule.wessa.net


Central Tendency - Ungrouped Data
MeasureValueS.E.Value/S.E.
Arithmetic Mean4234.4421052631626.1517513594974161.918108162395
Geometric Mean4228.35205692149
Harmonic Mean4222.23505678537
Quadratic Mean4240.49448770579
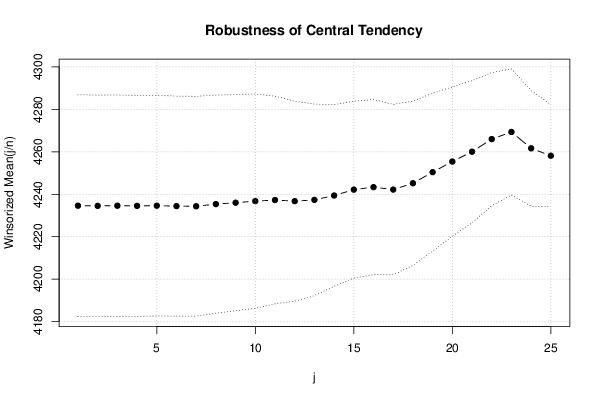
Winsorized Mean ( 1 / 25 )4234.6092105263226.1182866084303162.131968073261
Winsorized Mean ( 2 / 25 )4234.5355263157926.1043646081033162.215613744581
Winsorized Mean ( 3 / 25 )4234.594736842126.0894422347793162.31066569898
Winsorized Mean ( 4 / 25 )4234.5157894736826.0276771077111162.692804738197
Winsorized Mean ( 5 / 25 )4234.6078947368425.9750007860566163.026285527967
Winsorized Mean ( 6 / 25 )4234.4105263157925.9218198799977163.353134383255
Winsorized Mean ( 7 / 25 )4234.3460526315825.8927611939782163.533970784713
Winsorized Mean ( 8 / 25 )4235.3565789473725.6947607695002164.8334700191
Winsorized Mean ( 9 / 25 )4236.019736842125.4673267127473166.331542553378
Winsorized Mean ( 10 / 25 )4236.7565789473725.2391817599962167.864260388289
Winsorized Mean ( 11 / 25 )4237.2776315789524.4817363790997173.079129926272
Winsorized Mean ( 12 / 25 )4236.7407894736823.5548553625274179.86698386668
Winsorized Mean ( 13 / 25 )4237.3565789473722.5734515962172187.714163289829
Winsorized Mean ( 14 / 25 )4239.4013157894721.3843507704034198.24783839858
Winsorized Mean ( 15 / 25 )4242.1842105263220.8270135862421203.686630008664
Winsorized Mean ( 16 / 25 )4243.3421052631620.617708387912205.810559807462
Winsorized Mean ( 17 / 25 )4242.2013157894720.0734213286267211.334243741483
Winsorized Mean ( 18 / 25 )4245.1855263157919.3459227042033219.435670824501
Winsorized Mean ( 19 / 25 )4250.4105263157918.6052582247692228.452111492719
Winsorized Mean ( 20 / 25 )4255.4105263157917.578032101396242.086856012615
Winsorized Mean ( 21 / 25 )4260.0526315789516.7296924263297254.640224280175
Winsorized Mean ( 22 / 25 )4265.9868421052615.6766676934959272.123318903747
Winsorized Mean ( 23 / 25 )4269.3460526315814.8473950034589287.548492623587
Winsorized Mean ( 24 / 25 )4261.6407894736813.6507226436348312.191588733278
Winsorized Mean ( 25 / 25 )4258.1539473684212.037181496876353.750082481811
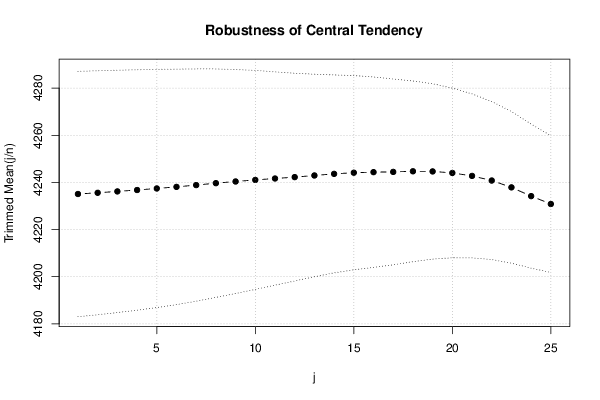
Trimmed Mean ( 1 / 25 )4235.0959459459526.0124428716531162.810389121935
Trimmed Mean ( 2 / 25 )4235.6097222222225.8733192856972163.705695255099
Trimmed Mean ( 3 / 25 )4236.1928571428625.7034101483915164.810538083717
Trimmed Mean ( 4 / 25 )4236.7882352941225.4948547486377166.182089565366
Trimmed Mean ( 5 / 25 )4237.4424242424225.2548832602266167.787052530783
Trimmed Mean ( 6 / 25 )4238.11562524.9708734315457169.722362200034
Trimmed Mean ( 7 / 25 )4238.8725806451624.6316078136772172.090779161052
Trimmed Mean ( 8 / 25 )4239.6916666666724.2177733084756175.065296576332
Trimmed Mean ( 9 / 25 )4240.4017241379323.752118826921178.52730339711
Trimmed Mean ( 10 / 25 )4241.062523.2253386262063182.604980201004
Trimmed Mean ( 11 / 25 )4241.6685185185222.6192204163562187.524965071357
Trimmed Mean ( 12 / 25 )4242.2519230769222.0265949717873192.59680983423
Trimmed Mean ( 13 / 25 )4242.9521.4774148579291197.554036557318
Trimmed Mean ( 14 / 25 )4243.6312520.9846264979278202.225722264775
Trimmed Mean ( 15 / 25 )4244.1304347826120.5962887397432206.062873190985
Trimmed Mean ( 16 / 25 )4244.3545454545520.1971963009756210.145729249041
Trimmed Mean ( 17 / 25 )4244.4690476190519.7044219637525215.406930252864
Trimmed Mean ( 18 / 25 )4244.722519.1617639730191221.520445924333
Trimmed Mean ( 19 / 25 )4244.6710526315818.5937648843149228.284646979281
Trimmed Mean ( 20 / 25 )4244.0333333333317.9877489172801235.940214245278
Trimmed Mean ( 21 / 25 )4242.7617647058817.393949106019243.921707419376
Trimmed Mean ( 22 / 25 )4240.8062516.7540552009179253.121181656825
Trimmed Mean ( 23 / 25 )4237.9066666666716.0814542526858263.527576553525
Trimmed Mean ( 24 / 25 )4234.1964285714315.2792416171521277.12085027952
Trimmed Mean ( 25 / 25 )4230.8538461538514.5133415870939291.514798350517
Median4198.65
Midrange4210.25
Midmean - Weighted Average at Xnp4239.35897435898
Midmean - Weighted Average at X(n+1)p4244.67105263158
Midmean - Empirical Distribution Function4239.35897435898
Midmean - Empirical Distribution Function - Averaging4244.67105263158
Midmean - Empirical Distribution Function - Interpolation4244.67105263158
Midmean - Closest Observation4239.35897435898
Midmean - True Basic - Statistics Graphics Toolkit4244.67105263158
Midmean - MS Excel (old versions)4244.7225
Number of observations76

\begin{tabular}{lllllllll}
\hline
Central Tendency - Ungrouped Data \tabularnewline
Measure & Value & S.E. & Value/S.E. \tabularnewline
Arithmetic Mean & 4234.44210526316 & 26.1517513594974 & 161.918108162395 \tabularnewline
Geometric Mean & 4228.35205692149 &  &  \tabularnewline
Harmonic Mean & 4222.23505678537 &  &  \tabularnewline
Quadratic Mean & 4240.49448770579 &  &  \tabularnewline
Winsorized Mean ( 1 / 25 ) & 4234.60921052632 & 26.1182866084303 & 162.131968073261 \tabularnewline
Winsorized Mean ( 2 / 25 ) & 4234.53552631579 & 26.1043646081033 & 162.215613744581 \tabularnewline
Winsorized Mean ( 3 / 25 ) & 4234.5947368421 & 26.0894422347793 & 162.31066569898 \tabularnewline
Winsorized Mean ( 4 / 25 ) & 4234.51578947368 & 26.0276771077111 & 162.692804738197 \tabularnewline
Winsorized Mean ( 5 / 25 ) & 4234.60789473684 & 25.9750007860566 & 163.026285527967 \tabularnewline
Winsorized Mean ( 6 / 25 ) & 4234.41052631579 & 25.9218198799977 & 163.353134383255 \tabularnewline
Winsorized Mean ( 7 / 25 ) & 4234.34605263158 & 25.8927611939782 & 163.533970784713 \tabularnewline
Winsorized Mean ( 8 / 25 ) & 4235.35657894737 & 25.6947607695002 & 164.8334700191 \tabularnewline
Winsorized Mean ( 9 / 25 ) & 4236.0197368421 & 25.4673267127473 & 166.331542553378 \tabularnewline
Winsorized Mean ( 10 / 25 ) & 4236.75657894737 & 25.2391817599962 & 167.864260388289 \tabularnewline
Winsorized Mean ( 11 / 25 ) & 4237.27763157895 & 24.4817363790997 & 173.079129926272 \tabularnewline
Winsorized Mean ( 12 / 25 ) & 4236.74078947368 & 23.5548553625274 & 179.86698386668 \tabularnewline
Winsorized Mean ( 13 / 25 ) & 4237.35657894737 & 22.5734515962172 & 187.714163289829 \tabularnewline
Winsorized Mean ( 14 / 25 ) & 4239.40131578947 & 21.3843507704034 & 198.24783839858 \tabularnewline
Winsorized Mean ( 15 / 25 ) & 4242.18421052632 & 20.8270135862421 & 203.686630008664 \tabularnewline
Winsorized Mean ( 16 / 25 ) & 4243.34210526316 & 20.617708387912 & 205.810559807462 \tabularnewline
Winsorized Mean ( 17 / 25 ) & 4242.20131578947 & 20.0734213286267 & 211.334243741483 \tabularnewline
Winsorized Mean ( 18 / 25 ) & 4245.18552631579 & 19.3459227042033 & 219.435670824501 \tabularnewline
Winsorized Mean ( 19 / 25 ) & 4250.41052631579 & 18.6052582247692 & 228.452111492719 \tabularnewline
Winsorized Mean ( 20 / 25 ) & 4255.41052631579 & 17.578032101396 & 242.086856012615 \tabularnewline
Winsorized Mean ( 21 / 25 ) & 4260.05263157895 & 16.7296924263297 & 254.640224280175 \tabularnewline
Winsorized Mean ( 22 / 25 ) & 4265.98684210526 & 15.6766676934959 & 272.123318903747 \tabularnewline
Winsorized Mean ( 23 / 25 ) & 4269.34605263158 & 14.8473950034589 & 287.548492623587 \tabularnewline
Winsorized Mean ( 24 / 25 ) & 4261.64078947368 & 13.6507226436348 & 312.191588733278 \tabularnewline
Winsorized Mean ( 25 / 25 ) & 4258.15394736842 & 12.037181496876 & 353.750082481811 \tabularnewline
Trimmed Mean ( 1 / 25 ) & 4235.09594594595 & 26.0124428716531 & 162.810389121935 \tabularnewline
Trimmed Mean ( 2 / 25 ) & 4235.60972222222 & 25.8733192856972 & 163.705695255099 \tabularnewline
Trimmed Mean ( 3 / 25 ) & 4236.19285714286 & 25.7034101483915 & 164.810538083717 \tabularnewline
Trimmed Mean ( 4 / 25 ) & 4236.78823529412 & 25.4948547486377 & 166.182089565366 \tabularnewline
Trimmed Mean ( 5 / 25 ) & 4237.44242424242 & 25.2548832602266 & 167.787052530783 \tabularnewline
Trimmed Mean ( 6 / 25 ) & 4238.115625 & 24.9708734315457 & 169.722362200034 \tabularnewline
Trimmed Mean ( 7 / 25 ) & 4238.87258064516 & 24.6316078136772 & 172.090779161052 \tabularnewline
Trimmed Mean ( 8 / 25 ) & 4239.69166666667 & 24.2177733084756 & 175.065296576332 \tabularnewline
Trimmed Mean ( 9 / 25 ) & 4240.40172413793 & 23.752118826921 & 178.52730339711 \tabularnewline
Trimmed Mean ( 10 / 25 ) & 4241.0625 & 23.2253386262063 & 182.604980201004 \tabularnewline
Trimmed Mean ( 11 / 25 ) & 4241.66851851852 & 22.6192204163562 & 187.524965071357 \tabularnewline
Trimmed Mean ( 12 / 25 ) & 4242.25192307692 & 22.0265949717873 & 192.59680983423 \tabularnewline
Trimmed Mean ( 13 / 25 ) & 4242.95 & 21.4774148579291 & 197.554036557318 \tabularnewline
Trimmed Mean ( 14 / 25 ) & 4243.63125 & 20.9846264979278 & 202.225722264775 \tabularnewline
Trimmed Mean ( 15 / 25 ) & 4244.13043478261 & 20.5962887397432 & 206.062873190985 \tabularnewline
Trimmed Mean ( 16 / 25 ) & 4244.35454545455 & 20.1971963009756 & 210.145729249041 \tabularnewline
Trimmed Mean ( 17 / 25 ) & 4244.46904761905 & 19.7044219637525 & 215.406930252864 \tabularnewline
Trimmed Mean ( 18 / 25 ) & 4244.7225 & 19.1617639730191 & 221.520445924333 \tabularnewline
Trimmed Mean ( 19 / 25 ) & 4244.67105263158 & 18.5937648843149 & 228.284646979281 \tabularnewline
Trimmed Mean ( 20 / 25 ) & 4244.03333333333 & 17.9877489172801 & 235.940214245278 \tabularnewline
Trimmed Mean ( 21 / 25 ) & 4242.76176470588 & 17.393949106019 & 243.921707419376 \tabularnewline
Trimmed Mean ( 22 / 25 ) & 4240.80625 & 16.7540552009179 & 253.121181656825 \tabularnewline
Trimmed Mean ( 23 / 25 ) & 4237.90666666667 & 16.0814542526858 & 263.527576553525 \tabularnewline
Trimmed Mean ( 24 / 25 ) & 4234.19642857143 & 15.2792416171521 & 277.12085027952 \tabularnewline
Trimmed Mean ( 25 / 25 ) & 4230.85384615385 & 14.5133415870939 & 291.514798350517 \tabularnewline
Median & 4198.65 &  &  \tabularnewline
Midrange & 4210.25 &  &  \tabularnewline
Midmean - Weighted Average at Xnp & 4239.35897435898 &  &  \tabularnewline
Midmean - Weighted Average at X(n+1)p & 4244.67105263158 &  &  \tabularnewline
Midmean - Empirical Distribution Function & 4239.35897435898 &  &  \tabularnewline
Midmean - Empirical Distribution Function - Averaging & 4244.67105263158 &  &  \tabularnewline
Midmean - Empirical Distribution Function - Interpolation & 4244.67105263158 &  &  \tabularnewline
Midmean - Closest Observation & 4239.35897435898 &  &  \tabularnewline
Midmean - True Basic - Statistics Graphics Toolkit & 4244.67105263158 &  &  \tabularnewline
Midmean - MS Excel (old versions) & 4244.7225 &  &  \tabularnewline
Number of observations & 76 &  &  \tabularnewline
\hline
\end{tabular}
%Source: https://freestatistics.org/blog/index.php?pk=277480&T=1

[TABLE]
[ROW][C]Central Tendency - Ungrouped Data[/C][/ROW]
[ROW][C]Measure[/C][C]Value[/C][C]S.E.[/C][C]Value/S.E.[/C][/ROW]
[ROW][C]Arithmetic Mean[/C][C]4234.44210526316[/C][C]26.1517513594974[/C][C]161.918108162395[/C][/ROW]
[ROW][C]Geometric Mean[/C][C]4228.35205692149[/C][C][/C][C][/C][/ROW]
[ROW][C]Harmonic Mean[/C][C]4222.23505678537[/C][C][/C][C][/C][/ROW]
[ROW][C]Quadratic Mean[/C][C]4240.49448770579[/C][C][/C][C][/C][/ROW]
[ROW][C]Winsorized Mean ( 1 / 25 )[/C][C]4234.60921052632[/C][C]26.1182866084303[/C][C]162.131968073261[/C][/ROW]
[ROW][C]Winsorized Mean ( 2 / 25 )[/C][C]4234.53552631579[/C][C]26.1043646081033[/C][C]162.215613744581[/C][/ROW]
[ROW][C]Winsorized Mean ( 3 / 25 )[/C][C]4234.5947368421[/C][C]26.0894422347793[/C][C]162.31066569898[/C][/ROW]
[ROW][C]Winsorized Mean ( 4 / 25 )[/C][C]4234.51578947368[/C][C]26.0276771077111[/C][C]162.692804738197[/C][/ROW]
[ROW][C]Winsorized Mean ( 5 / 25 )[/C][C]4234.60789473684[/C][C]25.9750007860566[/C][C]163.026285527967[/C][/ROW]
[ROW][C]Winsorized Mean ( 6 / 25 )[/C][C]4234.41052631579[/C][C]25.9218198799977[/C][C]163.353134383255[/C][/ROW]
[ROW][C]Winsorized Mean ( 7 / 25 )[/C][C]4234.34605263158[/C][C]25.8927611939782[/C][C]163.533970784713[/C][/ROW]
[ROW][C]Winsorized Mean ( 8 / 25 )[/C][C]4235.35657894737[/C][C]25.6947607695002[/C][C]164.8334700191[/C][/ROW]
[ROW][C]Winsorized Mean ( 9 / 25 )[/C][C]4236.0197368421[/C][C]25.4673267127473[/C][C]166.331542553378[/C][/ROW]
[ROW][C]Winsorized Mean ( 10 / 25 )[/C][C]4236.75657894737[/C][C]25.2391817599962[/C][C]167.864260388289[/C][/ROW]
[ROW][C]Winsorized Mean ( 11 / 25 )[/C][C]4237.27763157895[/C][C]24.4817363790997[/C][C]173.079129926272[/C][/ROW]
[ROW][C]Winsorized Mean ( 12 / 25 )[/C][C]4236.74078947368[/C][C]23.5548553625274[/C][C]179.86698386668[/C][/ROW]
[ROW][C]Winsorized Mean ( 13 / 25 )[/C][C]4237.35657894737[/C][C]22.5734515962172[/C][C]187.714163289829[/C][/ROW]
[ROW][C]Winsorized Mean ( 14 / 25 )[/C][C]4239.40131578947[/C][C]21.3843507704034[/C][C]198.24783839858[/C][/ROW]
[ROW][C]Winsorized Mean ( 15 / 25 )[/C][C]4242.18421052632[/C][C]20.8270135862421[/C][C]203.686630008664[/C][/ROW]
[ROW][C]Winsorized Mean ( 16 / 25 )[/C][C]4243.34210526316[/C][C]20.617708387912[/C][C]205.810559807462[/C][/ROW]
[ROW][C]Winsorized Mean ( 17 / 25 )[/C][C]4242.20131578947[/C][C]20.0734213286267[/C][C]211.334243741483[/C][/ROW]
[ROW][C]Winsorized Mean ( 18 / 25 )[/C][C]4245.18552631579[/C][C]19.3459227042033[/C][C]219.435670824501[/C][/ROW]
[ROW][C]Winsorized Mean ( 19 / 25 )[/C][C]4250.41052631579[/C][C]18.6052582247692[/C][C]228.452111492719[/C][/ROW]
[ROW][C]Winsorized Mean ( 20 / 25 )[/C][C]4255.41052631579[/C][C]17.578032101396[/C][C]242.086856012615[/C][/ROW]
[ROW][C]Winsorized Mean ( 21 / 25 )[/C][C]4260.05263157895[/C][C]16.7296924263297[/C][C]254.640224280175[/C][/ROW]
[ROW][C]Winsorized Mean ( 22 / 25 )[/C][C]4265.98684210526[/C][C]15.6766676934959[/C][C]272.123318903747[/C][/ROW]
[ROW][C]Winsorized Mean ( 23 / 25 )[/C][C]4269.34605263158[/C][C]14.8473950034589[/C][C]287.548492623587[/C][/ROW]
[ROW][C]Winsorized Mean ( 24 / 25 )[/C][C]4261.64078947368[/C][C]13.6507226436348[/C][C]312.191588733278[/C][/ROW]
[ROW][C]Winsorized Mean ( 25 / 25 )[/C][C]4258.15394736842[/C][C]12.037181496876[/C][C]353.750082481811[/C][/ROW]
[ROW][C]Trimmed Mean ( 1 / 25 )[/C][C]4235.09594594595[/C][C]26.0124428716531[/C][C]162.810389121935[/C][/ROW]
[ROW][C]Trimmed Mean ( 2 / 25 )[/C][C]4235.60972222222[/C][C]25.8733192856972[/C][C]163.705695255099[/C][/ROW]
[ROW][C]Trimmed Mean ( 3 / 25 )[/C][C]4236.19285714286[/C][C]25.7034101483915[/C][C]164.810538083717[/C][/ROW]
[ROW][C]Trimmed Mean ( 4 / 25 )[/C][C]4236.78823529412[/C][C]25.4948547486377[/C][C]166.182089565366[/C][/ROW]
[ROW][C]Trimmed Mean ( 5 / 25 )[/C][C]4237.44242424242[/C][C]25.2548832602266[/C][C]167.787052530783[/C][/ROW]
[ROW][C]Trimmed Mean ( 6 / 25 )[/C][C]4238.115625[/C][C]24.9708734315457[/C][C]169.722362200034[/C][/ROW]
[ROW][C]Trimmed Mean ( 7 / 25 )[/C][C]4238.87258064516[/C][C]24.6316078136772[/C][C]172.090779161052[/C][/ROW]
[ROW][C]Trimmed Mean ( 8 / 25 )[/C][C]4239.69166666667[/C][C]24.2177733084756[/C][C]175.065296576332[/C][/ROW]
[ROW][C]Trimmed Mean ( 9 / 25 )[/C][C]4240.40172413793[/C][C]23.752118826921[/C][C]178.52730339711[/C][/ROW]
[ROW][C]Trimmed Mean ( 10 / 25 )[/C][C]4241.0625[/C][C]23.2253386262063[/C][C]182.604980201004[/C][/ROW]
[ROW][C]Trimmed Mean ( 11 / 25 )[/C][C]4241.66851851852[/C][C]22.6192204163562[/C][C]187.524965071357[/C][/ROW]
[ROW][C]Trimmed Mean ( 12 / 25 )[/C][C]4242.25192307692[/C][C]22.0265949717873[/C][C]192.59680983423[/C][/ROW]
[ROW][C]Trimmed Mean ( 13 / 25 )[/C][C]4242.95[/C][C]21.4774148579291[/C][C]197.554036557318[/C][/ROW]
[ROW][C]Trimmed Mean ( 14 / 25 )[/C][C]4243.63125[/C][C]20.9846264979278[/C][C]202.225722264775[/C][/ROW]
[ROW][C]Trimmed Mean ( 15 / 25 )[/C][C]4244.13043478261[/C][C]20.5962887397432[/C][C]206.062873190985[/C][/ROW]
[ROW][C]Trimmed Mean ( 16 / 25 )[/C][C]4244.35454545455[/C][C]20.1971963009756[/C][C]210.145729249041[/C][/ROW]
[ROW][C]Trimmed Mean ( 17 / 25 )[/C][C]4244.46904761905[/C][C]19.7044219637525[/C][C]215.406930252864[/C][/ROW]
[ROW][C]Trimmed Mean ( 18 / 25 )[/C][C]4244.7225[/C][C]19.1617639730191[/C][C]221.520445924333[/C][/ROW]
[ROW][C]Trimmed Mean ( 19 / 25 )[/C][C]4244.67105263158[/C][C]18.5937648843149[/C][C]228.284646979281[/C][/ROW]
[ROW][C]Trimmed Mean ( 20 / 25 )[/C][C]4244.03333333333[/C][C]17.9877489172801[/C][C]235.940214245278[/C][/ROW]
[ROW][C]Trimmed Mean ( 21 / 25 )[/C][C]4242.76176470588[/C][C]17.393949106019[/C][C]243.921707419376[/C][/ROW]
[ROW][C]Trimmed Mean ( 22 / 25 )[/C][C]4240.80625[/C][C]16.7540552009179[/C][C]253.121181656825[/C][/ROW]
[ROW][C]Trimmed Mean ( 23 / 25 )[/C][C]4237.90666666667[/C][C]16.0814542526858[/C][C]263.527576553525[/C][/ROW]
[ROW][C]Trimmed Mean ( 24 / 25 )[/C][C]4234.19642857143[/C][C]15.2792416171521[/C][C]277.12085027952[/C][/ROW]
[ROW][C]Trimmed Mean ( 25 / 25 )[/C][C]4230.85384615385[/C][C]14.5133415870939[/C][C]291.514798350517[/C][/ROW]
[ROW][C]Median[/C][C]4198.65[/C][C][/C][C][/C][/ROW]
[ROW][C]Midrange[/C][C]4210.25[/C][C][/C][C][/C][/ROW]
[ROW][C]Midmean - Weighted Average at Xnp[/C][C]4239.35897435898[/C][C][/C][C][/C][/ROW]
[ROW][C]Midmean - Weighted Average at X(n+1)p[/C][C]4244.67105263158[/C][C][/C][C][/C][/ROW]
[ROW][C]Midmean - Empirical Distribution Function[/C][C]4239.35897435898[/C][C][/C][C][/C][/ROW]
[ROW][C]Midmean - Empirical Distribution Function - Averaging[/C][C]4244.67105263158[/C][C][/C][C][/C][/ROW]
[ROW][C]Midmean - Empirical Distribution Function - Interpolation[/C][C]4244.67105263158[/C][C][/C][C][/C][/ROW]
[ROW][C]Midmean - Closest Observation[/C][C]4239.35897435898[/C][C][/C][C][/C][/ROW]
[ROW][C]Midmean - True Basic - Statistics Graphics Toolkit[/C][C]4244.67105263158[/C][C][/C][C][/C][/ROW]
[ROW][C]Midmean - MS Excel (old versions)[/C][C]4244.7225[/C][C][/C][C][/C][/ROW]
[ROW][C]Number of observations[/C][C]76[/C][C][/C][C][/C][/ROW]
[/TABLE]
Source: https://freestatistics.org/blog/index.php?pk=277480&T=1

Globally Unique Identifier (entire table): ba.freestatistics.org/blog/index.php?pk=277480&T=1

As an alternative you can also use a QR Code:  

The GUIDs for individual cells are displayed in the table below:

Central Tendency - Ungrouped Data
MeasureValueS.E.Value/S.E.
Arithmetic Mean4234.4421052631626.1517513594974161.918108162395
Geometric Mean4228.35205692149
Harmonic Mean4222.23505678537
Quadratic Mean4240.49448770579
Winsorized Mean ( 1 / 25 )4234.6092105263226.1182866084303162.131968073261
Winsorized Mean ( 2 / 25 )4234.5355263157926.1043646081033162.215613744581
Winsorized Mean ( 3 / 25 )4234.594736842126.0894422347793162.31066569898
Winsorized Mean ( 4 / 25 )4234.5157894736826.0276771077111162.692804738197
Winsorized Mean ( 5 / 25 )4234.6078947368425.9750007860566163.026285527967
Winsorized Mean ( 6 / 25 )4234.4105263157925.9218198799977163.353134383255
Winsorized Mean ( 7 / 25 )4234.3460526315825.8927611939782163.533970784713
Winsorized Mean ( 8 / 25 )4235.3565789473725.6947607695002164.8334700191
Winsorized Mean ( 9 / 25 )4236.019736842125.4673267127473166.331542553378
Winsorized Mean ( 10 / 25 )4236.7565789473725.2391817599962167.864260388289
Winsorized Mean ( 11 / 25 )4237.2776315789524.4817363790997173.079129926272
Winsorized Mean ( 12 / 25 )4236.7407894736823.5548553625274179.86698386668
Winsorized Mean ( 13 / 25 )4237.3565789473722.5734515962172187.714163289829
Winsorized Mean ( 14 / 25 )4239.4013157894721.3843507704034198.24783839858
Winsorized Mean ( 15 / 25 )4242.1842105263220.8270135862421203.686630008664
Winsorized Mean ( 16 / 25 )4243.3421052631620.617708387912205.810559807462
Winsorized Mean ( 17 / 25 )4242.2013157894720.0734213286267211.334243741483
Winsorized Mean ( 18 / 25 )4245.1855263157919.3459227042033219.435670824501
Winsorized Mean ( 19 / 25 )4250.4105263157918.6052582247692228.452111492719
Winsorized Mean ( 20 / 25 )4255.4105263157917.578032101396242.086856012615
Winsorized Mean ( 21 / 25 )4260.0526315789516.7296924263297254.640224280175
Winsorized Mean ( 22 / 25 )4265.9868421052615.6766676934959272.123318903747
Winsorized Mean ( 23 / 25 )4269.3460526315814.8473950034589287.548492623587
Winsorized Mean ( 24 / 25 )4261.6407894736813.6507226436348312.191588733278
Winsorized Mean ( 25 / 25 )4258.1539473684212.037181496876353.750082481811
Trimmed Mean ( 1 / 25 )4235.0959459459526.0124428716531162.810389121935
Trimmed Mean ( 2 / 25 )4235.6097222222225.8733192856972163.705695255099
Trimmed Mean ( 3 / 25 )4236.1928571428625.7034101483915164.810538083717
Trimmed Mean ( 4 / 25 )4236.7882352941225.4948547486377166.182089565366
Trimmed Mean ( 5 / 25 )4237.4424242424225.2548832602266167.787052530783
Trimmed Mean ( 6 / 25 )4238.11562524.9708734315457169.722362200034
Trimmed Mean ( 7 / 25 )4238.8725806451624.6316078136772172.090779161052
Trimmed Mean ( 8 / 25 )4239.6916666666724.2177733084756175.065296576332
Trimmed Mean ( 9 / 25 )4240.4017241379323.752118826921178.52730339711
Trimmed Mean ( 10 / 25 )4241.062523.2253386262063182.604980201004
Trimmed Mean ( 11 / 25 )4241.6685185185222.6192204163562187.524965071357
Trimmed Mean ( 12 / 25 )4242.2519230769222.0265949717873192.59680983423
Trimmed Mean ( 13 / 25 )4242.9521.4774148579291197.554036557318
Trimmed Mean ( 14 / 25 )4243.6312520.9846264979278202.225722264775
Trimmed Mean ( 15 / 25 )4244.1304347826120.5962887397432206.062873190985
Trimmed Mean ( 16 / 25 )4244.3545454545520.1971963009756210.145729249041
Trimmed Mean ( 17 / 25 )4244.4690476190519.7044219637525215.406930252864
Trimmed Mean ( 18 / 25 )4244.722519.1617639730191221.520445924333
Trimmed Mean ( 19 / 25 )4244.6710526315818.5937648843149228.284646979281
Trimmed Mean ( 20 / 25 )4244.0333333333317.9877489172801235.940214245278
Trimmed Mean ( 21 / 25 )4242.7617647058817.393949106019243.921707419376
Trimmed Mean ( 22 / 25 )4240.8062516.7540552009179253.121181656825
Trimmed Mean ( 23 / 25 )4237.9066666666716.0814542526858263.527576553525
Trimmed Mean ( 24 / 25 )4234.1964285714315.2792416171521277.12085027952
Trimmed Mean ( 25 / 25 )4230.8538461538514.5133415870939291.514798350517
Median4198.65
Midrange4210.25
Midmean - Weighted Average at Xnp4239.35897435898
Midmean - Weighted Average at X(n+1)p4244.67105263158
Midmean - Empirical Distribution Function4239.35897435898
Midmean - Empirical Distribution Function - Averaging4244.67105263158
Midmean - Empirical Distribution Function - Interpolation4244.67105263158
Midmean - Closest Observation4239.35897435898
Midmean - True Basic - Statistics Graphics Toolkit4244.67105263158
Midmean - MS Excel (old versions)4244.7225
Number of observations76


Parameters (Session):
Parameters (R input):
R code (references can be found in the software module):
geomean <- function(x) {
return(exp(mean(log(x))))
}
harmean <- function(x) {
return(1/mean(1/x))
}
quamean <- function(x) {
return(sqrt(mean(x*x)))
}
winmean <- function(x) {
x <-sort(x[!is.na(x)])
n<-length(x)
denom <- 3
nodenom <- n/denom
if (nodenom>40) denom <- n/40
sqrtn = sqrt(n)
roundnodenom = floor(nodenom)
win <- array(NA,dim=c(roundnodenom,2))
for (j in 1:roundnodenom) {
win[j,1] <- (j*x[j+1]+sum(x[(j+1):(n-j)])+j*x[n-j])/n
win[j,2] <- sd(c(rep(x[j+1],j),x[(j+1):(n-j)],rep(x[n-j],j)))/sqrtn
}
return(win)
}
trimean <- function(x) {
x <-sort(x[!is.na(x)])
n<-length(x)
denom <- 3
nodenom <- n/denom
if (nodenom>40) denom <- n/40
sqrtn = sqrt(n)
roundnodenom = floor(nodenom)
tri <- array(NA,dim=c(roundnodenom,2))
for (j in 1:roundnodenom) {
tri[j,1] <- mean(x,trim=j/n)
tri[j,2] <- sd(x[(j+1):(n-j)]) / sqrt(n-j*2)
}
return(tri)
}
midrange <- function(x) {
return((max(x)+min(x))/2)
}
q1 <- function(data,n,p,i,f) {
np <- n*p;
i <<- floor(np)
f <<- np - i
qvalue <- (1-f)*data[i] + f*data[i+1]
}
q2 <- function(data,n,p,i,f) {
np <- (n+1)*p
i <<- floor(np)
f <<- np - i
qvalue <- (1-f)*data[i] + f*data[i+1]
}
q3 <- function(data,n,p,i,f) {
np <- n*p
i <<- floor(np)
f <<- np - i
if (f==0) {
qvalue <- data[i]
} else {
qvalue <- data[i+1]
}
}
q4 <- function(data,n,p,i,f) {
np <- n*p
i <<- floor(np)
f <<- np - i
if (f==0) {
qvalue <- (data[i]+data[i+1])/2
} else {
qvalue <- data[i+1]
}
}
q5 <- function(data,n,p,i,f) {
np <- (n-1)*p
i <<- floor(np)
f <<- np - i
if (f==0) {
qvalue <- data[i+1]
} else {
qvalue <- data[i+1] + f*(data[i+2]-data[i+1])
}
}
q6 <- function(data,n,p,i,f) {
np <- n*p+0.5
i <<- floor(np)
f <<- np - i
qvalue <- data[i]
}
q7 <- function(data,n,p,i,f) {
np <- (n+1)*p
i <<- floor(np)
f <<- np - i
if (f==0) {
qvalue <- data[i]
} else {
qvalue <- f*data[i] + (1-f)*data[i+1]
}
}
q8 <- function(data,n,p,i,f) {
np <- (n+1)*p
i <<- floor(np)
f <<- np - i
if (f==0) {
qvalue <- data[i]
} else {
if (f == 0.5) {
qvalue <- (data[i]+data[i+1])/2
} else {
if (f < 0.5) {
qvalue <- data[i]
} else {
qvalue <- data[i+1]
}
}
}
}
midmean <- function(x,def) {
x <-sort(x[!is.na(x)])
n<-length(x)
if (def==1) {
qvalue1 <- q1(x,n,0.25,i,f)
qvalue3 <- q1(x,n,0.75,i,f)
}
if (def==2) {
qvalue1 <- q2(x,n,0.25,i,f)
qvalue3 <- q2(x,n,0.75,i,f)
}
if (def==3) {
qvalue1 <- q3(x,n,0.25,i,f)
qvalue3 <- q3(x,n,0.75,i,f)
}
if (def==4) {
qvalue1 <- q4(x,n,0.25,i,f)
qvalue3 <- q4(x,n,0.75,i,f)
}
if (def==5) {
qvalue1 <- q5(x,n,0.25,i,f)
qvalue3 <- q5(x,n,0.75,i,f)
}
if (def==6) {
qvalue1 <- q6(x,n,0.25,i,f)
qvalue3 <- q6(x,n,0.75,i,f)
}
if (def==7) {
qvalue1 <- q7(x,n,0.25,i,f)
qvalue3 <- q7(x,n,0.75,i,f)
}
if (def==8) {
qvalue1 <- q8(x,n,0.25,i,f)
qvalue3 <- q8(x,n,0.75,i,f)
}
midm <- 0
myn <- 0
roundno4 <- round(n/4)
round3no4 <- round(3*n/4)
for (i in 1:n) {
if ((x[i]>=qvalue1) & (x[i]<=qvalue3)){
midm = midm + x[i]
myn = myn + 1
}
}
midm = midm / myn
return(midm)
}
(arm <- mean(x))
sqrtn <- sqrt(length(x))
(armse <- sd(x) / sqrtn)
(armose <- arm / armse)
(geo <- geomean(x))
(har <- harmean(x))
(qua <- quamean(x))
(win <- winmean(x))
(tri <- trimean(x))
(midr <- midrange(x))
midm <- array(NA,dim=8)
for (j in 1:8) midm[j] <- midmean(x,j)
midm
bitmap(file='test1.png')
lb <- win[,1] - 2*win[,2]
ub <- win[,1] + 2*win[,2]
if ((ylimmin == '') | (ylimmax == '')) plot(win[,1],type='b',main=main, xlab='j', pch=19, ylab='Winsorized Mean(j/n)', ylim=c(min(lb),max(ub))) else plot(win[,1],type='l',main=main, xlab='j', pch=19, ylab='Winsorized Mean(j/n)', ylim=c(ylimmin,ylimmax))
lines(ub,lty=3)
lines(lb,lty=3)
grid()
dev.off()
bitmap(file='test2.png')
lb <- tri[,1] - 2*tri[,2]
ub <- tri[,1] + 2*tri[,2]
if ((ylimmin == '') | (ylimmax == '')) plot(tri[,1],type='b',main=main, xlab='j', pch=19, ylab='Trimmed Mean(j/n)', ylim=c(min(lb),max(ub))) else plot(tri[,1],type='l',main=main, xlab='j', pch=19, ylab='Trimmed Mean(j/n)', ylim=c(ylimmin,ylimmax))
lines(ub,lty=3)
lines(lb,lty=3)
grid()
dev.off()
load(file='createtable')
a<-table.start()
a<-table.row.start(a)
a<-table.element(a,'Central Tendency - Ungrouped Data',4,TRUE)
a<-table.row.end(a)
a<-table.row.start(a)
a<-table.element(a,'Measure',header=TRUE)
a<-table.element(a,'Value',header=TRUE)
a<-table.element(a,'S.E.',header=TRUE)
a<-table.element(a,'Value/S.E.',header=TRUE)
a<-table.row.end(a)
a<-table.row.start(a)
a<-table.element(a,hyperlink('arithmetic_mean.htm', 'Arithmetic Mean', 'click to view the definition of the Arithmetic Mean'),header=TRUE)
a<-table.element(a,arm)
a<-table.element(a,hyperlink('arithmetic_mean_standard_error.htm', armse, 'click to view the definition of the Standard Error of the Arithmetic Mean'))
a<-table.element(a,armose)
a<-table.row.end(a)
a<-table.row.start(a)
a<-table.element(a,hyperlink('geometric_mean.htm', 'Geometric Mean', 'click to view the definition of the Geometric Mean'),header=TRUE)
a<-table.element(a,geo)
a<-table.element(a,'')
a<-table.row.end(a)
a<-table.row.start(a)
a<-table.element(a,hyperlink('harmonic_mean.htm', 'Harmonic Mean', 'click to view the definition of the Harmonic Mean'),header=TRUE)
a<-table.element(a,har)
a<-table.element(a,'')
a<-table.row.end(a)
a<-table.row.start(a)
a<-table.element(a,hyperlink('quadratic_mean.htm', 'Quadratic Mean', 'click to view the definition of the Quadratic Mean'),header=TRUE)
a<-table.element(a,qua)
a<-table.element(a,'')
a<-table.row.end(a)
for (j in 1:length(win[,1])) {
a<-table.row.start(a)
mylabel <- paste('Winsorized Mean (',j)
mylabel <- paste(mylabel,'/')
mylabel <- paste(mylabel,length(win[,1]))
mylabel <- paste(mylabel,')')
a<-table.element(a,hyperlink('winsorized_mean.htm', mylabel, 'click to view the definition of the Winsorized Mean'),header=TRUE)
a<-table.element(a,win[j,1])
a<-table.element(a,win[j,2])
a<-table.element(a,win[j,1]/win[j,2])
a<-table.row.end(a)
}
for (j in 1:length(tri[,1])) {
a<-table.row.start(a)
mylabel <- paste('Trimmed Mean (',j)
mylabel <- paste(mylabel,'/')
mylabel <- paste(mylabel,length(tri[,1]))
mylabel <- paste(mylabel,')')
a<-table.element(a,hyperlink('arithmetic_mean.htm', mylabel, 'click to view the definition of the Trimmed Mean'),header=TRUE)
a<-table.element(a,tri[j,1])
a<-table.element(a,tri[j,2])
a<-table.element(a,tri[j,1]/tri[j,2])
a<-table.row.end(a)
}
a<-table.row.start(a)
a<-table.element(a,hyperlink('median_1.htm', 'Median', 'click to view the definition of the Median'),header=TRUE)
a<-table.element(a,median(x))
a<-table.element(a,'')
a<-table.row.end(a)
a<-table.row.start(a)
a<-table.element(a,hyperlink('midrange.htm', 'Midrange', 'click to view the definition of the Midrange'),header=TRUE)
a<-table.element(a,midr)
a<-table.element(a,'')
a<-table.row.end(a)
a<-table.row.start(a)
mymid <- hyperlink('midmean.htm', 'Midmean', 'click to view the definition of the Midmean')
mylabel <- paste(mymid,hyperlink('method_1.htm','Weighted Average at Xnp',''),sep=' - ')
a<-table.element(a,mylabel,header=TRUE)
a<-table.element(a,midm[1])
a<-table.element(a,'')
a<-table.row.end(a)
a<-table.row.start(a)
mymid <- hyperlink('midmean.htm', 'Midmean', 'click to view the definition of the Midmean')
mylabel <- paste(mymid,hyperlink('method_2.htm','Weighted Average at X(n+1)p',''),sep=' - ')
a<-table.element(a,mylabel,header=TRUE)
a<-table.element(a,midm[2])
a<-table.element(a,'')
a<-table.row.end(a)
a<-table.row.start(a)
mymid <- hyperlink('midmean.htm', 'Midmean', 'click to view the definition of the Midmean')
mylabel <- paste(mymid,hyperlink('method_3.htm','Empirical Distribution Function',''),sep=' - ')
a<-table.element(a,mylabel,header=TRUE)
a<-table.element(a,midm[3])
a<-table.element(a,'')
a<-table.row.end(a)
a<-table.row.start(a)
mymid <- hyperlink('midmean.htm', 'Midmean', 'click to view the definition of the Midmean')
mylabel <- paste(mymid,hyperlink('method_4.htm','Empirical Distribution Function - Averaging',''),sep=' - ')
a<-table.element(a,mylabel,header=TRUE)
a<-table.element(a,midm[4])
a<-table.element(a,'')
a<-table.row.end(a)
a<-table.row.start(a)
mymid <- hyperlink('midmean.htm', 'Midmean', 'click to view the definition of the Midmean')
mylabel <- paste(mymid,hyperlink('method_5.htm','Empirical Distribution Function - Interpolation',''),sep=' - ')
a<-table.element(a,mylabel,header=TRUE)
a<-table.element(a,midm[5])
a<-table.element(a,'')
a<-table.row.end(a)
a<-table.row.start(a)
mymid <- hyperlink('midmean.htm', 'Midmean', 'click to view the definition of the Midmean')
mylabel <- paste(mymid,hyperlink('method_6.htm','Closest Observation',''),sep=' - ')
a<-table.element(a,mylabel,header=TRUE)
a<-table.element(a,midm[6])
a<-table.element(a,'')
a<-table.row.end(a)
a<-table.row.start(a)
mymid <- hyperlink('midmean.htm', 'Midmean', 'click to view the definition of the Midmean')
mylabel <- paste(mymid,hyperlink('method_7.htm','True Basic - Statistics Graphics Toolkit',''),sep=' - ')
a<-table.element(a,mylabel,header=TRUE)
a<-table.element(a,midm[7])
a<-table.element(a,'')
a<-table.row.end(a)
a<-table.row.start(a)
mymid <- hyperlink('midmean.htm', 'Midmean', 'click to view the definition of the Midmean')
mylabel <- paste(mymid,hyperlink('method_8.htm','MS Excel (old versions)',''),sep=' - ')
a<-table.element(a,mylabel,header=TRUE)
a<-table.element(a,midm[8])
a<-table.element(a,'')
a<-table.row.end(a)
a<-table.row.start(a)
a<-table.element(a,'Number of observations',header=TRUE)
a<-table.element(a,length(x))
a<-table.element(a,'')
a<-table.row.end(a)
a<-table.end(a)
table.save(a,file='mytable.tab')