Free Statistics

of Irreproducible Research!

Author's title

Author*Unverified author*
R Software Modulerwasp_summary1.wasp
Title produced by softwareUnivariate Summary Statistics
Date of computationSun, 22 Feb 2015 23:08:34 +0000
Cite this page as followsStatistical Computations at FreeStatistics.org, Office for Research Development and Education, URL https://freestatistics.org/blog/index.php?v=date/2015/Feb/22/t1424646895xuzkjzmw0fgrlfz.htm/, Retrieved Sat, 18 May 2024 07:02:40 +0000
Statistical Computations at FreeStatistics.org, Office for Research Development and Education, URL https://freestatistics.org/blog/index.php?pk=277376, Retrieved Sat, 18 May 2024 07:02:40 +0000
QR Codes:

Original text written by user:
IsPrivate?No (this computation is public)
User-defined keywords
Estimated Impact152
Family? (F = Feedback message, R = changed R code, M = changed R Module, P = changed Parameters, D = changed Data)
-       [Univariate Summary Statistics] [115 Chordata] [2015-02-22 23:08:34] [a44ffa9506d7609ca3ebf932faecbf7f] [Current]
Feedback Forum

Post a new message
Dataseries X:
0.057762265
0.090103357
0
0
0.095894024
0
0.098893929

0.243091192
0.117945826
0.029479131
0.094597338
0
0
0.533190139
0
0
0.239016269
0
0.261113127
0
0.123685166
0.015896594
0.216608494
0.032867387
0.187468237
0.071334989
0.06158354
0.040526053
0.012635302
0.053626447
0.028979682
0.022790195
0.049446964
0
0
0
0.128360589
0.10172336
0
0.115847174
0
0
0
0
0.693147181
0.274653072
0.176209756
0.229919702
0.072975089
0.020793082
0.096270442
0.202732554
0.095403555
0
0.059398328
0
0.091160778
0.070068491
0.096659395
0.032366241
0.018328881
0
0
0
0.082194878
0.050714443
0.028039353
0.063076589
0.025322438
0.044043051
0.019712249
0.129002479
0.069435452
0.017272216
0.144542902
0
0.113407967
0.075492586
0.11985994
0
0.019214848
0.029629355
0.02207454
0.169942342
0
0.223057247
0
0.097487033
0
0.074701712
0
0.022186241
0


Summary of computational transaction
Raw Inputview raw input (R code)
Raw Outputview raw output of R engine
Computing time3 seconds
R Server'Herman Ole Andreas Wold' @ wold.wessa.net
R Framework error message
Warning: there are blank lines in the 'Data' field.
Please, use NA for missing data - blank lines are simply
 deleted and are NOT treated as missing values.

\begin{tabular}{lllllllll}
\hline
Summary of computational transaction \tabularnewline
Raw Input & view raw input (R code)  \tabularnewline
Raw Output & view raw output of R engine  \tabularnewline
Computing time & 3 seconds \tabularnewline
R Server & 'Herman Ole Andreas Wold' @ wold.wessa.net \tabularnewline
R Framework error message & 
Warning: there are blank lines in the 'Data' field.
Please, use NA for missing data - blank lines are simply
 deleted and are NOT treated as missing values.
\tabularnewline \hline \end{tabular} %Source: https://freestatistics.org/blog/index.php?pk=277376&T=0

[TABLE]
[ROW][C]Summary of computational transaction[/C][/ROW]
[ROW][C]Raw Input[/C][C]view raw input (R code) [/C][/ROW]
[ROW][C]Raw Output[/C][C]view raw output of R engine [/C][/ROW]
[ROW][C]Computing time[/C][C]3 seconds[/C][/ROW]
[ROW][C]R Server[/C][C]'Herman Ole Andreas Wold' @ wold.wessa.net[/C][/ROW]
[ROW][C]R Framework error message[/C][C]
Warning: there are blank lines in the 'Data' field.
Please, use NA for missing data - blank lines are simply
 deleted and are NOT treated as missing values.
[/C][/ROW] [/TABLE] Source: https://freestatistics.org/blog/index.php?pk=277376&T=0

Globally Unique Identifier (entire table): ba.freestatistics.org/blog/index.php?pk=277376&T=0

As an alternative you can also use a QR Code:  

The GUIDs for individual cells are displayed in the table below:

Summary of computational transaction
Raw Inputview raw input (R code)
Raw Outputview raw output of R engine
Computing time3 seconds
R Server'Herman Ole Andreas Wold' @ wold.wessa.net
R Framework error message
Warning: there are blank lines in the 'Data' field.
Please, use NA for missing data - blank lines are simply
 deleted and are NOT treated as missing values.


Central Tendency - Ungrouped Data
MeasureValueS.E.Value/S.E.
Arithmetic Mean0.0752146578279570.01120448298632916.71290749601999
Geometric Mean0
Harmonic Mean0
Quadratic Mean0.131175322143088
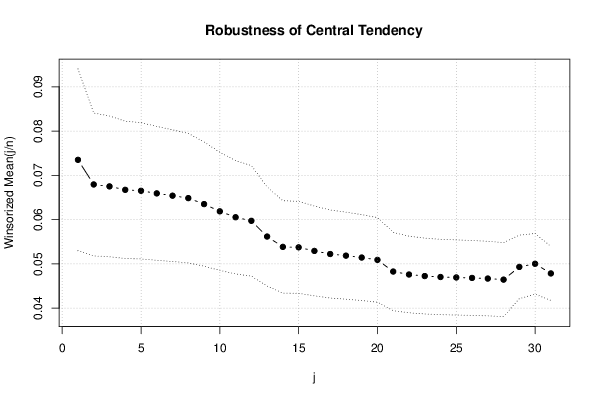
Winsorized Mean ( 1 / 31 )0.07349468963440860.01026615087574297.15893332603007
Winsorized Mean ( 2 / 31 )0.06793475270967740.008069680257676468.41851852123299
Winsorized Mean ( 3 / 31 )0.06749798029032260.007951046836963978.48919414944561
Winsorized Mean ( 4 / 31 )0.06672284330107530.007752540622293438.60657770811353
Winsorized Mean ( 5 / 31 )0.06650376141935480.007698771815331938.6382299689561
Winsorized Mean ( 6 / 31 )0.06591688612903230.007558070491196158.72139075784145
Winsorized Mean ( 7 / 31 )0.06540035725806450.007437640019883178.79315980381258
Winsorized Mean ( 8 / 31 )0.06484562581720430.007311141085825378.86942613416737
Winsorized Mean ( 9 / 31 )0.06350279291397850.007014659842299269.05286846997895
Winsorized Mean ( 10 / 31 )0.06186146850537630.006669380869186629.27544396080064
Winsorized Mean ( 11 / 31 )0.06052982021505380.006402198977839069.45453592188795
Winsorized Mean ( 12 / 31 )0.05972112163440860.006245192948619329.56273443042488
Winsorized Mean ( 13 / 31 )0.05617066227956990.0055980645031121210.0339433831716
Winsorized Mean ( 14 / 31 )0.05383124376344090.0052134122339549410.325529873283
Winsorized Mean ( 15 / 31 )0.05372771311827960.0051972192176640610.3377808147235
Winsorized Mean ( 16 / 31 )0.05292333926881720.0050734478909937210.4314344812264
Winsorized Mean ( 17 / 31 )0.05222410440860210.0049687019258528710.5106132724269
Winsorized Mean ( 18 / 31 )0.05185363073118280.0049142131671558210.5517666750289
Winsorized Mean ( 19 / 31 )0.05142487387096780.0048519316990732910.5988453796227
Winsorized Mean ( 20 / 31 )0.05090031322580650.004776768660649810.6558045494467
Winsorized Mean ( 21 / 31 )0.04826185358064520.0044149348606447710.9314984487895
Winsorized Mean ( 22 / 31 )0.04759252581720430.0043277555431647710.997045776389
Winsorized Mean ( 23 / 31 )0.04724458379569890.004283156706846511.0303187647045
Winsorized Mean ( 24 / 31 )0.04703099979569890.0042560045461434411.0505050654412
Winsorized Mean ( 25 / 31 )0.04692644253763440.0042427695398665511.0603326663626
Winsorized Mean ( 26 / 31 )0.04682120739784950.0042294820354306911.07019890512
Winsorized Mean ( 27 / 31 )0.0466788131720430.0042115496926805611.0835242554939
Winsorized Mean ( 28 / 31 )0.0464360811720430.0041810916801178811.1062097472911
Winsorized Mean ( 29 / 31 )0.04930450609677420.0035880208043708213.741421464645
Winsorized Mean ( 30 / 31 )0.05001543222580640.0034293737629181914.5844214377048
Winsorized Mean ( 31 / 31 )0.04783781322580640.0030504210014945215.6823642383687
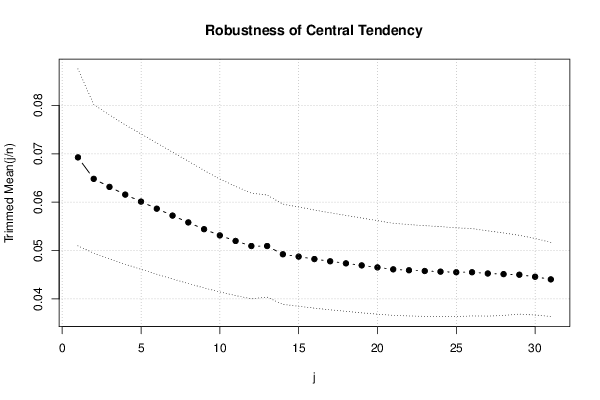
Trimmed Mean ( 1 / 31 )0.06925072524175820.00913465549705367.58109873591787
Trimmed Mean ( 2 / 31 )0.06481602087640450.007677119051339278.44275312691646
Trimmed Mean ( 3 / 31 )0.06314911248275860.007430774738813218.49832146746577
Trimmed Mean ( 4 / 31 )0.06156305481176470.007196110625148748.55504563765544
Trimmed Mean ( 5 / 31 )0.0601176923734940.006992943325164138.59690827997422
Trimmed Mean ( 6 / 31 )0.05865126170370370.006770361711483998.66294360672319
Trimmed Mean ( 7 / 31 )0.05722572779746840.006546658497586968.7412116912103
Trimmed Mean ( 8 / 31 )0.0558152629740260.006312215682507188.84242012336569
Trimmed Mean ( 9 / 31 )0.05441555673333330.006063488931189658.97429802393605
Trimmed Mean ( 10 / 31 )0.0531292356301370.005835305636993449.10479055172696
Trimmed Mean ( 11 / 31 )0.05198543611267610.005638477887412999.21976411909415
Trimmed Mean ( 12 / 31 )0.05093849576811590.005458488513437929.33197819189571
Trimmed Mean ( 13 / 31 )0.05093849576811590.0052734540180989.65941783000284
Trimmed Mean ( 14 / 31 )0.04923493790769230.005177075864082769.51018281367515
Trimmed Mean ( 15 / 31 )0.04875029341269840.005127535256418939.50754913906641
Trimmed Mean ( 16 / 31 )0.04824439173770490.005066903667291429.52147404126484
Trimmed Mean ( 17 / 31 )0.04778343610169490.005011199866298849.53532833983465
Trimmed Mean ( 18 / 31 )0.04735724192982460.004957370146955769.55289609732003
Trimmed Mean ( 19 / 31 )0.04693485389090910.004896566058510099.58525900193619
Trimmed Mean ( 20 / 31 )0.04652018471698110.004828288263046589.63492280960615
Trimmed Mean ( 21 / 31 )0.04612082005882350.004752817445835859.70389049956715
Trimmed Mean ( 22 / 31 )0.04592731557142860.004719245254729479.73191963808233
Trimmed Mean ( 23 / 31 )0.04577754327659570.004685591406108189.76985385813192
Trimmed Mean ( 24 / 31 )0.04564572224444440.004643664584131729.82967684626157
Trimmed Mean ( 25 / 31 )0.04552088618604650.004587609838783849.92257140117085
Trimmed Mean ( 26 / 31 )0.04552088618604650.0045102212471023210.0928277554659
Trimmed Mean ( 27 / 31 )0.0452624010256410.0044044430615996110.2765322181739
Trimmed Mean ( 28 / 31 )0.04513054283783780.0042611829833303410.5910830429924
Trimmed Mean ( 29 / 31 )0.04500664991428570.0040689192260000111.0610821730492
Trimmed Mean ( 30 / 31 )0.04458898990909090.0039549905115437611.2741079350116
Trimmed Mean ( 31 / 31 )0.04404634567741940.0038260509980753811.5122212692868
Median0.040526053
Midrange0.3465735905
Midmean - Weighted Average at Xnp0.0297689492898551
Midmean - Weighted Average at X(n+1)p0.0307363504857143
Midmean - Empirical Distribution Function0.0307363504857143
Midmean - Empirical Distribution Function - Averaging0.0307363504857143
Midmean - Empirical Distribution Function - Interpolation0.0307363504857143
Midmean - Closest Observation0.0307363504857143
Midmean - True Basic - Statistics Graphics Toolkit0.0307363504857143
Midmean - MS Excel (old versions)0.0307363504857143
Number of observations93

\begin{tabular}{lllllllll}
\hline
Central Tendency - Ungrouped Data \tabularnewline
Measure & Value & S.E. & Value/S.E. \tabularnewline
Arithmetic Mean & 0.075214657827957 & 0.0112044829863291 & 6.71290749601999 \tabularnewline
Geometric Mean & 0 &  &  \tabularnewline
Harmonic Mean & 0 &  &  \tabularnewline
Quadratic Mean & 0.131175322143088 &  &  \tabularnewline
Winsorized Mean ( 1 / 31 ) & 0.0734946896344086 & 0.0102661508757429 & 7.15893332603007 \tabularnewline
Winsorized Mean ( 2 / 31 ) & 0.0679347527096774 & 0.00806968025767646 & 8.41851852123299 \tabularnewline
Winsorized Mean ( 3 / 31 ) & 0.0674979802903226 & 0.00795104683696397 & 8.48919414944561 \tabularnewline
Winsorized Mean ( 4 / 31 ) & 0.0667228433010753 & 0.00775254062229343 & 8.60657770811353 \tabularnewline
Winsorized Mean ( 5 / 31 ) & 0.0665037614193548 & 0.00769877181533193 & 8.6382299689561 \tabularnewline
Winsorized Mean ( 6 / 31 ) & 0.0659168861290323 & 0.00755807049119615 & 8.72139075784145 \tabularnewline
Winsorized Mean ( 7 / 31 ) & 0.0654003572580645 & 0.00743764001988317 & 8.79315980381258 \tabularnewline
Winsorized Mean ( 8 / 31 ) & 0.0648456258172043 & 0.00731114108582537 & 8.86942613416737 \tabularnewline
Winsorized Mean ( 9 / 31 ) & 0.0635027929139785 & 0.00701465984229926 & 9.05286846997895 \tabularnewline
Winsorized Mean ( 10 / 31 ) & 0.0618614685053763 & 0.00666938086918662 & 9.27544396080064 \tabularnewline
Winsorized Mean ( 11 / 31 ) & 0.0605298202150538 & 0.00640219897783906 & 9.45453592188795 \tabularnewline
Winsorized Mean ( 12 / 31 ) & 0.0597211216344086 & 0.00624519294861932 & 9.56273443042488 \tabularnewline
Winsorized Mean ( 13 / 31 ) & 0.0561706622795699 & 0.00559806450311212 & 10.0339433831716 \tabularnewline
Winsorized Mean ( 14 / 31 ) & 0.0538312437634409 & 0.00521341223395494 & 10.325529873283 \tabularnewline
Winsorized Mean ( 15 / 31 ) & 0.0537277131182796 & 0.00519721921766406 & 10.3377808147235 \tabularnewline
Winsorized Mean ( 16 / 31 ) & 0.0529233392688172 & 0.00507344789099372 & 10.4314344812264 \tabularnewline
Winsorized Mean ( 17 / 31 ) & 0.0522241044086021 & 0.00496870192585287 & 10.5106132724269 \tabularnewline
Winsorized Mean ( 18 / 31 ) & 0.0518536307311828 & 0.00491421316715582 & 10.5517666750289 \tabularnewline
Winsorized Mean ( 19 / 31 ) & 0.0514248738709678 & 0.00485193169907329 & 10.5988453796227 \tabularnewline
Winsorized Mean ( 20 / 31 ) & 0.0509003132258065 & 0.0047767686606498 & 10.6558045494467 \tabularnewline
Winsorized Mean ( 21 / 31 ) & 0.0482618535806452 & 0.00441493486064477 & 10.9314984487895 \tabularnewline
Winsorized Mean ( 22 / 31 ) & 0.0475925258172043 & 0.00432775554316477 & 10.997045776389 \tabularnewline
Winsorized Mean ( 23 / 31 ) & 0.0472445837956989 & 0.0042831567068465 & 11.0303187647045 \tabularnewline
Winsorized Mean ( 24 / 31 ) & 0.0470309997956989 & 0.00425600454614344 & 11.0505050654412 \tabularnewline
Winsorized Mean ( 25 / 31 ) & 0.0469264425376344 & 0.00424276953986655 & 11.0603326663626 \tabularnewline
Winsorized Mean ( 26 / 31 ) & 0.0468212073978495 & 0.00422948203543069 & 11.07019890512 \tabularnewline
Winsorized Mean ( 27 / 31 ) & 0.046678813172043 & 0.00421154969268056 & 11.0835242554939 \tabularnewline
Winsorized Mean ( 28 / 31 ) & 0.046436081172043 & 0.00418109168011788 & 11.1062097472911 \tabularnewline
Winsorized Mean ( 29 / 31 ) & 0.0493045060967742 & 0.00358802080437082 & 13.741421464645 \tabularnewline
Winsorized Mean ( 30 / 31 ) & 0.0500154322258064 & 0.00342937376291819 & 14.5844214377048 \tabularnewline
Winsorized Mean ( 31 / 31 ) & 0.0478378132258064 & 0.00305042100149452 & 15.6823642383687 \tabularnewline
Trimmed Mean ( 1 / 31 ) & 0.0692507252417582 & 0.0091346554970536 & 7.58109873591787 \tabularnewline
Trimmed Mean ( 2 / 31 ) & 0.0648160208764045 & 0.00767711905133927 & 8.44275312691646 \tabularnewline
Trimmed Mean ( 3 / 31 ) & 0.0631491124827586 & 0.00743077473881321 & 8.49832146746577 \tabularnewline
Trimmed Mean ( 4 / 31 ) & 0.0615630548117647 & 0.00719611062514874 & 8.55504563765544 \tabularnewline
Trimmed Mean ( 5 / 31 ) & 0.060117692373494 & 0.00699294332516413 & 8.59690827997422 \tabularnewline
Trimmed Mean ( 6 / 31 ) & 0.0586512617037037 & 0.00677036171148399 & 8.66294360672319 \tabularnewline
Trimmed Mean ( 7 / 31 ) & 0.0572257277974684 & 0.00654665849758696 & 8.7412116912103 \tabularnewline
Trimmed Mean ( 8 / 31 ) & 0.055815262974026 & 0.00631221568250718 & 8.84242012336569 \tabularnewline
Trimmed Mean ( 9 / 31 ) & 0.0544155567333333 & 0.00606348893118965 & 8.97429802393605 \tabularnewline
Trimmed Mean ( 10 / 31 ) & 0.053129235630137 & 0.00583530563699344 & 9.10479055172696 \tabularnewline
Trimmed Mean ( 11 / 31 ) & 0.0519854361126761 & 0.00563847788741299 & 9.21976411909415 \tabularnewline
Trimmed Mean ( 12 / 31 ) & 0.0509384957681159 & 0.00545848851343792 & 9.33197819189571 \tabularnewline
Trimmed Mean ( 13 / 31 ) & 0.0509384957681159 & 0.005273454018098 & 9.65941783000284 \tabularnewline
Trimmed Mean ( 14 / 31 ) & 0.0492349379076923 & 0.00517707586408276 & 9.51018281367515 \tabularnewline
Trimmed Mean ( 15 / 31 ) & 0.0487502934126984 & 0.00512753525641893 & 9.50754913906641 \tabularnewline
Trimmed Mean ( 16 / 31 ) & 0.0482443917377049 & 0.00506690366729142 & 9.52147404126484 \tabularnewline
Trimmed Mean ( 17 / 31 ) & 0.0477834361016949 & 0.00501119986629884 & 9.53532833983465 \tabularnewline
Trimmed Mean ( 18 / 31 ) & 0.0473572419298246 & 0.00495737014695576 & 9.55289609732003 \tabularnewline
Trimmed Mean ( 19 / 31 ) & 0.0469348538909091 & 0.00489656605851009 & 9.58525900193619 \tabularnewline
Trimmed Mean ( 20 / 31 ) & 0.0465201847169811 & 0.00482828826304658 & 9.63492280960615 \tabularnewline
Trimmed Mean ( 21 / 31 ) & 0.0461208200588235 & 0.00475281744583585 & 9.70389049956715 \tabularnewline
Trimmed Mean ( 22 / 31 ) & 0.0459273155714286 & 0.00471924525472947 & 9.73191963808233 \tabularnewline
Trimmed Mean ( 23 / 31 ) & 0.0457775432765957 & 0.00468559140610818 & 9.76985385813192 \tabularnewline
Trimmed Mean ( 24 / 31 ) & 0.0456457222444444 & 0.00464366458413172 & 9.82967684626157 \tabularnewline
Trimmed Mean ( 25 / 31 ) & 0.0455208861860465 & 0.00458760983878384 & 9.92257140117085 \tabularnewline
Trimmed Mean ( 26 / 31 ) & 0.0455208861860465 & 0.00451022124710232 & 10.0928277554659 \tabularnewline
Trimmed Mean ( 27 / 31 ) & 0.045262401025641 & 0.00440444306159961 & 10.2765322181739 \tabularnewline
Trimmed Mean ( 28 / 31 ) & 0.0451305428378378 & 0.00426118298333034 & 10.5910830429924 \tabularnewline
Trimmed Mean ( 29 / 31 ) & 0.0450066499142857 & 0.00406891922600001 & 11.0610821730492 \tabularnewline
Trimmed Mean ( 30 / 31 ) & 0.0445889899090909 & 0.00395499051154376 & 11.2741079350116 \tabularnewline
Trimmed Mean ( 31 / 31 ) & 0.0440463456774194 & 0.00382605099807538 & 11.5122212692868 \tabularnewline
Median & 0.040526053 &  &  \tabularnewline
Midrange & 0.3465735905 &  &  \tabularnewline
Midmean - Weighted Average at Xnp & 0.0297689492898551 &  &  \tabularnewline
Midmean - Weighted Average at X(n+1)p & 0.0307363504857143 &  &  \tabularnewline
Midmean - Empirical Distribution Function & 0.0307363504857143 &  &  \tabularnewline
Midmean - Empirical Distribution Function - Averaging & 0.0307363504857143 &  &  \tabularnewline
Midmean - Empirical Distribution Function - Interpolation & 0.0307363504857143 &  &  \tabularnewline
Midmean - Closest Observation & 0.0307363504857143 &  &  \tabularnewline
Midmean - True Basic - Statistics Graphics Toolkit & 0.0307363504857143 &  &  \tabularnewline
Midmean - MS Excel (old versions) & 0.0307363504857143 &  &  \tabularnewline
Number of observations & 93 &  &  \tabularnewline
\hline
\end{tabular}
%Source: https://freestatistics.org/blog/index.php?pk=277376&T=1

[TABLE]
[ROW][C]Central Tendency - Ungrouped Data[/C][/ROW]
[ROW][C]Measure[/C][C]Value[/C][C]S.E.[/C][C]Value/S.E.[/C][/ROW]
[ROW][C]Arithmetic Mean[/C][C]0.075214657827957[/C][C]0.0112044829863291[/C][C]6.71290749601999[/C][/ROW]
[ROW][C]Geometric Mean[/C][C]0[/C][C][/C][C][/C][/ROW]
[ROW][C]Harmonic Mean[/C][C]0[/C][C][/C][C][/C][/ROW]
[ROW][C]Quadratic Mean[/C][C]0.131175322143088[/C][C][/C][C][/C][/ROW]
[ROW][C]Winsorized Mean ( 1 / 31 )[/C][C]0.0734946896344086[/C][C]0.0102661508757429[/C][C]7.15893332603007[/C][/ROW]
[ROW][C]Winsorized Mean ( 2 / 31 )[/C][C]0.0679347527096774[/C][C]0.00806968025767646[/C][C]8.41851852123299[/C][/ROW]
[ROW][C]Winsorized Mean ( 3 / 31 )[/C][C]0.0674979802903226[/C][C]0.00795104683696397[/C][C]8.48919414944561[/C][/ROW]
[ROW][C]Winsorized Mean ( 4 / 31 )[/C][C]0.0667228433010753[/C][C]0.00775254062229343[/C][C]8.60657770811353[/C][/ROW]
[ROW][C]Winsorized Mean ( 5 / 31 )[/C][C]0.0665037614193548[/C][C]0.00769877181533193[/C][C]8.6382299689561[/C][/ROW]
[ROW][C]Winsorized Mean ( 6 / 31 )[/C][C]0.0659168861290323[/C][C]0.00755807049119615[/C][C]8.72139075784145[/C][/ROW]
[ROW][C]Winsorized Mean ( 7 / 31 )[/C][C]0.0654003572580645[/C][C]0.00743764001988317[/C][C]8.79315980381258[/C][/ROW]
[ROW][C]Winsorized Mean ( 8 / 31 )[/C][C]0.0648456258172043[/C][C]0.00731114108582537[/C][C]8.86942613416737[/C][/ROW]
[ROW][C]Winsorized Mean ( 9 / 31 )[/C][C]0.0635027929139785[/C][C]0.00701465984229926[/C][C]9.05286846997895[/C][/ROW]
[ROW][C]Winsorized Mean ( 10 / 31 )[/C][C]0.0618614685053763[/C][C]0.00666938086918662[/C][C]9.27544396080064[/C][/ROW]
[ROW][C]Winsorized Mean ( 11 / 31 )[/C][C]0.0605298202150538[/C][C]0.00640219897783906[/C][C]9.45453592188795[/C][/ROW]
[ROW][C]Winsorized Mean ( 12 / 31 )[/C][C]0.0597211216344086[/C][C]0.00624519294861932[/C][C]9.56273443042488[/C][/ROW]
[ROW][C]Winsorized Mean ( 13 / 31 )[/C][C]0.0561706622795699[/C][C]0.00559806450311212[/C][C]10.0339433831716[/C][/ROW]
[ROW][C]Winsorized Mean ( 14 / 31 )[/C][C]0.0538312437634409[/C][C]0.00521341223395494[/C][C]10.325529873283[/C][/ROW]
[ROW][C]Winsorized Mean ( 15 / 31 )[/C][C]0.0537277131182796[/C][C]0.00519721921766406[/C][C]10.3377808147235[/C][/ROW]
[ROW][C]Winsorized Mean ( 16 / 31 )[/C][C]0.0529233392688172[/C][C]0.00507344789099372[/C][C]10.4314344812264[/C][/ROW]
[ROW][C]Winsorized Mean ( 17 / 31 )[/C][C]0.0522241044086021[/C][C]0.00496870192585287[/C][C]10.5106132724269[/C][/ROW]
[ROW][C]Winsorized Mean ( 18 / 31 )[/C][C]0.0518536307311828[/C][C]0.00491421316715582[/C][C]10.5517666750289[/C][/ROW]
[ROW][C]Winsorized Mean ( 19 / 31 )[/C][C]0.0514248738709678[/C][C]0.00485193169907329[/C][C]10.5988453796227[/C][/ROW]
[ROW][C]Winsorized Mean ( 20 / 31 )[/C][C]0.0509003132258065[/C][C]0.0047767686606498[/C][C]10.6558045494467[/C][/ROW]
[ROW][C]Winsorized Mean ( 21 / 31 )[/C][C]0.0482618535806452[/C][C]0.00441493486064477[/C][C]10.9314984487895[/C][/ROW]
[ROW][C]Winsorized Mean ( 22 / 31 )[/C][C]0.0475925258172043[/C][C]0.00432775554316477[/C][C]10.997045776389[/C][/ROW]
[ROW][C]Winsorized Mean ( 23 / 31 )[/C][C]0.0472445837956989[/C][C]0.0042831567068465[/C][C]11.0303187647045[/C][/ROW]
[ROW][C]Winsorized Mean ( 24 / 31 )[/C][C]0.0470309997956989[/C][C]0.00425600454614344[/C][C]11.0505050654412[/C][/ROW]
[ROW][C]Winsorized Mean ( 25 / 31 )[/C][C]0.0469264425376344[/C][C]0.00424276953986655[/C][C]11.0603326663626[/C][/ROW]
[ROW][C]Winsorized Mean ( 26 / 31 )[/C][C]0.0468212073978495[/C][C]0.00422948203543069[/C][C]11.07019890512[/C][/ROW]
[ROW][C]Winsorized Mean ( 27 / 31 )[/C][C]0.046678813172043[/C][C]0.00421154969268056[/C][C]11.0835242554939[/C][/ROW]
[ROW][C]Winsorized Mean ( 28 / 31 )[/C][C]0.046436081172043[/C][C]0.00418109168011788[/C][C]11.1062097472911[/C][/ROW]
[ROW][C]Winsorized Mean ( 29 / 31 )[/C][C]0.0493045060967742[/C][C]0.00358802080437082[/C][C]13.741421464645[/C][/ROW]
[ROW][C]Winsorized Mean ( 30 / 31 )[/C][C]0.0500154322258064[/C][C]0.00342937376291819[/C][C]14.5844214377048[/C][/ROW]
[ROW][C]Winsorized Mean ( 31 / 31 )[/C][C]0.0478378132258064[/C][C]0.00305042100149452[/C][C]15.6823642383687[/C][/ROW]
[ROW][C]Trimmed Mean ( 1 / 31 )[/C][C]0.0692507252417582[/C][C]0.0091346554970536[/C][C]7.58109873591787[/C][/ROW]
[ROW][C]Trimmed Mean ( 2 / 31 )[/C][C]0.0648160208764045[/C][C]0.00767711905133927[/C][C]8.44275312691646[/C][/ROW]
[ROW][C]Trimmed Mean ( 3 / 31 )[/C][C]0.0631491124827586[/C][C]0.00743077473881321[/C][C]8.49832146746577[/C][/ROW]
[ROW][C]Trimmed Mean ( 4 / 31 )[/C][C]0.0615630548117647[/C][C]0.00719611062514874[/C][C]8.55504563765544[/C][/ROW]
[ROW][C]Trimmed Mean ( 5 / 31 )[/C][C]0.060117692373494[/C][C]0.00699294332516413[/C][C]8.59690827997422[/C][/ROW]
[ROW][C]Trimmed Mean ( 6 / 31 )[/C][C]0.0586512617037037[/C][C]0.00677036171148399[/C][C]8.66294360672319[/C][/ROW]
[ROW][C]Trimmed Mean ( 7 / 31 )[/C][C]0.0572257277974684[/C][C]0.00654665849758696[/C][C]8.7412116912103[/C][/ROW]
[ROW][C]Trimmed Mean ( 8 / 31 )[/C][C]0.055815262974026[/C][C]0.00631221568250718[/C][C]8.84242012336569[/C][/ROW]
[ROW][C]Trimmed Mean ( 9 / 31 )[/C][C]0.0544155567333333[/C][C]0.00606348893118965[/C][C]8.97429802393605[/C][/ROW]
[ROW][C]Trimmed Mean ( 10 / 31 )[/C][C]0.053129235630137[/C][C]0.00583530563699344[/C][C]9.10479055172696[/C][/ROW]
[ROW][C]Trimmed Mean ( 11 / 31 )[/C][C]0.0519854361126761[/C][C]0.00563847788741299[/C][C]9.21976411909415[/C][/ROW]
[ROW][C]Trimmed Mean ( 12 / 31 )[/C][C]0.0509384957681159[/C][C]0.00545848851343792[/C][C]9.33197819189571[/C][/ROW]
[ROW][C]Trimmed Mean ( 13 / 31 )[/C][C]0.0509384957681159[/C][C]0.005273454018098[/C][C]9.65941783000284[/C][/ROW]
[ROW][C]Trimmed Mean ( 14 / 31 )[/C][C]0.0492349379076923[/C][C]0.00517707586408276[/C][C]9.51018281367515[/C][/ROW]
[ROW][C]Trimmed Mean ( 15 / 31 )[/C][C]0.0487502934126984[/C][C]0.00512753525641893[/C][C]9.50754913906641[/C][/ROW]
[ROW][C]Trimmed Mean ( 16 / 31 )[/C][C]0.0482443917377049[/C][C]0.00506690366729142[/C][C]9.52147404126484[/C][/ROW]
[ROW][C]Trimmed Mean ( 17 / 31 )[/C][C]0.0477834361016949[/C][C]0.00501119986629884[/C][C]9.53532833983465[/C][/ROW]
[ROW][C]Trimmed Mean ( 18 / 31 )[/C][C]0.0473572419298246[/C][C]0.00495737014695576[/C][C]9.55289609732003[/C][/ROW]
[ROW][C]Trimmed Mean ( 19 / 31 )[/C][C]0.0469348538909091[/C][C]0.00489656605851009[/C][C]9.58525900193619[/C][/ROW]
[ROW][C]Trimmed Mean ( 20 / 31 )[/C][C]0.0465201847169811[/C][C]0.00482828826304658[/C][C]9.63492280960615[/C][/ROW]
[ROW][C]Trimmed Mean ( 21 / 31 )[/C][C]0.0461208200588235[/C][C]0.00475281744583585[/C][C]9.70389049956715[/C][/ROW]
[ROW][C]Trimmed Mean ( 22 / 31 )[/C][C]0.0459273155714286[/C][C]0.00471924525472947[/C][C]9.73191963808233[/C][/ROW]
[ROW][C]Trimmed Mean ( 23 / 31 )[/C][C]0.0457775432765957[/C][C]0.00468559140610818[/C][C]9.76985385813192[/C][/ROW]
[ROW][C]Trimmed Mean ( 24 / 31 )[/C][C]0.0456457222444444[/C][C]0.00464366458413172[/C][C]9.82967684626157[/C][/ROW]
[ROW][C]Trimmed Mean ( 25 / 31 )[/C][C]0.0455208861860465[/C][C]0.00458760983878384[/C][C]9.92257140117085[/C][/ROW]
[ROW][C]Trimmed Mean ( 26 / 31 )[/C][C]0.0455208861860465[/C][C]0.00451022124710232[/C][C]10.0928277554659[/C][/ROW]
[ROW][C]Trimmed Mean ( 27 / 31 )[/C][C]0.045262401025641[/C][C]0.00440444306159961[/C][C]10.2765322181739[/C][/ROW]
[ROW][C]Trimmed Mean ( 28 / 31 )[/C][C]0.0451305428378378[/C][C]0.00426118298333034[/C][C]10.5910830429924[/C][/ROW]
[ROW][C]Trimmed Mean ( 29 / 31 )[/C][C]0.0450066499142857[/C][C]0.00406891922600001[/C][C]11.0610821730492[/C][/ROW]
[ROW][C]Trimmed Mean ( 30 / 31 )[/C][C]0.0445889899090909[/C][C]0.00395499051154376[/C][C]11.2741079350116[/C][/ROW]
[ROW][C]Trimmed Mean ( 31 / 31 )[/C][C]0.0440463456774194[/C][C]0.00382605099807538[/C][C]11.5122212692868[/C][/ROW]
[ROW][C]Median[/C][C]0.040526053[/C][C][/C][C][/C][/ROW]
[ROW][C]Midrange[/C][C]0.3465735905[/C][C][/C][C][/C][/ROW]
[ROW][C]Midmean - Weighted Average at Xnp[/C][C]0.0297689492898551[/C][C][/C][C][/C][/ROW]
[ROW][C]Midmean - Weighted Average at X(n+1)p[/C][C]0.0307363504857143[/C][C][/C][C][/C][/ROW]
[ROW][C]Midmean - Empirical Distribution Function[/C][C]0.0307363504857143[/C][C][/C][C][/C][/ROW]
[ROW][C]Midmean - Empirical Distribution Function - Averaging[/C][C]0.0307363504857143[/C][C][/C][C][/C][/ROW]
[ROW][C]Midmean - Empirical Distribution Function - Interpolation[/C][C]0.0307363504857143[/C][C][/C][C][/C][/ROW]
[ROW][C]Midmean - Closest Observation[/C][C]0.0307363504857143[/C][C][/C][C][/C][/ROW]
[ROW][C]Midmean - True Basic - Statistics Graphics Toolkit[/C][C]0.0307363504857143[/C][C][/C][C][/C][/ROW]
[ROW][C]Midmean - MS Excel (old versions)[/C][C]0.0307363504857143[/C][C][/C][C][/C][/ROW]
[ROW][C]Number of observations[/C][C]93[/C][C][/C][C][/C][/ROW]
[/TABLE]
Source: https://freestatistics.org/blog/index.php?pk=277376&T=1

Globally Unique Identifier (entire table): ba.freestatistics.org/blog/index.php?pk=277376&T=1

As an alternative you can also use a QR Code:  

The GUIDs for individual cells are displayed in the table below:

Central Tendency - Ungrouped Data
MeasureValueS.E.Value/S.E.
Arithmetic Mean0.0752146578279570.01120448298632916.71290749601999
Geometric Mean0
Harmonic Mean0
Quadratic Mean0.131175322143088
Winsorized Mean ( 1 / 31 )0.07349468963440860.01026615087574297.15893332603007
Winsorized Mean ( 2 / 31 )0.06793475270967740.008069680257676468.41851852123299
Winsorized Mean ( 3 / 31 )0.06749798029032260.007951046836963978.48919414944561
Winsorized Mean ( 4 / 31 )0.06672284330107530.007752540622293438.60657770811353
Winsorized Mean ( 5 / 31 )0.06650376141935480.007698771815331938.6382299689561
Winsorized Mean ( 6 / 31 )0.06591688612903230.007558070491196158.72139075784145
Winsorized Mean ( 7 / 31 )0.06540035725806450.007437640019883178.79315980381258
Winsorized Mean ( 8 / 31 )0.06484562581720430.007311141085825378.86942613416737
Winsorized Mean ( 9 / 31 )0.06350279291397850.007014659842299269.05286846997895
Winsorized Mean ( 10 / 31 )0.06186146850537630.006669380869186629.27544396080064
Winsorized Mean ( 11 / 31 )0.06052982021505380.006402198977839069.45453592188795
Winsorized Mean ( 12 / 31 )0.05972112163440860.006245192948619329.56273443042488
Winsorized Mean ( 13 / 31 )0.05617066227956990.0055980645031121210.0339433831716
Winsorized Mean ( 14 / 31 )0.05383124376344090.0052134122339549410.325529873283
Winsorized Mean ( 15 / 31 )0.05372771311827960.0051972192176640610.3377808147235
Winsorized Mean ( 16 / 31 )0.05292333926881720.0050734478909937210.4314344812264
Winsorized Mean ( 17 / 31 )0.05222410440860210.0049687019258528710.5106132724269
Winsorized Mean ( 18 / 31 )0.05185363073118280.0049142131671558210.5517666750289
Winsorized Mean ( 19 / 31 )0.05142487387096780.0048519316990732910.5988453796227
Winsorized Mean ( 20 / 31 )0.05090031322580650.004776768660649810.6558045494467
Winsorized Mean ( 21 / 31 )0.04826185358064520.0044149348606447710.9314984487895
Winsorized Mean ( 22 / 31 )0.04759252581720430.0043277555431647710.997045776389
Winsorized Mean ( 23 / 31 )0.04724458379569890.004283156706846511.0303187647045
Winsorized Mean ( 24 / 31 )0.04703099979569890.0042560045461434411.0505050654412
Winsorized Mean ( 25 / 31 )0.04692644253763440.0042427695398665511.0603326663626
Winsorized Mean ( 26 / 31 )0.04682120739784950.0042294820354306911.07019890512
Winsorized Mean ( 27 / 31 )0.0466788131720430.0042115496926805611.0835242554939
Winsorized Mean ( 28 / 31 )0.0464360811720430.0041810916801178811.1062097472911
Winsorized Mean ( 29 / 31 )0.04930450609677420.0035880208043708213.741421464645
Winsorized Mean ( 30 / 31 )0.05001543222580640.0034293737629181914.5844214377048
Winsorized Mean ( 31 / 31 )0.04783781322580640.0030504210014945215.6823642383687
Trimmed Mean ( 1 / 31 )0.06925072524175820.00913465549705367.58109873591787
Trimmed Mean ( 2 / 31 )0.06481602087640450.007677119051339278.44275312691646
Trimmed Mean ( 3 / 31 )0.06314911248275860.007430774738813218.49832146746577
Trimmed Mean ( 4 / 31 )0.06156305481176470.007196110625148748.55504563765544
Trimmed Mean ( 5 / 31 )0.0601176923734940.006992943325164138.59690827997422
Trimmed Mean ( 6 / 31 )0.05865126170370370.006770361711483998.66294360672319
Trimmed Mean ( 7 / 31 )0.05722572779746840.006546658497586968.7412116912103
Trimmed Mean ( 8 / 31 )0.0558152629740260.006312215682507188.84242012336569
Trimmed Mean ( 9 / 31 )0.05441555673333330.006063488931189658.97429802393605
Trimmed Mean ( 10 / 31 )0.0531292356301370.005835305636993449.10479055172696
Trimmed Mean ( 11 / 31 )0.05198543611267610.005638477887412999.21976411909415
Trimmed Mean ( 12 / 31 )0.05093849576811590.005458488513437929.33197819189571
Trimmed Mean ( 13 / 31 )0.05093849576811590.0052734540180989.65941783000284
Trimmed Mean ( 14 / 31 )0.04923493790769230.005177075864082769.51018281367515
Trimmed Mean ( 15 / 31 )0.04875029341269840.005127535256418939.50754913906641
Trimmed Mean ( 16 / 31 )0.04824439173770490.005066903667291429.52147404126484
Trimmed Mean ( 17 / 31 )0.04778343610169490.005011199866298849.53532833983465
Trimmed Mean ( 18 / 31 )0.04735724192982460.004957370146955769.55289609732003
Trimmed Mean ( 19 / 31 )0.04693485389090910.004896566058510099.58525900193619
Trimmed Mean ( 20 / 31 )0.04652018471698110.004828288263046589.63492280960615
Trimmed Mean ( 21 / 31 )0.04612082005882350.004752817445835859.70389049956715
Trimmed Mean ( 22 / 31 )0.04592731557142860.004719245254729479.73191963808233
Trimmed Mean ( 23 / 31 )0.04577754327659570.004685591406108189.76985385813192
Trimmed Mean ( 24 / 31 )0.04564572224444440.004643664584131729.82967684626157
Trimmed Mean ( 25 / 31 )0.04552088618604650.004587609838783849.92257140117085
Trimmed Mean ( 26 / 31 )0.04552088618604650.0045102212471023210.0928277554659
Trimmed Mean ( 27 / 31 )0.0452624010256410.0044044430615996110.2765322181739
Trimmed Mean ( 28 / 31 )0.04513054283783780.0042611829833303410.5910830429924
Trimmed Mean ( 29 / 31 )0.04500664991428570.0040689192260000111.0610821730492
Trimmed Mean ( 30 / 31 )0.04458898990909090.0039549905115437611.2741079350116
Trimmed Mean ( 31 / 31 )0.04404634567741940.0038260509980753811.5122212692868
Median0.040526053
Midrange0.3465735905
Midmean - Weighted Average at Xnp0.0297689492898551
Midmean - Weighted Average at X(n+1)p0.0307363504857143
Midmean - Empirical Distribution Function0.0307363504857143
Midmean - Empirical Distribution Function - Averaging0.0307363504857143
Midmean - Empirical Distribution Function - Interpolation0.0307363504857143
Midmean - Closest Observation0.0307363504857143
Midmean - True Basic - Statistics Graphics Toolkit0.0307363504857143
Midmean - MS Excel (old versions)0.0307363504857143
Number of observations93


Variability - Ungrouped Data
Absolute range0.693147181
Relative range (unbiased)6.41493360213538
Relative range (biased)6.44970314461965
Variance (unbiased)0.0116752608261572
Variance (biased)0.0115497203871663
Standard Deviation (unbiased)0.108052120877645
Standard Deviation (biased)0.107469625416516
Coefficient of Variation (unbiased)1.43658329370851
Coefficient of Variation (biased)1.42883885295786
Mean Squared Error (MSE versus 0)0.0172069651393429
Mean Squared Error (MSE versus Mean)0.0115497203871663
Mean Absolute Deviation from Mean (MAD Mean)0.0704644800360735
Mean Absolute Deviation from Median (MAD Median)0.0662286199462366
Median Absolute Deviation from Mean0.056885776827957
Median Absolute Deviation from Median0.040526053
Mean Squared Deviation from Mean0.0115497203871663
Mean Squared Deviation from Median0.0127530196920765
Interquartile Difference (Weighted Average at Xnp)0.0972801235
Interquartile Difference (Weighted Average at X(n+1)p)0.098190481
Interquartile Difference (Empirical Distribution Function)0.097487033
Interquartile Difference (Empirical Distribution Function - Averaging)0.097487033
Interquartile Difference (Empirical Distribution Function - Interpolation)0.097487033
Interquartile Difference (Closest Observation)0.097487033
Interquartile Difference (True Basic - Statistics Graphics Toolkit)0.098190481
Interquartile Difference (MS Excel (old versions))0.098190481
Semi Interquartile Difference (Weighted Average at Xnp)0.04864006175
Semi Interquartile Difference (Weighted Average at X(n+1)p)0.0490952405
Semi Interquartile Difference (Empirical Distribution Function)0.0487435165
Semi Interquartile Difference (Empirical Distribution Function - Averaging)0.0487435165
Semi Interquartile Difference (Empirical Distribution Function - Interpolation)0.0487435165
Semi Interquartile Difference (Closest Observation)0.0487435165
Semi Interquartile Difference (True Basic - Statistics Graphics Toolkit)0.0490952405
Semi Interquartile Difference (MS Excel (old versions))0.0490952405
Coefficient of Quartile Variation (Weighted Average at Xnp)1
Coefficient of Quartile Variation (Weighted Average at X(n+1)p)1
Coefficient of Quartile Variation (Empirical Distribution Function)1
Coefficient of Quartile Variation (Empirical Distribution Function - Averaging)1
Coefficient of Quartile Variation (Empirical Distribution Function - Interpolation)1
Coefficient of Quartile Variation (Closest Observation)1
Coefficient of Quartile Variation (True Basic - Statistics Graphics Toolkit)1
Coefficient of Quartile Variation (MS Excel (old versions))1
Number of all Pairs of Observations4278
Squared Differences between all Pairs of Observations0.0233505216523145
Mean Absolute Differences between all Pairs of Observations0.0962772943758766
Gini Mean Difference0.0962772943758762
Leik Measure of Dispersion0.269533320436251
Index of Diversity0.967294833680409
Index of Qualitative Variation0.977808907959544
Coefficient of Dispersion1.73874519771451
Observations93

\begin{tabular}{lllllllll}
\hline
Variability - Ungrouped Data \tabularnewline
Absolute range & 0.693147181 \tabularnewline
Relative range (unbiased) & 6.41493360213538 \tabularnewline
Relative range (biased) & 6.44970314461965 \tabularnewline
Variance (unbiased) & 0.0116752608261572 \tabularnewline
Variance (biased) & 0.0115497203871663 \tabularnewline
Standard Deviation (unbiased) & 0.108052120877645 \tabularnewline
Standard Deviation (biased) & 0.107469625416516 \tabularnewline
Coefficient of Variation (unbiased) & 1.43658329370851 \tabularnewline
Coefficient of Variation (biased) & 1.42883885295786 \tabularnewline
Mean Squared Error (MSE versus 0) & 0.0172069651393429 \tabularnewline
Mean Squared Error (MSE versus Mean) & 0.0115497203871663 \tabularnewline
Mean Absolute Deviation from Mean (MAD Mean) & 0.0704644800360735 \tabularnewline
Mean Absolute Deviation from Median (MAD Median) & 0.0662286199462366 \tabularnewline
Median Absolute Deviation from Mean & 0.056885776827957 \tabularnewline
Median Absolute Deviation from Median & 0.040526053 \tabularnewline
Mean Squared Deviation from Mean & 0.0115497203871663 \tabularnewline
Mean Squared Deviation from Median & 0.0127530196920765 \tabularnewline
Interquartile Difference (Weighted Average at Xnp) & 0.0972801235 \tabularnewline
Interquartile Difference (Weighted Average at X(n+1)p) & 0.098190481 \tabularnewline
Interquartile Difference (Empirical Distribution Function) & 0.097487033 \tabularnewline
Interquartile Difference (Empirical Distribution Function - Averaging) & 0.097487033 \tabularnewline
Interquartile Difference (Empirical Distribution Function - Interpolation) & 0.097487033 \tabularnewline
Interquartile Difference (Closest Observation) & 0.097487033 \tabularnewline
Interquartile Difference (True Basic - Statistics Graphics Toolkit) & 0.098190481 \tabularnewline
Interquartile Difference (MS Excel (old versions)) & 0.098190481 \tabularnewline
Semi Interquartile Difference (Weighted Average at Xnp) & 0.04864006175 \tabularnewline
Semi Interquartile Difference (Weighted Average at X(n+1)p) & 0.0490952405 \tabularnewline
Semi Interquartile Difference (Empirical Distribution Function) & 0.0487435165 \tabularnewline
Semi Interquartile Difference (Empirical Distribution Function - Averaging) & 0.0487435165 \tabularnewline
Semi Interquartile Difference (Empirical Distribution Function - Interpolation) & 0.0487435165 \tabularnewline
Semi Interquartile Difference (Closest Observation) & 0.0487435165 \tabularnewline
Semi Interquartile Difference (True Basic - Statistics Graphics Toolkit) & 0.0490952405 \tabularnewline
Semi Interquartile Difference (MS Excel (old versions)) & 0.0490952405 \tabularnewline
Coefficient of Quartile Variation (Weighted Average at Xnp) & 1 \tabularnewline
Coefficient of Quartile Variation (Weighted Average at X(n+1)p) & 1 \tabularnewline
Coefficient of Quartile Variation (Empirical Distribution Function) & 1 \tabularnewline
Coefficient of Quartile Variation (Empirical Distribution Function - Averaging) & 1 \tabularnewline
Coefficient of Quartile Variation (Empirical Distribution Function - Interpolation) & 1 \tabularnewline
Coefficient of Quartile Variation (Closest Observation) & 1 \tabularnewline
Coefficient of Quartile Variation (True Basic - Statistics Graphics Toolkit) & 1 \tabularnewline
Coefficient of Quartile Variation (MS Excel (old versions)) & 1 \tabularnewline
Number of all Pairs of Observations & 4278 \tabularnewline
Squared Differences between all Pairs of Observations & 0.0233505216523145 \tabularnewline
Mean Absolute Differences between all Pairs of Observations & 0.0962772943758766 \tabularnewline
Gini Mean Difference & 0.0962772943758762 \tabularnewline
Leik Measure of Dispersion & 0.269533320436251 \tabularnewline
Index of Diversity & 0.967294833680409 \tabularnewline
Index of Qualitative Variation & 0.977808907959544 \tabularnewline
Coefficient of Dispersion & 1.73874519771451 \tabularnewline
Observations & 93 \tabularnewline
\hline
\end{tabular}
%Source: https://freestatistics.org/blog/index.php?pk=277376&T=2

[TABLE]
[ROW][C]Variability - Ungrouped Data[/C][/ROW]
[ROW][C]Absolute range[/C][C]0.693147181[/C][/ROW]
[ROW][C]Relative range (unbiased)[/C][C]6.41493360213538[/C][/ROW]
[ROW][C]Relative range (biased)[/C][C]6.44970314461965[/C][/ROW]
[ROW][C]Variance (unbiased)[/C][C]0.0116752608261572[/C][/ROW]
[ROW][C]Variance (biased)[/C][C]0.0115497203871663[/C][/ROW]
[ROW][C]Standard Deviation (unbiased)[/C][C]0.108052120877645[/C][/ROW]
[ROW][C]Standard Deviation (biased)[/C][C]0.107469625416516[/C][/ROW]
[ROW][C]Coefficient of Variation (unbiased)[/C][C]1.43658329370851[/C][/ROW]
[ROW][C]Coefficient of Variation (biased)[/C][C]1.42883885295786[/C][/ROW]
[ROW][C]Mean Squared Error (MSE versus 0)[/C][C]0.0172069651393429[/C][/ROW]
[ROW][C]Mean Squared Error (MSE versus Mean)[/C][C]0.0115497203871663[/C][/ROW]
[ROW][C]Mean Absolute Deviation from Mean (MAD Mean)[/C][C]0.0704644800360735[/C][/ROW]
[ROW][C]Mean Absolute Deviation from Median (MAD Median)[/C][C]0.0662286199462366[/C][/ROW]
[ROW][C]Median Absolute Deviation from Mean[/C][C]0.056885776827957[/C][/ROW]
[ROW][C]Median Absolute Deviation from Median[/C][C]0.040526053[/C][/ROW]
[ROW][C]Mean Squared Deviation from Mean[/C][C]0.0115497203871663[/C][/ROW]
[ROW][C]Mean Squared Deviation from Median[/C][C]0.0127530196920765[/C][/ROW]
[ROW][C]Interquartile Difference (Weighted Average at Xnp)[/C][C]0.0972801235[/C][/ROW]
[ROW][C]Interquartile Difference (Weighted Average at X(n+1)p)[/C][C]0.098190481[/C][/ROW]
[ROW][C]Interquartile Difference (Empirical Distribution Function)[/C][C]0.097487033[/C][/ROW]
[ROW][C]Interquartile Difference (Empirical Distribution Function - Averaging)[/C][C]0.097487033[/C][/ROW]
[ROW][C]Interquartile Difference (Empirical Distribution Function - Interpolation)[/C][C]0.097487033[/C][/ROW]
[ROW][C]Interquartile Difference (Closest Observation)[/C][C]0.097487033[/C][/ROW]
[ROW][C]Interquartile Difference (True Basic - Statistics Graphics Toolkit)[/C][C]0.098190481[/C][/ROW]
[ROW][C]Interquartile Difference (MS Excel (old versions))[/C][C]0.098190481[/C][/ROW]
[ROW][C]Semi Interquartile Difference (Weighted Average at Xnp)[/C][C]0.04864006175[/C][/ROW]
[ROW][C]Semi Interquartile Difference (Weighted Average at X(n+1)p)[/C][C]0.0490952405[/C][/ROW]
[ROW][C]Semi Interquartile Difference (Empirical Distribution Function)[/C][C]0.0487435165[/C][/ROW]
[ROW][C]Semi Interquartile Difference (Empirical Distribution Function - Averaging)[/C][C]0.0487435165[/C][/ROW]
[ROW][C]Semi Interquartile Difference (Empirical Distribution Function - Interpolation)[/C][C]0.0487435165[/C][/ROW]
[ROW][C]Semi Interquartile Difference (Closest Observation)[/C][C]0.0487435165[/C][/ROW]
[ROW][C]Semi Interquartile Difference (True Basic - Statistics Graphics Toolkit)[/C][C]0.0490952405[/C][/ROW]
[ROW][C]Semi Interquartile Difference (MS Excel (old versions))[/C][C]0.0490952405[/C][/ROW]
[ROW][C]Coefficient of Quartile Variation (Weighted Average at Xnp)[/C][C]1[/C][/ROW]
[ROW][C]Coefficient of Quartile Variation (Weighted Average at X(n+1)p)[/C][C]1[/C][/ROW]
[ROW][C]Coefficient of Quartile Variation (Empirical Distribution Function)[/C][C]1[/C][/ROW]
[ROW][C]Coefficient of Quartile Variation (Empirical Distribution Function - Averaging)[/C][C]1[/C][/ROW]
[ROW][C]Coefficient of Quartile Variation (Empirical Distribution Function - Interpolation)[/C][C]1[/C][/ROW]
[ROW][C]Coefficient of Quartile Variation (Closest Observation)[/C][C]1[/C][/ROW]
[ROW][C]Coefficient of Quartile Variation (True Basic - Statistics Graphics Toolkit)[/C][C]1[/C][/ROW]
[ROW][C]Coefficient of Quartile Variation (MS Excel (old versions))[/C][C]1[/C][/ROW]
[ROW][C]Number of all Pairs of Observations[/C][C]4278[/C][/ROW]
[ROW][C]Squared Differences between all Pairs of Observations[/C][C]0.0233505216523145[/C][/ROW]
[ROW][C]Mean Absolute Differences between all Pairs of Observations[/C][C]0.0962772943758766[/C][/ROW]
[ROW][C]Gini Mean Difference[/C][C]0.0962772943758762[/C][/ROW]
[ROW][C]Leik Measure of Dispersion[/C][C]0.269533320436251[/C][/ROW]
[ROW][C]Index of Diversity[/C][C]0.967294833680409[/C][/ROW]
[ROW][C]Index of Qualitative Variation[/C][C]0.977808907959544[/C][/ROW]
[ROW][C]Coefficient of Dispersion[/C][C]1.73874519771451[/C][/ROW]
[ROW][C]Observations[/C][C]93[/C][/ROW]
[/TABLE]
Source: https://freestatistics.org/blog/index.php?pk=277376&T=2

Globally Unique Identifier (entire table): ba.freestatistics.org/blog/index.php?pk=277376&T=2

As an alternative you can also use a QR Code:  

The GUIDs for individual cells are displayed in the table below:

Variability - Ungrouped Data
Absolute range0.693147181
Relative range (unbiased)6.41493360213538
Relative range (biased)6.44970314461965
Variance (unbiased)0.0116752608261572
Variance (biased)0.0115497203871663
Standard Deviation (unbiased)0.108052120877645
Standard Deviation (biased)0.107469625416516
Coefficient of Variation (unbiased)1.43658329370851
Coefficient of Variation (biased)1.42883885295786
Mean Squared Error (MSE versus 0)0.0172069651393429
Mean Squared Error (MSE versus Mean)0.0115497203871663
Mean Absolute Deviation from Mean (MAD Mean)0.0704644800360735
Mean Absolute Deviation from Median (MAD Median)0.0662286199462366
Median Absolute Deviation from Mean0.056885776827957
Median Absolute Deviation from Median0.040526053
Mean Squared Deviation from Mean0.0115497203871663
Mean Squared Deviation from Median0.0127530196920765
Interquartile Difference (Weighted Average at Xnp)0.0972801235
Interquartile Difference (Weighted Average at X(n+1)p)0.098190481
Interquartile Difference (Empirical Distribution Function)0.097487033
Interquartile Difference (Empirical Distribution Function - Averaging)0.097487033
Interquartile Difference (Empirical Distribution Function - Interpolation)0.097487033
Interquartile Difference (Closest Observation)0.097487033
Interquartile Difference (True Basic - Statistics Graphics Toolkit)0.098190481
Interquartile Difference (MS Excel (old versions))0.098190481
Semi Interquartile Difference (Weighted Average at Xnp)0.04864006175
Semi Interquartile Difference (Weighted Average at X(n+1)p)0.0490952405
Semi Interquartile Difference (Empirical Distribution Function)0.0487435165
Semi Interquartile Difference (Empirical Distribution Function - Averaging)0.0487435165
Semi Interquartile Difference (Empirical Distribution Function - Interpolation)0.0487435165
Semi Interquartile Difference (Closest Observation)0.0487435165
Semi Interquartile Difference (True Basic - Statistics Graphics Toolkit)0.0490952405
Semi Interquartile Difference (MS Excel (old versions))0.0490952405
Coefficient of Quartile Variation (Weighted Average at Xnp)1
Coefficient of Quartile Variation (Weighted Average at X(n+1)p)1
Coefficient of Quartile Variation (Empirical Distribution Function)1
Coefficient of Quartile Variation (Empirical Distribution Function - Averaging)1
Coefficient of Quartile Variation (Empirical Distribution Function - Interpolation)1
Coefficient of Quartile Variation (Closest Observation)1
Coefficient of Quartile Variation (True Basic - Statistics Graphics Toolkit)1
Coefficient of Quartile Variation (MS Excel (old versions))1
Number of all Pairs of Observations4278
Squared Differences between all Pairs of Observations0.0233505216523145
Mean Absolute Differences between all Pairs of Observations0.0962772943758766
Gini Mean Difference0.0962772943758762
Leik Measure of Dispersion0.269533320436251
Index of Diversity0.967294833680409
Index of Qualitative Variation0.977808907959544
Coefficient of Dispersion1.73874519771451
Observations93


Percentiles - Ungrouped Data
pWeighted Average at XnpWeighted Average at X(n+1)pEmpirical Distribution FunctionEmpirical Distribution Function - AveragingEmpirical Distribution Function - InterpolationClosest ObservationTrue Basic - Statistics Graphics ToolkitMS Excel (old versions)
0.0200000000
0.0400000000
0.0600000000
0.0800000000
0.100000000
0.1200000000
0.1400000000
0.1600000000
0.1800000000
0.200000000
0.2200000000
0.2400000000
0.2600000000
0.2800000000
0.300000000
0.320.0096030.0128960.0126350.0126350.014070.0126350.0156360.012635
0.340.0167490.0172170.0172720.0172720.0175680.0172720.0159520.017272
0.360.0187540.0190730.0192150.0192150.0192750.0183290.0184710.019215
0.380.020080.020490.0207930.0207930.020750.0197120.0200150.020793
0.40.0220970.0221420.0221860.0221860.0221640.0220750.0221190.022186
0.420.0229420.0240060.0253220.0253220.0244110.022790.0241070.02279
0.440.0278220.0283780.0280390.0280390.0284910.0280390.0286410.028039
0.460.0293690.0295150.0294790.0294790.0295270.0294790.0295930.029479
0.480.0313810.0324260.0323660.0323660.0324460.0323660.0328070.032366
0.50.0366970.0405260.0405260.0405260.0405260.0405260.0405260.040526
0.520.0459880.0487980.0494470.0494470.0485820.0440430.0446920.049447
0.540.0513550.0529280.0536260.0536260.0526950.0507140.0514130.053626
0.560.0578930.0588090.0593980.0593980.0586130.0577620.0583510.059398
0.580.0614520.062360.0615840.0615840.0621210.0615840.06230.063077
0.60.0681640.0696890.0694350.0694350.0695620.0694350.0698150.069435
0.620.0709040.0717940.0713350.0713350.0714010.0713350.0725160.071335
0.640.0738730.0748280.0747020.0747020.0744950.0747020.0753660.074702
0.660.0780390.0825110.0821950.0821950.0803180.0754930.0897870.082195
0.680.0903570.0910760.0911610.0911610.0906960.0901030.0901880.091161
0.70.0946780.0952420.0954040.0954040.094920.0945970.0947590.095404
0.720.0958740.096150.0958940.0958940.0959840.0958940.0960140.09627
0.740.0965890.0971230.0966590.0966590.0967260.0966590.0970240.097487
0.760.0984440.1001390.0988940.0988940.0987810.0988940.1004780.098894
0.780.1080330.1141890.1134080.1134080.1106040.1134080.1150670.113408
0.80.1166870.1183290.1179460.1179460.1171060.1158470.1194770.117946
0.820.1208540.1240590.1236850.1236850.1215430.119860.1279870.123685
0.840.1284380.1289770.1290020.1290020.128540.1283610.1283860.129002
0.860.1442320.1658780.1445430.1445430.1475910.1445430.1486070.169942
0.880.1752070.1843160.176210.176210.1759590.176210.1793620.187468
0.90.1981530.2110580.2027330.2027330.199680.2027330.2082830.216608
0.920.220220.2263510.2230570.2230570.2207360.2230570.2266260.223057
0.940.233740.2404830.2390160.2390160.2342860.229920.2416240.239016
0.960.2481370.2643630.2611130.2611130.2488580.2430910.2714030.261113
0.980.3108480.5523850.533190.533190.3160190.2746530.6739520.53319

\begin{tabular}{lllllllll}
\hline
Percentiles - Ungrouped Data \tabularnewline
p & Weighted Average at Xnp & Weighted Average at X(n+1)p & Empirical Distribution Function & Empirical Distribution Function - Averaging & Empirical Distribution Function - Interpolation & Closest Observation & True Basic - Statistics Graphics Toolkit & MS Excel (old versions) \tabularnewline
0.02 & 0 & 0 & 0 & 0 & 0 & 0 & 0 & 0 \tabularnewline
0.04 & 0 & 0 & 0 & 0 & 0 & 0 & 0 & 0 \tabularnewline
0.06 & 0 & 0 & 0 & 0 & 0 & 0 & 0 & 0 \tabularnewline
0.08 & 0 & 0 & 0 & 0 & 0 & 0 & 0 & 0 \tabularnewline
0.1 & 0 & 0 & 0 & 0 & 0 & 0 & 0 & 0 \tabularnewline
0.12 & 0 & 0 & 0 & 0 & 0 & 0 & 0 & 0 \tabularnewline
0.14 & 0 & 0 & 0 & 0 & 0 & 0 & 0 & 0 \tabularnewline
0.16 & 0 & 0 & 0 & 0 & 0 & 0 & 0 & 0 \tabularnewline
0.18 & 0 & 0 & 0 & 0 & 0 & 0 & 0 & 0 \tabularnewline
0.2 & 0 & 0 & 0 & 0 & 0 & 0 & 0 & 0 \tabularnewline
0.22 & 0 & 0 & 0 & 0 & 0 & 0 & 0 & 0 \tabularnewline
0.24 & 0 & 0 & 0 & 0 & 0 & 0 & 0 & 0 \tabularnewline
0.26 & 0 & 0 & 0 & 0 & 0 & 0 & 0 & 0 \tabularnewline
0.28 & 0 & 0 & 0 & 0 & 0 & 0 & 0 & 0 \tabularnewline
0.3 & 0 & 0 & 0 & 0 & 0 & 0 & 0 & 0 \tabularnewline
0.32 & 0.009603 & 0.012896 & 0.012635 & 0.012635 & 0.01407 & 0.012635 & 0.015636 & 0.012635 \tabularnewline
0.34 & 0.016749 & 0.017217 & 0.017272 & 0.017272 & 0.017568 & 0.017272 & 0.015952 & 0.017272 \tabularnewline
0.36 & 0.018754 & 0.019073 & 0.019215 & 0.019215 & 0.019275 & 0.018329 & 0.018471 & 0.019215 \tabularnewline
0.38 & 0.02008 & 0.02049 & 0.020793 & 0.020793 & 0.02075 & 0.019712 & 0.020015 & 0.020793 \tabularnewline
0.4 & 0.022097 & 0.022142 & 0.022186 & 0.022186 & 0.022164 & 0.022075 & 0.022119 & 0.022186 \tabularnewline
0.42 & 0.022942 & 0.024006 & 0.025322 & 0.025322 & 0.024411 & 0.02279 & 0.024107 & 0.02279 \tabularnewline
0.44 & 0.027822 & 0.028378 & 0.028039 & 0.028039 & 0.028491 & 0.028039 & 0.028641 & 0.028039 \tabularnewline
0.46 & 0.029369 & 0.029515 & 0.029479 & 0.029479 & 0.029527 & 0.029479 & 0.029593 & 0.029479 \tabularnewline
0.48 & 0.031381 & 0.032426 & 0.032366 & 0.032366 & 0.032446 & 0.032366 & 0.032807 & 0.032366 \tabularnewline
0.5 & 0.036697 & 0.040526 & 0.040526 & 0.040526 & 0.040526 & 0.040526 & 0.040526 & 0.040526 \tabularnewline
0.52 & 0.045988 & 0.048798 & 0.049447 & 0.049447 & 0.048582 & 0.044043 & 0.044692 & 0.049447 \tabularnewline
0.54 & 0.051355 & 0.052928 & 0.053626 & 0.053626 & 0.052695 & 0.050714 & 0.051413 & 0.053626 \tabularnewline
0.56 & 0.057893 & 0.058809 & 0.059398 & 0.059398 & 0.058613 & 0.057762 & 0.058351 & 0.059398 \tabularnewline
0.58 & 0.061452 & 0.06236 & 0.061584 & 0.061584 & 0.062121 & 0.061584 & 0.0623 & 0.063077 \tabularnewline
0.6 & 0.068164 & 0.069689 & 0.069435 & 0.069435 & 0.069562 & 0.069435 & 0.069815 & 0.069435 \tabularnewline
0.62 & 0.070904 & 0.071794 & 0.071335 & 0.071335 & 0.071401 & 0.071335 & 0.072516 & 0.071335 \tabularnewline
0.64 & 0.073873 & 0.074828 & 0.074702 & 0.074702 & 0.074495 & 0.074702 & 0.075366 & 0.074702 \tabularnewline
0.66 & 0.078039 & 0.082511 & 0.082195 & 0.082195 & 0.080318 & 0.075493 & 0.089787 & 0.082195 \tabularnewline
0.68 & 0.090357 & 0.091076 & 0.091161 & 0.091161 & 0.090696 & 0.090103 & 0.090188 & 0.091161 \tabularnewline
0.7 & 0.094678 & 0.095242 & 0.095404 & 0.095404 & 0.09492 & 0.094597 & 0.094759 & 0.095404 \tabularnewline
0.72 & 0.095874 & 0.09615 & 0.095894 & 0.095894 & 0.095984 & 0.095894 & 0.096014 & 0.09627 \tabularnewline
0.74 & 0.096589 & 0.097123 & 0.096659 & 0.096659 & 0.096726 & 0.096659 & 0.097024 & 0.097487 \tabularnewline
0.76 & 0.098444 & 0.100139 & 0.098894 & 0.098894 & 0.098781 & 0.098894 & 0.100478 & 0.098894 \tabularnewline
0.78 & 0.108033 & 0.114189 & 0.113408 & 0.113408 & 0.110604 & 0.113408 & 0.115067 & 0.113408 \tabularnewline
0.8 & 0.116687 & 0.118329 & 0.117946 & 0.117946 & 0.117106 & 0.115847 & 0.119477 & 0.117946 \tabularnewline
0.82 & 0.120854 & 0.124059 & 0.123685 & 0.123685 & 0.121543 & 0.11986 & 0.127987 & 0.123685 \tabularnewline
0.84 & 0.128438 & 0.128977 & 0.129002 & 0.129002 & 0.12854 & 0.128361 & 0.128386 & 0.129002 \tabularnewline
0.86 & 0.144232 & 0.165878 & 0.144543 & 0.144543 & 0.147591 & 0.144543 & 0.148607 & 0.169942 \tabularnewline
0.88 & 0.175207 & 0.184316 & 0.17621 & 0.17621 & 0.175959 & 0.17621 & 0.179362 & 0.187468 \tabularnewline
0.9 & 0.198153 & 0.211058 & 0.202733 & 0.202733 & 0.19968 & 0.202733 & 0.208283 & 0.216608 \tabularnewline
0.92 & 0.22022 & 0.226351 & 0.223057 & 0.223057 & 0.220736 & 0.223057 & 0.226626 & 0.223057 \tabularnewline
0.94 & 0.23374 & 0.240483 & 0.239016 & 0.239016 & 0.234286 & 0.22992 & 0.241624 & 0.239016 \tabularnewline
0.96 & 0.248137 & 0.264363 & 0.261113 & 0.261113 & 0.248858 & 0.243091 & 0.271403 & 0.261113 \tabularnewline
0.98 & 0.310848 & 0.552385 & 0.53319 & 0.53319 & 0.316019 & 0.274653 & 0.673952 & 0.53319 \tabularnewline
\hline
\end{tabular}
%Source: https://freestatistics.org/blog/index.php?pk=277376&T=3

[TABLE]
[ROW][C]Percentiles - Ungrouped Data[/C][/ROW]
[ROW][C]p[/C][C]Weighted Average at Xnp[/C][C]Weighted Average at X(n+1)p[/C][C]Empirical Distribution Function[/C][C]Empirical Distribution Function - Averaging[/C][C]Empirical Distribution Function - Interpolation[/C][C]Closest Observation[/C][C]True Basic - Statistics Graphics Toolkit[/C][C]MS Excel (old versions)[/C][/ROW]
[ROW][C]0.02[/C][C]0[/C][C]0[/C][C]0[/C][C]0[/C][C]0[/C][C]0[/C][C]0[/C][C]0[/C][/ROW]
[ROW][C]0.04[/C][C]0[/C][C]0[/C][C]0[/C][C]0[/C][C]0[/C][C]0[/C][C]0[/C][C]0[/C][/ROW]
[ROW][C]0.06[/C][C]0[/C][C]0[/C][C]0[/C][C]0[/C][C]0[/C][C]0[/C][C]0[/C][C]0[/C][/ROW]
[ROW][C]0.08[/C][C]0[/C][C]0[/C][C]0[/C][C]0[/C][C]0[/C][C]0[/C][C]0[/C][C]0[/C][/ROW]
[ROW][C]0.1[/C][C]0[/C][C]0[/C][C]0[/C][C]0[/C][C]0[/C][C]0[/C][C]0[/C][C]0[/C][/ROW]
[ROW][C]0.12[/C][C]0[/C][C]0[/C][C]0[/C][C]0[/C][C]0[/C][C]0[/C][C]0[/C][C]0[/C][/ROW]
[ROW][C]0.14[/C][C]0[/C][C]0[/C][C]0[/C][C]0[/C][C]0[/C][C]0[/C][C]0[/C][C]0[/C][/ROW]
[ROW][C]0.16[/C][C]0[/C][C]0[/C][C]0[/C][C]0[/C][C]0[/C][C]0[/C][C]0[/C][C]0[/C][/ROW]
[ROW][C]0.18[/C][C]0[/C][C]0[/C][C]0[/C][C]0[/C][C]0[/C][C]0[/C][C]0[/C][C]0[/C][/ROW]
[ROW][C]0.2[/C][C]0[/C][C]0[/C][C]0[/C][C]0[/C][C]0[/C][C]0[/C][C]0[/C][C]0[/C][/ROW]
[ROW][C]0.22[/C][C]0[/C][C]0[/C][C]0[/C][C]0[/C][C]0[/C][C]0[/C][C]0[/C][C]0[/C][/ROW]
[ROW][C]0.24[/C][C]0[/C][C]0[/C][C]0[/C][C]0[/C][C]0[/C][C]0[/C][C]0[/C][C]0[/C][/ROW]
[ROW][C]0.26[/C][C]0[/C][C]0[/C][C]0[/C][C]0[/C][C]0[/C][C]0[/C][C]0[/C][C]0[/C][/ROW]
[ROW][C]0.28[/C][C]0[/C][C]0[/C][C]0[/C][C]0[/C][C]0[/C][C]0[/C][C]0[/C][C]0[/C][/ROW]
[ROW][C]0.3[/C][C]0[/C][C]0[/C][C]0[/C][C]0[/C][C]0[/C][C]0[/C][C]0[/C][C]0[/C][/ROW]
[ROW][C]0.32[/C][C]0.009603[/C][C]0.012896[/C][C]0.012635[/C][C]0.012635[/C][C]0.01407[/C][C]0.012635[/C][C]0.015636[/C][C]0.012635[/C][/ROW]
[ROW][C]0.34[/C][C]0.016749[/C][C]0.017217[/C][C]0.017272[/C][C]0.017272[/C][C]0.017568[/C][C]0.017272[/C][C]0.015952[/C][C]0.017272[/C][/ROW]
[ROW][C]0.36[/C][C]0.018754[/C][C]0.019073[/C][C]0.019215[/C][C]0.019215[/C][C]0.019275[/C][C]0.018329[/C][C]0.018471[/C][C]0.019215[/C][/ROW]
[ROW][C]0.38[/C][C]0.02008[/C][C]0.02049[/C][C]0.020793[/C][C]0.020793[/C][C]0.02075[/C][C]0.019712[/C][C]0.020015[/C][C]0.020793[/C][/ROW]
[ROW][C]0.4[/C][C]0.022097[/C][C]0.022142[/C][C]0.022186[/C][C]0.022186[/C][C]0.022164[/C][C]0.022075[/C][C]0.022119[/C][C]0.022186[/C][/ROW]
[ROW][C]0.42[/C][C]0.022942[/C][C]0.024006[/C][C]0.025322[/C][C]0.025322[/C][C]0.024411[/C][C]0.02279[/C][C]0.024107[/C][C]0.02279[/C][/ROW]
[ROW][C]0.44[/C][C]0.027822[/C][C]0.028378[/C][C]0.028039[/C][C]0.028039[/C][C]0.028491[/C][C]0.028039[/C][C]0.028641[/C][C]0.028039[/C][/ROW]
[ROW][C]0.46[/C][C]0.029369[/C][C]0.029515[/C][C]0.029479[/C][C]0.029479[/C][C]0.029527[/C][C]0.029479[/C][C]0.029593[/C][C]0.029479[/C][/ROW]
[ROW][C]0.48[/C][C]0.031381[/C][C]0.032426[/C][C]0.032366[/C][C]0.032366[/C][C]0.032446[/C][C]0.032366[/C][C]0.032807[/C][C]0.032366[/C][/ROW]
[ROW][C]0.5[/C][C]0.036697[/C][C]0.040526[/C][C]0.040526[/C][C]0.040526[/C][C]0.040526[/C][C]0.040526[/C][C]0.040526[/C][C]0.040526[/C][/ROW]
[ROW][C]0.52[/C][C]0.045988[/C][C]0.048798[/C][C]0.049447[/C][C]0.049447[/C][C]0.048582[/C][C]0.044043[/C][C]0.044692[/C][C]0.049447[/C][/ROW]
[ROW][C]0.54[/C][C]0.051355[/C][C]0.052928[/C][C]0.053626[/C][C]0.053626[/C][C]0.052695[/C][C]0.050714[/C][C]0.051413[/C][C]0.053626[/C][/ROW]
[ROW][C]0.56[/C][C]0.057893[/C][C]0.058809[/C][C]0.059398[/C][C]0.059398[/C][C]0.058613[/C][C]0.057762[/C][C]0.058351[/C][C]0.059398[/C][/ROW]
[ROW][C]0.58[/C][C]0.061452[/C][C]0.06236[/C][C]0.061584[/C][C]0.061584[/C][C]0.062121[/C][C]0.061584[/C][C]0.0623[/C][C]0.063077[/C][/ROW]
[ROW][C]0.6[/C][C]0.068164[/C][C]0.069689[/C][C]0.069435[/C][C]0.069435[/C][C]0.069562[/C][C]0.069435[/C][C]0.069815[/C][C]0.069435[/C][/ROW]
[ROW][C]0.62[/C][C]0.070904[/C][C]0.071794[/C][C]0.071335[/C][C]0.071335[/C][C]0.071401[/C][C]0.071335[/C][C]0.072516[/C][C]0.071335[/C][/ROW]
[ROW][C]0.64[/C][C]0.073873[/C][C]0.074828[/C][C]0.074702[/C][C]0.074702[/C][C]0.074495[/C][C]0.074702[/C][C]0.075366[/C][C]0.074702[/C][/ROW]
[ROW][C]0.66[/C][C]0.078039[/C][C]0.082511[/C][C]0.082195[/C][C]0.082195[/C][C]0.080318[/C][C]0.075493[/C][C]0.089787[/C][C]0.082195[/C][/ROW]
[ROW][C]0.68[/C][C]0.090357[/C][C]0.091076[/C][C]0.091161[/C][C]0.091161[/C][C]0.090696[/C][C]0.090103[/C][C]0.090188[/C][C]0.091161[/C][/ROW]
[ROW][C]0.7[/C][C]0.094678[/C][C]0.095242[/C][C]0.095404[/C][C]0.095404[/C][C]0.09492[/C][C]0.094597[/C][C]0.094759[/C][C]0.095404[/C][/ROW]
[ROW][C]0.72[/C][C]0.095874[/C][C]0.09615[/C][C]0.095894[/C][C]0.095894[/C][C]0.095984[/C][C]0.095894[/C][C]0.096014[/C][C]0.09627[/C][/ROW]
[ROW][C]0.74[/C][C]0.096589[/C][C]0.097123[/C][C]0.096659[/C][C]0.096659[/C][C]0.096726[/C][C]0.096659[/C][C]0.097024[/C][C]0.097487[/C][/ROW]
[ROW][C]0.76[/C][C]0.098444[/C][C]0.100139[/C][C]0.098894[/C][C]0.098894[/C][C]0.098781[/C][C]0.098894[/C][C]0.100478[/C][C]0.098894[/C][/ROW]
[ROW][C]0.78[/C][C]0.108033[/C][C]0.114189[/C][C]0.113408[/C][C]0.113408[/C][C]0.110604[/C][C]0.113408[/C][C]0.115067[/C][C]0.113408[/C][/ROW]
[ROW][C]0.8[/C][C]0.116687[/C][C]0.118329[/C][C]0.117946[/C][C]0.117946[/C][C]0.117106[/C][C]0.115847[/C][C]0.119477[/C][C]0.117946[/C][/ROW]
[ROW][C]0.82[/C][C]0.120854[/C][C]0.124059[/C][C]0.123685[/C][C]0.123685[/C][C]0.121543[/C][C]0.11986[/C][C]0.127987[/C][C]0.123685[/C][/ROW]
[ROW][C]0.84[/C][C]0.128438[/C][C]0.128977[/C][C]0.129002[/C][C]0.129002[/C][C]0.12854[/C][C]0.128361[/C][C]0.128386[/C][C]0.129002[/C][/ROW]
[ROW][C]0.86[/C][C]0.144232[/C][C]0.165878[/C][C]0.144543[/C][C]0.144543[/C][C]0.147591[/C][C]0.144543[/C][C]0.148607[/C][C]0.169942[/C][/ROW]
[ROW][C]0.88[/C][C]0.175207[/C][C]0.184316[/C][C]0.17621[/C][C]0.17621[/C][C]0.175959[/C][C]0.17621[/C][C]0.179362[/C][C]0.187468[/C][/ROW]
[ROW][C]0.9[/C][C]0.198153[/C][C]0.211058[/C][C]0.202733[/C][C]0.202733[/C][C]0.19968[/C][C]0.202733[/C][C]0.208283[/C][C]0.216608[/C][/ROW]
[ROW][C]0.92[/C][C]0.22022[/C][C]0.226351[/C][C]0.223057[/C][C]0.223057[/C][C]0.220736[/C][C]0.223057[/C][C]0.226626[/C][C]0.223057[/C][/ROW]
[ROW][C]0.94[/C][C]0.23374[/C][C]0.240483[/C][C]0.239016[/C][C]0.239016[/C][C]0.234286[/C][C]0.22992[/C][C]0.241624[/C][C]0.239016[/C][/ROW]
[ROW][C]0.96[/C][C]0.248137[/C][C]0.264363[/C][C]0.261113[/C][C]0.261113[/C][C]0.248858[/C][C]0.243091[/C][C]0.271403[/C][C]0.261113[/C][/ROW]
[ROW][C]0.98[/C][C]0.310848[/C][C]0.552385[/C][C]0.53319[/C][C]0.53319[/C][C]0.316019[/C][C]0.274653[/C][C]0.673952[/C][C]0.53319[/C][/ROW]
[/TABLE]
Source: https://freestatistics.org/blog/index.php?pk=277376&T=3

Globally Unique Identifier (entire table): ba.freestatistics.org/blog/index.php?pk=277376&T=3

As an alternative you can also use a QR Code:  

The GUIDs for individual cells are displayed in the table below:

Percentiles - Ungrouped Data
pWeighted Average at XnpWeighted Average at X(n+1)pEmpirical Distribution FunctionEmpirical Distribution Function - AveragingEmpirical Distribution Function - InterpolationClosest ObservationTrue Basic - Statistics Graphics ToolkitMS Excel (old versions)
0.0200000000
0.0400000000
0.0600000000
0.0800000000
0.100000000
0.1200000000
0.1400000000
0.1600000000
0.1800000000
0.200000000
0.2200000000
0.2400000000
0.2600000000
0.2800000000
0.300000000
0.320.0096030.0128960.0126350.0126350.014070.0126350.0156360.012635
0.340.0167490.0172170.0172720.0172720.0175680.0172720.0159520.017272
0.360.0187540.0190730.0192150.0192150.0192750.0183290.0184710.019215
0.380.020080.020490.0207930.0207930.020750.0197120.0200150.020793
0.40.0220970.0221420.0221860.0221860.0221640.0220750.0221190.022186
0.420.0229420.0240060.0253220.0253220.0244110.022790.0241070.02279
0.440.0278220.0283780.0280390.0280390.0284910.0280390.0286410.028039
0.460.0293690.0295150.0294790.0294790.0295270.0294790.0295930.029479
0.480.0313810.0324260.0323660.0323660.0324460.0323660.0328070.032366
0.50.0366970.0405260.0405260.0405260.0405260.0405260.0405260.040526
0.520.0459880.0487980.0494470.0494470.0485820.0440430.0446920.049447
0.540.0513550.0529280.0536260.0536260.0526950.0507140.0514130.053626
0.560.0578930.0588090.0593980.0593980.0586130.0577620.0583510.059398
0.580.0614520.062360.0615840.0615840.0621210.0615840.06230.063077
0.60.0681640.0696890.0694350.0694350.0695620.0694350.0698150.069435
0.620.0709040.0717940.0713350.0713350.0714010.0713350.0725160.071335
0.640.0738730.0748280.0747020.0747020.0744950.0747020.0753660.074702
0.660.0780390.0825110.0821950.0821950.0803180.0754930.0897870.082195
0.680.0903570.0910760.0911610.0911610.0906960.0901030.0901880.091161
0.70.0946780.0952420.0954040.0954040.094920.0945970.0947590.095404
0.720.0958740.096150.0958940.0958940.0959840.0958940.0960140.09627
0.740.0965890.0971230.0966590.0966590.0967260.0966590.0970240.097487
0.760.0984440.1001390.0988940.0988940.0987810.0988940.1004780.098894
0.780.1080330.1141890.1134080.1134080.1106040.1134080.1150670.113408
0.80.1166870.1183290.1179460.1179460.1171060.1158470.1194770.117946
0.820.1208540.1240590.1236850.1236850.1215430.119860.1279870.123685
0.840.1284380.1289770.1290020.1290020.128540.1283610.1283860.129002
0.860.1442320.1658780.1445430.1445430.1475910.1445430.1486070.169942
0.880.1752070.1843160.176210.176210.1759590.176210.1793620.187468
0.90.1981530.2110580.2027330.2027330.199680.2027330.2082830.216608
0.920.220220.2263510.2230570.2230570.2207360.2230570.2266260.223057
0.940.233740.2404830.2390160.2390160.2342860.229920.2416240.239016
0.960.2481370.2643630.2611130.2611130.2488580.2430910.2714030.261113
0.980.3108480.5523850.533190.533190.3160190.2746530.6739520.53319


Frequency Table (Histogram)
BinsMidpointAbs. FrequencyRel. FrequencyCumul. Rel. Freq.Density
[0,0.1[0.05710.7634410.7634417.634409
[0.1,0.2[0.15120.1290320.8924731.290323
[0.2,0.3[0.2580.0860220.9784950.860215
[0.3,0.4[0.35000.9784950
[0.4,0.5[0.45000.9784950
[0.5,0.6[0.5510.0107530.9892470.107527
[0.6,0.7]0.6510.01075310.107527

\begin{tabular}{lllllllll}
\hline
Frequency Table (Histogram) \tabularnewline
Bins & Midpoint & Abs. Frequency & Rel. Frequency & Cumul. Rel. Freq. & Density \tabularnewline
[0,0.1[ & 0.05 & 71 & 0.763441 & 0.763441 & 7.634409 \tabularnewline
[0.1,0.2[ & 0.15 & 12 & 0.129032 & 0.892473 & 1.290323 \tabularnewline
[0.2,0.3[ & 0.25 & 8 & 0.086022 & 0.978495 & 0.860215 \tabularnewline
[0.3,0.4[ & 0.35 & 0 & 0 & 0.978495 & 0 \tabularnewline
[0.4,0.5[ & 0.45 & 0 & 0 & 0.978495 & 0 \tabularnewline
[0.5,0.6[ & 0.55 & 1 & 0.010753 & 0.989247 & 0.107527 \tabularnewline
[0.6,0.7] & 0.65 & 1 & 0.010753 & 1 & 0.107527 \tabularnewline
\hline
\end{tabular}
%Source: https://freestatistics.org/blog/index.php?pk=277376&T=4

[TABLE]
[ROW][C]Frequency Table (Histogram)[/C][/ROW]
[ROW][C]Bins[/C][C]Midpoint[/C][C]Abs. Frequency[/C][C]Rel. Frequency[/C][C]Cumul. Rel. Freq.[/C][C]Density[/C][/ROW]
[ROW][C][0,0.1[[/C][C]0.05[/C][C]71[/C][C]0.763441[/C][C]0.763441[/C][C]7.634409[/C][/ROW]
[ROW][C][0.1,0.2[[/C][C]0.15[/C][C]12[/C][C]0.129032[/C][C]0.892473[/C][C]1.290323[/C][/ROW]
[ROW][C][0.2,0.3[[/C][C]0.25[/C][C]8[/C][C]0.086022[/C][C]0.978495[/C][C]0.860215[/C][/ROW]
[ROW][C][0.3,0.4[[/C][C]0.35[/C][C]0[/C][C]0[/C][C]0.978495[/C][C]0[/C][/ROW]
[ROW][C][0.4,0.5[[/C][C]0.45[/C][C]0[/C][C]0[/C][C]0.978495[/C][C]0[/C][/ROW]
[ROW][C][0.5,0.6[[/C][C]0.55[/C][C]1[/C][C]0.010753[/C][C]0.989247[/C][C]0.107527[/C][/ROW]
[ROW][C][0.6,0.7][/C][C]0.65[/C][C]1[/C][C]0.010753[/C][C]1[/C][C]0.107527[/C][/ROW]
[/TABLE]
Source: https://freestatistics.org/blog/index.php?pk=277376&T=4

Globally Unique Identifier (entire table): ba.freestatistics.org/blog/index.php?pk=277376&T=4

As an alternative you can also use a QR Code:  

The GUIDs for individual cells are displayed in the table below:

Frequency Table (Histogram)
BinsMidpointAbs. FrequencyRel. FrequencyCumul. Rel. Freq.Density
[0,0.1[0.05710.7634410.7634417.634409
[0.1,0.2[0.15120.1290320.8924731.290323
[0.2,0.3[0.2580.0860220.9784950.860215
[0.3,0.4[0.35000.9784950
[0.4,0.5[0.45000.9784950
[0.5,0.6[0.5510.0107530.9892470.107527
[0.6,0.7]0.6510.01075310.107527


Properties of Density Trace
Bandwidth0.0264477039151717
#Observations93

\begin{tabular}{lllllllll}
\hline
Properties of Density Trace \tabularnewline
Bandwidth & 0.0264477039151717 \tabularnewline
#Observations & 93 \tabularnewline
\hline
\end{tabular}
%Source: https://freestatistics.org/blog/index.php?pk=277376&T=5

[TABLE]
[ROW][C]Properties of Density Trace[/C][/ROW]
[ROW][C]Bandwidth[/C][C]0.0264477039151717[/C][/ROW]
[ROW][C]#Observations[/C][C]93[/C][/ROW]
[/TABLE]
Source: https://freestatistics.org/blog/index.php?pk=277376&T=5

Globally Unique Identifier (entire table): ba.freestatistics.org/blog/index.php?pk=277376&T=5

As an alternative you can also use a QR Code:  

The GUIDs for individual cells are displayed in the table below:

Properties of Density Trace
Bandwidth0.0264477039151717
#Observations93


Parameters (Session):
Parameters (R input):
R code (references can be found in the software module):
load(file='createtable')
x <-sort(x[!is.na(x)])
num <- 50
res <- array(NA,dim=c(num,3))
geomean <- function(x) {
return(exp(mean(log(x))))
}
harmean <- function(x) {
return(1/mean(1/x))
}
quamean <- function(x) {
return(sqrt(mean(x*x)))
}
winmean <- function(x) {
x <-sort(x[!is.na(x)])
n<-length(x)
denom <- 3
nodenom <- n/denom
if (nodenom>40) denom <- n/40
sqrtn = sqrt(n)
roundnodenom = floor(nodenom)
win <- array(NA,dim=c(roundnodenom,2))
for (j in 1:roundnodenom) {
win[j,1] <- (j*x[j+1]+sum(x[(j+1):(n-j)])+j*x[n-j])/n
win[j,2] <- sd(c(rep(x[j+1],j),x[(j+1):(n-j)],rep(x[n-j],j)))/sqrtn
}
return(win)
}
trimean <- function(x) {
x <-sort(x[!is.na(x)])
n<-length(x)
denom <- 3
nodenom <- n/denom
if (nodenom>40) denom <- n/40
sqrtn = sqrt(n)
roundnodenom = floor(nodenom)
tri <- array(NA,dim=c(roundnodenom,2))
for (j in 1:roundnodenom) {
tri[j,1] <- mean(x,trim=j/n)
tri[j,2] <- sd(x[(j+1):(n-j)]) / sqrt(n-j*2)
}
return(tri)
}
midrange <- function(x) {
return((max(x)+min(x))/2)
}
q1 <- function(data,n,p,i,f) {
np <- n*p;
i <<- floor(np)
f <<- np - i
qvalue <- (1-f)*data[i] + f*data[i+1]
}
q2 <- function(data,n,p,i,f) {
np <- (n+1)*p
i <<- floor(np)
f <<- np - i
qvalue <- (1-f)*data[i] + f*data[i+1]
}
q3 <- function(data,n,p,i,f) {
np <- n*p
i <<- floor(np)
f <<- np - i
if (f==0) {
qvalue <- data[i]
} else {
qvalue <- data[i+1]
}
}
q4 <- function(data,n,p,i,f) {
np <- n*p
i <<- floor(np)
f <<- np - i
if (f==0) {
qvalue <- (data[i]+data[i+1])/2
} else {
qvalue <- data[i+1]
}
}
q5 <- function(data,n,p,i,f) {
np <- (n-1)*p
i <<- floor(np)
f <<- np - i
if (f==0) {
qvalue <- data[i+1]
} else {
qvalue <- data[i+1] + f*(data[i+2]-data[i+1])
}
}
q6 <- function(data,n,p,i,f) {
np <- n*p+0.5
i <<- floor(np)
f <<- np - i
qvalue <- data[i]
}
q7 <- function(data,n,p,i,f) {
np <- (n+1)*p
i <<- floor(np)
f <<- np - i
if (f==0) {
qvalue <- data[i]
} else {
qvalue <- f*data[i] + (1-f)*data[i+1]
}
}
q8 <- function(data,n,p,i,f) {
np <- (n+1)*p
i <<- floor(np)
f <<- np - i
if (f==0) {
qvalue <- data[i]
} else {
if (f == 0.5) {
qvalue <- (data[i]+data[i+1])/2
} else {
if (f < 0.5) {
qvalue <- data[i]
} else {
qvalue <- data[i+1]
}
}
}
}
iqd <- function(x,def) {
x <-sort(x[!is.na(x)])
n<-length(x)
if (def==1) {
qvalue1 <- q1(x,n,0.25,i,f)
qvalue3 <- q1(x,n,0.75,i,f)
}
if (def==2) {
qvalue1 <- q2(x,n,0.25,i,f)
qvalue3 <- q2(x,n,0.75,i,f)
}
if (def==3) {
qvalue1 <- q3(x,n,0.25,i,f)
qvalue3 <- q3(x,n,0.75,i,f)
}
if (def==4) {
qvalue1 <- q4(x,n,0.25,i,f)
qvalue3 <- q4(x,n,0.75,i,f)
}
if (def==5) {
qvalue1 <- q5(x,n,0.25,i,f)
qvalue3 <- q5(x,n,0.75,i,f)
}
if (def==6) {
qvalue1 <- q6(x,n,0.25,i,f)
qvalue3 <- q6(x,n,0.75,i,f)
}
if (def==7) {
qvalue1 <- q7(x,n,0.25,i,f)
qvalue3 <- q7(x,n,0.75,i,f)
}
if (def==8) {
qvalue1 <- q8(x,n,0.25,i,f)
qvalue3 <- q8(x,n,0.75,i,f)
}
iqdiff <- qvalue3 - qvalue1
return(c(iqdiff,iqdiff/2,iqdiff/(qvalue3 + qvalue1)))
}
midmean <- function(x,def) {
x <-sort(x[!is.na(x)])
n<-length(x)
if (def==1) {
qvalue1 <- q1(x,n,0.25,i,f)
qvalue3 <- q1(x,n,0.75,i,f)
}
if (def==2) {
qvalue1 <- q2(x,n,0.25,i,f)
qvalue3 <- q2(x,n,0.75,i,f)
}
if (def==3) {
qvalue1 <- q3(x,n,0.25,i,f)
qvalue3 <- q3(x,n,0.75,i,f)
}
if (def==4) {
qvalue1 <- q4(x,n,0.25,i,f)
qvalue3 <- q4(x,n,0.75,i,f)
}
if (def==5) {
qvalue1 <- q5(x,n,0.25,i,f)
qvalue3 <- q5(x,n,0.75,i,f)
}
if (def==6) {
qvalue1 <- q6(x,n,0.25,i,f)
qvalue3 <- q6(x,n,0.75,i,f)
}
if (def==7) {
qvalue1 <- q7(x,n,0.25,i,f)
qvalue3 <- q7(x,n,0.75,i,f)
}
if (def==8) {
qvalue1 <- q8(x,n,0.25,i,f)
qvalue3 <- q8(x,n,0.75,i,f)
}
midm <- 0
myn <- 0
roundno4 <- round(n/4)
round3no4 <- round(3*n/4)
for (i in 1:n) {
if ((x[i]>=qvalue1) & (x[i]<=qvalue3)){
midm = midm + x[i]
myn = myn + 1
}
}
midm = midm / myn
return(midm)
}
range <- max(x) - min(x)
lx <- length(x)
biasf <- (lx-1)/lx
varx <- var(x)
bvarx <- varx*biasf
sdx <- sqrt(varx)
mx <- mean(x)
bsdx <- sqrt(bvarx)
x2 <- x*x
mse0 <- sum(x2)/lx
xmm <- x-mx
xmm2 <- xmm*xmm
msem <- sum(xmm2)/lx
axmm <- abs(x - mx)
medx <- median(x)
axmmed <- abs(x - medx)
xmmed <- x - medx
xmmed2 <- xmmed*xmmed
msemed <- sum(xmmed2)/lx
qarr <- array(NA,dim=c(8,3))
for (j in 1:8) {
qarr[j,] <- iqd(x,j)
}
sdpo <- 0
adpo <- 0
for (i in 1:(lx-1)) {
for (j in (i+1):lx) {
ldi <- x[i]-x[j]
aldi <- abs(ldi)
sdpo = sdpo + ldi * ldi
adpo = adpo + aldi
}
}
denom <- (lx*(lx-1)/2)
sdpo = sdpo / denom
adpo = adpo / denom
gmd <- 0
for (i in 1:lx) {
for (j in 1:lx) {
ldi <- abs(x[i]-x[j])
gmd = gmd + ldi
}
}
gmd <- gmd / (lx*(lx-1))
sumx <- sum(x)
pk <- x / sumx
ck <- cumsum(pk)
dk <- array(NA,dim=lx)
for (i in 1:lx) {
if (ck[i] <= 0.5) dk[i] <- ck[i] else dk[i] <- 1 - ck[i]
}
bigd <- sum(dk) * 2 / (lx-1)
iod <- 1 - sum(pk*pk)
res[1,] <- c('Absolute range','absolute.htm', range)
res[2,] <- c('Relative range (unbiased)','relative.htm', range/sd(x))
res[3,] <- c('Relative range (biased)','relative.htm', range/sqrt(varx*biasf))
res[4,] <- c('Variance (unbiased)','unbiased.htm', varx)
res[5,] <- c('Variance (biased)','biased.htm', bvarx)
res[6,] <- c('Standard Deviation (unbiased)','unbiased1.htm', sdx)
res[7,] <- c('Standard Deviation (biased)','biased1.htm', bsdx)
res[8,] <- c('Coefficient of Variation (unbiased)','variation.htm', sdx/mx)
res[9,] <- c('Coefficient of Variation (biased)','variation.htm', bsdx/mx)
res[10,] <- c('Mean Squared Error (MSE versus 0)','mse.htm', mse0)
res[11,] <- c('Mean Squared Error (MSE versus Mean)','mse.htm', msem)
res[12,] <- c('Mean Absolute Deviation from Mean (MAD Mean)', 'mean2.htm', sum(axmm)/lx)
res[13,] <- c('Mean Absolute Deviation from Median (MAD Median)', 'median1.htm', sum(axmmed)/lx)
res[14,] <- c('Median Absolute Deviation from Mean', 'mean3.htm', median(axmm))
res[15,] <- c('Median Absolute Deviation from Median', 'median2.htm', median(axmmed))
res[16,] <- c('Mean Squared Deviation from Mean', 'mean1.htm', msem)
res[17,] <- c('Mean Squared Deviation from Median', 'median.htm', msemed)
mylink1 <- hyperlink('difference.htm','Interquartile Difference','')
mylink2 <- paste(mylink1,hyperlink('method_1.htm','(Weighted Average at Xnp)',''),sep=' ')
res[18,] <- c('', mylink2, qarr[1,1])
mylink2 <- paste(mylink1,hyperlink('method_2.htm','(Weighted Average at X(n+1)p)',''),sep=' ')
res[19,] <- c('', mylink2, qarr[2,1])
mylink2 <- paste(mylink1,hyperlink('method_3.htm','(Empirical Distribution Function)',''),sep=' ')
res[20,] <- c('', mylink2, qarr[3,1])
mylink2 <- paste(mylink1,hyperlink('method_4.htm','(Empirical Distribution Function - Averaging)',''),sep=' ')
res[21,] <- c('', mylink2, qarr[4,1])
mylink2 <- paste(mylink1,hyperlink('method_5.htm','(Empirical Distribution Function - Interpolation)',''),sep=' ')
res[22,] <- c('', mylink2, qarr[5,1])
mylink2 <- paste(mylink1,hyperlink('method_6.htm','(Closest Observation)',''),sep=' ')
res[23,] <- c('', mylink2, qarr[6,1])
mylink2 <- paste(mylink1,hyperlink('method_7.htm','(True Basic - Statistics Graphics Toolkit)',''),sep=' ')
res[24,] <- c('', mylink2, qarr[7,1])
mylink2 <- paste(mylink1,hyperlink('method_8.htm','(MS Excel (old versions))',''),sep=' ')
res[25,] <- c('', mylink2, qarr[8,1])
mylink1 <- hyperlink('deviation.htm','Semi Interquartile Difference','')
mylink2 <- paste(mylink1,hyperlink('method_1.htm','(Weighted Average at Xnp)',''),sep=' ')
res[26,] <- c('', mylink2, qarr[1,2])
mylink2 <- paste(mylink1,hyperlink('method_2.htm','(Weighted Average at X(n+1)p)',''),sep=' ')
res[27,] <- c('', mylink2, qarr[2,2])
mylink2 <- paste(mylink1,hyperlink('method_3.htm','(Empirical Distribution Function)',''),sep=' ')
res[28,] <- c('', mylink2, qarr[3,2])
mylink2 <- paste(mylink1,hyperlink('method_4.htm','(Empirical Distribution Function - Averaging)',''),sep=' ')
res[29,] <- c('', mylink2, qarr[4,2])
mylink2 <- paste(mylink1,hyperlink('method_5.htm','(Empirical Distribution Function - Interpolation)',''),sep=' ')
res[30,] <- c('', mylink2, qarr[5,2])
mylink2 <- paste(mylink1,hyperlink('method_6.htm','(Closest Observation)',''),sep=' ')
res[31,] <- c('', mylink2, qarr[6,2])
mylink2 <- paste(mylink1,hyperlink('method_7.htm','(True Basic - Statistics Graphics Toolkit)',''),sep=' ')
res[32,] <- c('', mylink2, qarr[7,2])
mylink2 <- paste(mylink1,hyperlink('method_8.htm','(MS Excel (old versions))',''),sep=' ')
res[33,] <- c('', mylink2, qarr[8,2])
mylink1 <- hyperlink('variation1.htm','Coefficient of Quartile Variation','')
mylink2 <- paste(mylink1,hyperlink('method_1.htm','(Weighted Average at Xnp)',''),sep=' ')
res[34,] <- c('', mylink2, qarr[1,3])
mylink2 <- paste(mylink1,hyperlink('method_2.htm','(Weighted Average at X(n+1)p)',''),sep=' ')
res[35,] <- c('', mylink2, qarr[2,3])
mylink2 <- paste(mylink1,hyperlink('method_3.htm','(Empirical Distribution Function)',''),sep=' ')
res[36,] <- c('', mylink2, qarr[3,3])
mylink2 <- paste(mylink1,hyperlink('method_4.htm','(Empirical Distribution Function - Averaging)',''),sep=' ')
res[37,] <- c('', mylink2, qarr[4,3])
mylink2 <- paste(mylink1,hyperlink('method_5.htm','(Empirical Distribution Function - Interpolation)',''),sep=' ')
res[38,] <- c('', mylink2, qarr[5,3])
mylink2 <- paste(mylink1,hyperlink('method_6.htm','(Closest Observation)',''),sep=' ')
res[39,] <- c('', mylink2, qarr[6,3])
mylink2 <- paste(mylink1,hyperlink('method_7.htm','(True Basic - Statistics Graphics Toolkit)',''),sep=' ')
res[40,] <- c('', mylink2, qarr[7,3])
mylink2 <- paste(mylink1,hyperlink('method_8.htm','(MS Excel (old versions))',''),sep=' ')
res[41,] <- c('', mylink2, qarr[8,3])
res[42,] <- c('Number of all Pairs of Observations', 'pair_numbers.htm', lx*(lx-1)/2)
res[43,] <- c('Squared Differences between all Pairs of Observations', 'squared_differences.htm', sdpo)
res[44,] <- c('Mean Absolute Differences between all Pairs of Observations', 'mean_abs_differences.htm', adpo)
res[45,] <- c('Gini Mean Difference', 'gini_mean_difference.htm', gmd)
res[46,] <- c('Leik Measure of Dispersion', 'leiks_d.htm', bigd)
res[47,] <- c('Index of Diversity', 'diversity.htm', iod)
res[48,] <- c('Index of Qualitative Variation', 'qualitative_variation.htm', iod*lx/(lx-1))
res[49,] <- c('Coefficient of Dispersion', 'dispersion.htm', sum(axmm)/lx/medx)
res[50,] <- c('Observations', '', lx)
res
(arm <- mean(x))
sqrtn <- sqrt(length(x))
(armse <- sd(x) / sqrtn)
(armose <- arm / armse)
(geo <- geomean(x))
(har <- harmean(x))
(qua <- quamean(x))
(win <- winmean(x))
(tri <- trimean(x))
(midr <- midrange(x))
midm <- array(NA,dim=8)
for (j in 1:8) midm[j] <- midmean(x,j)
midm
bitmap(file='test1.png')
lb <- win[,1] - 2*win[,2]
ub <- win[,1] + 2*win[,2]
if ((ylimmin == '') | (ylimmax == '')) plot(win[,1],type='b',main='Robustness of Central Tendency', xlab='j', pch=19, ylab='Winsorized Mean(j/n)', ylim=c(min(lb),max(ub))) else plot(win[,1],type='l',main='Robustness of Central Tendency', xlab='j', pch=19, ylab='Winsorized Mean(j/n)', ylim=c(ylimmin,ylimmax))
lines(ub,lty=3)
lines(lb,lty=3)
grid()
dev.off()
bitmap(file='test2.png')
lb <- tri[,1] - 2*tri[,2]
ub <- tri[,1] + 2*tri[,2]
if ((ylimmin == '') | (ylimmax == '')) plot(tri[,1],type='b',main='Robustness of Central Tendency', xlab='j', pch=19, ylab='Trimmed Mean(j/n)', ylim=c(min(lb),max(ub))) else plot(tri[,1],type='l',main='Robustness of Central Tendency', xlab='j', pch=19, ylab='Trimmed Mean(j/n)', ylim=c(ylimmin,ylimmax))
lines(ub,lty=3)
lines(lb,lty=3)
grid()
dev.off()
a<-table.start()
a<-table.row.start(a)
a<-table.element(a,'Central Tendency - Ungrouped Data',4,TRUE)
a<-table.row.end(a)
a<-table.row.start(a)
a<-table.element(a,'Measure',header=TRUE)
a<-table.element(a,'Value',header=TRUE)
a<-table.element(a,'S.E.',header=TRUE)
a<-table.element(a,'Value/S.E.',header=TRUE)
a<-table.row.end(a)
a<-table.row.start(a)
a<-table.element(a,hyperlink('arithmetic_mean.htm', 'Arithmetic Mean', 'click to view the definition of the Arithmetic Mean'),header=TRUE)
a<-table.element(a,arm)
a<-table.element(a,hyperlink('arithmetic_mean_standard_error.htm', armse, 'click to view the definition of the Standard Error of the Arithmetic Mean'))
a<-table.element(a,armose)
a<-table.row.end(a)
a<-table.row.start(a)
a<-table.element(a,hyperlink('geometric_mean.htm', 'Geometric Mean', 'click to view the definition of the Geometric Mean'),header=TRUE)
a<-table.element(a,geo)
a<-table.element(a,'')
a<-table.row.end(a)
a<-table.row.start(a)
a<-table.element(a,hyperlink('harmonic_mean.htm', 'Harmonic Mean', 'click to view the definition of the Harmonic Mean'),header=TRUE)
a<-table.element(a,har)
a<-table.element(a,'')
a<-table.row.end(a)
a<-table.row.start(a)
a<-table.element(a,hyperlink('quadratic_mean.htm', 'Quadratic Mean', 'click to view the definition of the Quadratic Mean'),header=TRUE)
a<-table.element(a,qua)
a<-table.element(a,'')
a<-table.row.end(a)
for (j in 1:length(win[,1])) {
a<-table.row.start(a)
mylabel <- paste('Winsorized Mean (',j)
mylabel <- paste(mylabel,'/')
mylabel <- paste(mylabel,length(win[,1]))
mylabel <- paste(mylabel,')')
a<-table.element(a,hyperlink('winsorized_mean.htm', mylabel, 'click to view the definition of the Winsorized Mean'),header=TRUE)
a<-table.element(a,win[j,1])
a<-table.element(a,win[j,2])
a<-table.element(a,win[j,1]/win[j,2])
a<-table.row.end(a)
}
for (j in 1:length(tri[,1])) {
a<-table.row.start(a)
mylabel <- paste('Trimmed Mean (',j)
mylabel <- paste(mylabel,'/')
mylabel <- paste(mylabel,length(tri[,1]))
mylabel <- paste(mylabel,')')
a<-table.element(a,hyperlink('arithmetic_mean.htm', mylabel, 'click to view the definition of the Trimmed Mean'),header=TRUE)
a<-table.element(a,tri[j,1])
a<-table.element(a,tri[j,2])
a<-table.element(a,tri[j,1]/tri[j,2])
a<-table.row.end(a)
}
a<-table.row.start(a)
a<-table.element(a,hyperlink('median_1.htm', 'Median', 'click to view the definition of the Median'),header=TRUE)
a<-table.element(a,median(x))
a<-table.element(a,'')
a<-table.row.end(a)
a<-table.row.start(a)
a<-table.element(a,hyperlink('midrange.htm', 'Midrange', 'click to view the definition of the Midrange'),header=TRUE)
a<-table.element(a,midr)
a<-table.element(a,'')
a<-table.row.end(a)
a<-table.row.start(a)
mymid <- hyperlink('midmean.htm', 'Midmean', 'click to view the definition of the Midmean')
mylabel <- paste(mymid,hyperlink('method_1.htm','Weighted Average at Xnp',''),sep=' - ')
a<-table.element(a,mylabel,header=TRUE)
a<-table.element(a,midm[1])
a<-table.element(a,'')
a<-table.row.end(a)
a<-table.row.start(a)
mymid <- hyperlink('midmean.htm', 'Midmean', 'click to view the definition of the Midmean')
mylabel <- paste(mymid,hyperlink('method_2.htm','Weighted Average at X(n+1)p',''),sep=' - ')
a<-table.element(a,mylabel,header=TRUE)
a<-table.element(a,midm[2])
a<-table.element(a,'')
a<-table.row.end(a)
a<-table.row.start(a)
mymid <- hyperlink('midmean.htm', 'Midmean', 'click to view the definition of the Midmean')
mylabel <- paste(mymid,hyperlink('method_3.htm','Empirical Distribution Function',''),sep=' - ')
a<-table.element(a,mylabel,header=TRUE)
a<-table.element(a,midm[3])
a<-table.element(a,'')
a<-table.row.end(a)
a<-table.row.start(a)
mymid <- hyperlink('midmean.htm', 'Midmean', 'click to view the definition of the Midmean')
mylabel <- paste(mymid,hyperlink('method_4.htm','Empirical Distribution Function - Averaging',''),sep=' - ')
a<-table.element(a,mylabel,header=TRUE)
a<-table.element(a,midm[4])
a<-table.element(a,'')
a<-table.row.end(a)
a<-table.row.start(a)
mymid <- hyperlink('midmean.htm', 'Midmean', 'click to view the definition of the Midmean')
mylabel <- paste(mymid,hyperlink('method_5.htm','Empirical Distribution Function - Interpolation',''),sep=' - ')
a<-table.element(a,mylabel,header=TRUE)
a<-table.element(a,midm[5])
a<-table.element(a,'')
a<-table.row.end(a)
a<-table.row.start(a)
mymid <- hyperlink('midmean.htm', 'Midmean', 'click to view the definition of the Midmean')
mylabel <- paste(mymid,hyperlink('method_6.htm','Closest Observation',''),sep=' - ')
a<-table.element(a,mylabel,header=TRUE)
a<-table.element(a,midm[6])
a<-table.element(a,'')
a<-table.row.end(a)
a<-table.row.start(a)
mymid <- hyperlink('midmean.htm', 'Midmean', 'click to view the definition of the Midmean')
mylabel <- paste(mymid,hyperlink('method_7.htm','True Basic - Statistics Graphics Toolkit',''),sep=' - ')
a<-table.element(a,mylabel,header=TRUE)
a<-table.element(a,midm[7])
a<-table.element(a,'')
a<-table.row.end(a)
a<-table.row.start(a)
mymid <- hyperlink('midmean.htm', 'Midmean', 'click to view the definition of the Midmean')
mylabel <- paste(mymid,hyperlink('method_8.htm','MS Excel (old versions)',''),sep=' - ')
a<-table.element(a,mylabel,header=TRUE)
a<-table.element(a,midm[8])
a<-table.element(a,'')
a<-table.row.end(a)
a<-table.row.start(a)
a<-table.element(a,'Number of observations',header=TRUE)
a<-table.element(a,length(x))
a<-table.element(a,'')
a<-table.row.end(a)
a<-table.end(a)
table.save(a,file='mytable.tab')
a<-table.start()
a<-table.row.start(a)
a<-table.element(a,'Variability - Ungrouped Data',2,TRUE)
a<-table.row.end(a)
for (i in 1:num) {
a<-table.row.start(a)
if (res[i,1] != '') {
a<-table.element(a,hyperlink(res[i,2],res[i,1],''),header=TRUE)
} else {
a<-table.element(a,res[i,2],header=TRUE)
}
a<-table.element(a,res[i,3])
a<-table.row.end(a)
}
a<-table.end(a)
table.save(a,file='mytable1.tab')
lx <- length(x)
qval <- array(NA,dim=c(99,8))
mystep <- 25
mystart <- 25
if (lx>10){
mystep=10
mystart=10
}
if (lx>20){
mystep=5
mystart=5
}
if (lx>50){
mystep=2
mystart=2
}
if (lx>=100){
mystep=1
mystart=1
}
for (perc in seq(mystart,99,mystep)) {
qval[perc,1] <- q1(x,lx,perc/100,i,f)
qval[perc,2] <- q2(x,lx,perc/100,i,f)
qval[perc,3] <- q3(x,lx,perc/100,i,f)
qval[perc,4] <- q4(x,lx,perc/100,i,f)
qval[perc,5] <- q5(x,lx,perc/100,i,f)
qval[perc,6] <- q6(x,lx,perc/100,i,f)
qval[perc,7] <- q7(x,lx,perc/100,i,f)
qval[perc,8] <- q8(x,lx,perc/100,i,f)
}
bitmap(file='test3.png')
myqqnorm <- qqnorm(x,col=2)
qqline(x)
grid()
dev.off()
a<-table.start()
a<-table.row.start(a)
a<-table.element(a,'Percentiles - Ungrouped Data',9,TRUE)
a<-table.row.end(a)
a<-table.row.start(a)
a<-table.element(a,'p',1,TRUE)
a<-table.element(a,hyperlink('method_1.htm', 'Weighted Average at Xnp',''),1,TRUE)
a<-table.element(a,hyperlink('method_2.htm','Weighted Average at X(n+1)p',''),1,TRUE)
a<-table.element(a,hyperlink('method_3.htm','Empirical Distribution Function',''),1,TRUE)
a<-table.element(a,hyperlink('method_4.htm','Empirical Distribution Function - Averaging',''),1,TRUE)
a<-table.element(a,hyperlink('method_5.htm','Empirical Distribution Function - Interpolation',''),1,TRUE)
a<-table.element(a,hyperlink('method_6.htm','Closest Observation',''),1,TRUE)
a<-table.element(a,hyperlink('method_7.htm','True Basic - Statistics Graphics Toolkit',''),1,TRUE)
a<-table.element(a,hyperlink('method_8.htm','MS Excel (old versions)',''),1,TRUE)
a<-table.row.end(a)
for (perc in seq(mystart,99,mystep)) {
a<-table.row.start(a)
a<-table.element(a,round(perc/100,2),1,TRUE)
for (j in 1:8) {
a<-table.element(a,round(qval[perc,j],6))
}
a<-table.row.end(a)
}
a<-table.end(a)
table.save(a,file='mytable2.tab')
bitmap(file='histogram1.png')
myhist<-hist(x)
dev.off()
myhist
n <- length(x)
a<-table.start()
a<-table.row.start(a)
a<-table.element(a,hyperlink('histogram.htm','Frequency Table (Histogram)',''),6,TRUE)
a<-table.row.end(a)
a<-table.row.start(a)
a<-table.element(a,'Bins',header=TRUE)
a<-table.element(a,'Midpoint',header=TRUE)
a<-table.element(a,'Abs. Frequency',header=TRUE)
a<-table.element(a,'Rel. Frequency',header=TRUE)
a<-table.element(a,'Cumul. Rel. Freq.',header=TRUE)
a<-table.element(a,'Density',header=TRUE)
a<-table.row.end(a)
crf <- 0
mybracket <- '['
mynumrows <- (length(myhist$breaks)-1)
for (i in 1:mynumrows) {
a<-table.row.start(a)
if (i == 1)
dum <- paste('[',myhist$breaks[i],sep='')
else
dum <- paste(mybracket,myhist$breaks[i],sep='')
dum <- paste(dum,myhist$breaks[i+1],sep=',')
if (i==mynumrows)
dum <- paste(dum,']',sep='')
else
dum <- paste(dum,mybracket,sep='')
a<-table.element(a,dum,header=TRUE)
a<-table.element(a,myhist$mids[i])
a<-table.element(a,myhist$counts[i])
rf <- myhist$counts[i]/n
crf <- crf + rf
a<-table.element(a,round(rf,6))
a<-table.element(a,round(crf,6))
a<-table.element(a,round(myhist$density[i],6))
a<-table.row.end(a)
}
a<-table.end(a)
table.save(a,file='mytable5.tab')
bitmap(file='density1.png')
mydensity1<-density(x,kernel='gaussian',na.rm=TRUE)
plot(mydensity1,main='Gaussian Kernel')
grid()
dev.off()
mydensity1
a<-table.start()
a<-table.row.start(a)
a<-table.element(a,'Properties of Density Trace',2,TRUE)
a<-table.row.end(a)
a<-table.row.start(a)
a<-table.element(a,'Bandwidth',header=TRUE)
a<-table.element(a,mydensity1$bw)
a<-table.row.end(a)
a<-table.row.start(a)
a<-table.element(a,'#Observations',header=TRUE)
a<-table.element(a,mydensity1$n)
a<-table.row.end(a)
a<-table.end(a)
table.save(a,file='mytable4.tab')