Free Statistics

of Irreproducible Research!

Author's title

Author*Unverified author*
R Software Modulerwasp_density.wasp
Title produced by softwareKernel Density Estimation
Date of computationThu, 05 Feb 2015 10:55:36 +0000
Cite this page as followsStatistical Computations at FreeStatistics.org, Office for Research Development and Education, URL https://freestatistics.org/blog/index.php?v=date/2015/Feb/05/t1423133779jumnmof51ylow63.htm/, Retrieved Sat, 18 May 2024 02:28:01 +0000
Statistical Computations at FreeStatistics.org, Office for Research Development and Education, URL https://freestatistics.org/blog/index.php?pk=276725, Retrieved Sat, 18 May 2024 02:28:01 +0000
QR Codes:

Original text written by user:
IsPrivate?No (this computation is public)
User-defined keywords
Estimated Impact133
Family? (F = Feedback message, R = changed R code, M = changed R Module, P = changed Parameters, D = changed Data)
-     [Univariate Data Series] [Inschrijving pers...] [2015-01-27 13:11:51] [606429a23a15ee4c49d7d08a55d8c166]
- RMP     [Kernel Density Estimation] [] [2015-02-05 10:55:36] [8e46ac5a02f6c72569c3bd9e9d260f29] [Current]
Feedback Forum

Post a new message
Dataseries X:
58552
54955
65540
51570
51145
46641
35704
33253
35193
41668
34865
21210
56126
49231
59723
48103
47472
50497
40059
34149
36860
46356
36577
23872
57276
56389
57657
62300
48929
51168
39636
33213
38127
43291
30600
21956
48033
46148
50736
48114
38390
44112
36287
30333
35908
40005
35263
26591
49709
47840
64781
57802
48154
54353
39737
37732
37163
43782
40649
29412
53597
53588
64172
53955
55509
48908
35331
38073
41776
42717
40736
49020
45099
44114
60487
48760
41281
48346
37025
31514
33977
42060
36036
22012
51048
45834
53712
53577
45022
43740
34898
30103
35137
39752
32348
25198


Summary of computational transaction
Raw Inputview raw input (R code)
Raw Outputview raw output of R engine
Computing time4 seconds
R Server'Gwilym Jenkins' @ jenkins.wessa.net

\begin{tabular}{lllllllll}
\hline
Summary of computational transaction \tabularnewline
Raw Input & view raw input (R code)  \tabularnewline
Raw Output & view raw output of R engine  \tabularnewline
Computing time & 4 seconds \tabularnewline
R Server & 'Gwilym Jenkins' @ jenkins.wessa.net \tabularnewline
\hline
\end{tabular}
%Source: https://freestatistics.org/blog/index.php?pk=276725&T=0

[TABLE]
[ROW][C]Summary of computational transaction[/C][/ROW]
[ROW][C]Raw Input[/C][C]view raw input (R code) [/C][/ROW]
[ROW][C]Raw Output[/C][C]view raw output of R engine [/C][/ROW]
[ROW][C]Computing time[/C][C]4 seconds[/C][/ROW]
[ROW][C]R Server[/C][C]'Gwilym Jenkins' @ jenkins.wessa.net[/C][/ROW]
[/TABLE]
Source: https://freestatistics.org/blog/index.php?pk=276725&T=0

Globally Unique Identifier (entire table): ba.freestatistics.org/blog/index.php?pk=276725&T=0

As an alternative you can also use a QR Code:  

The GUIDs for individual cells are displayed in the table below:

Summary of computational transaction
Raw Inputview raw input (R code)
Raw Outputview raw output of R engine
Computing time4 seconds
R Server'Gwilym Jenkins' @ jenkins.wessa.net


Properties of Density Trace
Bandwidth3683.26464175291
#Observations96

\begin{tabular}{lllllllll}
\hline
Properties of Density Trace \tabularnewline
Bandwidth & 3683.26464175291 \tabularnewline
#Observations & 96 \tabularnewline
\hline
\end{tabular}
%Source: https://freestatistics.org/blog/index.php?pk=276725&T=1

[TABLE]
[ROW][C]Properties of Density Trace[/C][/ROW]
[ROW][C]Bandwidth[/C][C]3683.26464175291[/C][/ROW]
[ROW][C]#Observations[/C][C]96[/C][/ROW]
[/TABLE]
Source: https://freestatistics.org/blog/index.php?pk=276725&T=1

Globally Unique Identifier (entire table): ba.freestatistics.org/blog/index.php?pk=276725&T=1

As an alternative you can also use a QR Code:  

The GUIDs for individual cells are displayed in the table below:

Properties of Density Trace
Bandwidth3683.26464175291
#Observations96


Maximum Density Values
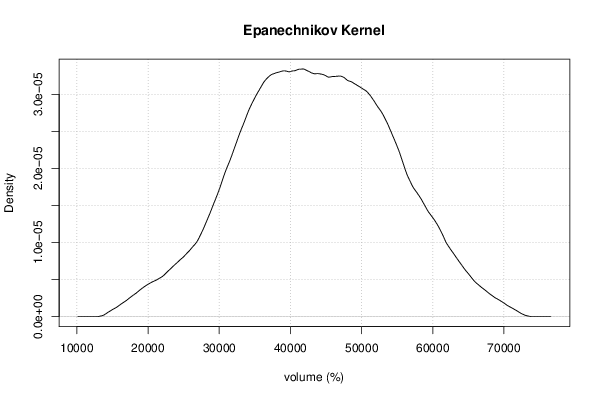
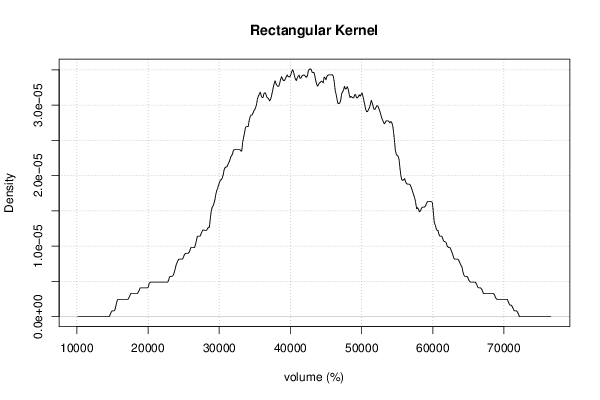
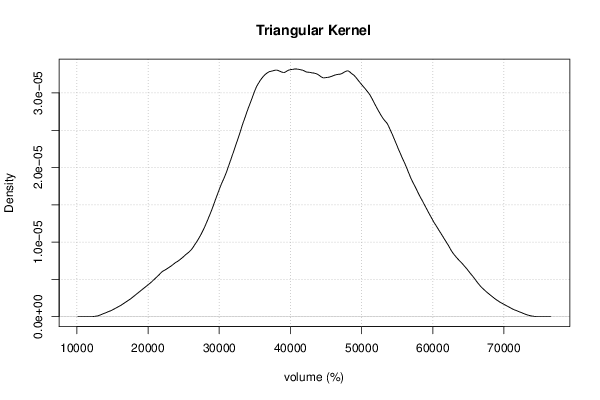
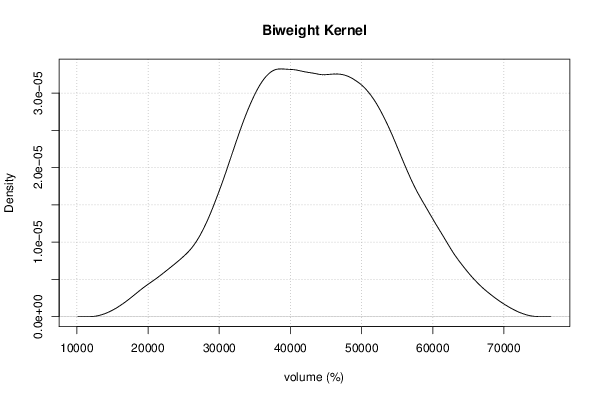
Kernelx-valuemax. density
Gaussian38110.03266546783.36031041980022e-05
Epanechnikov41750.01008193453.34431058633062e-05
Rectangular42790.00362949643.51180953200688e-05
Triangular40710.01653437263.32217396095932e-05
Biweight38760.0286326943.32349482004916e-05
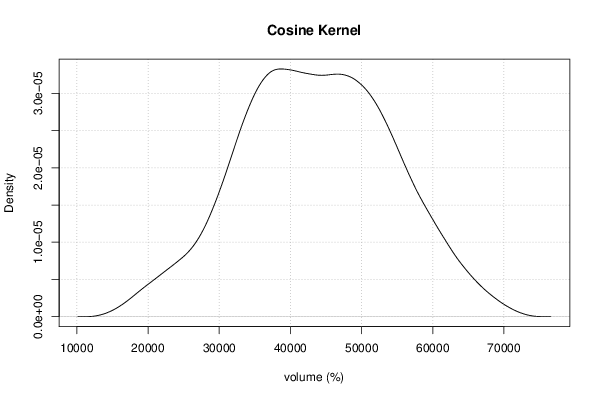
Cosine38630.02943924883.32886738710093e-05
Optcosine41360.01250159883.33441498390879e-05

\begin{tabular}{lllllllll}
\hline
Maximum Density Values \tabularnewline
Kernel & x-value & max. density \tabularnewline
Gaussian & 38110.0326654678 & 3.36031041980022e-05 \tabularnewline
Epanechnikov & 41750.0100819345 & 3.34431058633062e-05 \tabularnewline
Rectangular & 42790.0036294964 & 3.51180953200688e-05 \tabularnewline
Triangular & 40710.0165343726 & 3.32217396095932e-05 \tabularnewline
Biweight & 38760.028632694 & 3.32349482004916e-05 \tabularnewline
Cosine & 38630.0294392488 & 3.32886738710093e-05 \tabularnewline
Optcosine & 41360.0125015988 & 3.33441498390879e-05 \tabularnewline
\hline
\end{tabular}
%Source: https://freestatistics.org/blog/index.php?pk=276725&T=2

[TABLE]
[ROW][C]Maximum Density Values[/C][/ROW]
[ROW][C]Kernel[/C][C]x-value[/C][C]max. density[/C][/ROW]
[ROW][C]Gaussian[/C][C]38110.0326654678[/C][C]3.36031041980022e-05[/C][/ROW]
[ROW][C]Epanechnikov[/C][C]41750.0100819345[/C][C]3.34431058633062e-05[/C][/ROW]
[ROW][C]Rectangular[/C][C]42790.0036294964[/C][C]3.51180953200688e-05[/C][/ROW]
[ROW][C]Triangular[/C][C]40710.0165343726[/C][C]3.32217396095932e-05[/C][/ROW]
[ROW][C]Biweight[/C][C]38760.028632694[/C][C]3.32349482004916e-05[/C][/ROW]
[ROW][C]Cosine[/C][C]38630.0294392488[/C][C]3.32886738710093e-05[/C][/ROW]
[ROW][C]Optcosine[/C][C]41360.0125015988[/C][C]3.33441498390879e-05[/C][/ROW]
[/TABLE]
Source: https://freestatistics.org/blog/index.php?pk=276725&T=2

Globally Unique Identifier (entire table): ba.freestatistics.org/blog/index.php?pk=276725&T=2

As an alternative you can also use a QR Code:  

The GUIDs for individual cells are displayed in the table below:

Maximum Density Values
Kernelx-valuemax. density
Gaussian38110.03266546783.36031041980022e-05
Epanechnikov41750.01008193453.34431058633062e-05
Rectangular42790.00362949643.51180953200688e-05
Triangular40710.01653437263.32217396095932e-05
Biweight38760.0286326943.32349482004916e-05
Cosine38630.02943924883.32886738710093e-05
Optcosine41360.01250159883.33441498390879e-05


Parameters (Session):
par1 = 0 ; par2 = no ; par3 = 512 ;
Parameters (R input):
par1 = 0 ; par2 = no ; par3 = 512 ;
R code (references can be found in the software module):
if (par1 == '0') bw <- 'nrd0'
if (par1 != '0') bw <- as.numeric(par1)
par3 <- as.numeric(par3)
mydensity <- array(NA, dim=c(par3,8))
bitmap(file='density1.png')
mydensity1<-density(x,bw=bw,kernel='gaussian',na.rm=TRUE)
mydensity[,8] = signif(mydensity1$x,3)
mydensity[,1] = signif(mydensity1$y,3)
plot(mydensity1,main='Gaussian Kernel',xlab=xlab,ylab=ylab)
grid()
dev.off()
mydensity1
bitmap(file='density2.png')
mydensity2<-density(x,bw=bw,kernel='epanechnikov',na.rm=TRUE)
mydensity[,2] = signif(mydensity2$y,3)
plot(mydensity2,main='Epanechnikov Kernel',xlab=xlab,ylab=ylab)
grid()
dev.off()
bitmap(file='density3.png')
mydensity3<-density(x,bw=bw,kernel='rectangular',na.rm=TRUE)
mydensity[,3] = signif(mydensity3$y,3)
plot(mydensity3,main='Rectangular Kernel',xlab=xlab,ylab=ylab)
grid()
dev.off()
bitmap(file='density4.png')
mydensity4<-density(x,bw=bw,kernel='triangular',na.rm=TRUE)
mydensity[,4] = signif(mydensity4$y,3)
plot(mydensity4,main='Triangular Kernel',xlab=xlab,ylab=ylab)
grid()
dev.off()
bitmap(file='density5.png')
mydensity5<-density(x,bw=bw,kernel='biweight',na.rm=TRUE)
mydensity[,5] = signif(mydensity5$y,3)
plot(mydensity5,main='Biweight Kernel',xlab=xlab,ylab=ylab)
grid()
dev.off()
bitmap(file='density6.png')
mydensity6<-density(x,bw=bw,kernel='cosine',na.rm=TRUE)
mydensity[,6] = signif(mydensity6$y,3)
plot(mydensity6,main='Cosine Kernel',xlab=xlab,ylab=ylab)
grid()
dev.off()
bitmap(file='density7.png')
mydensity7<-density(x,bw=bw,kernel='optcosine',na.rm=TRUE)
mydensity[,7] = signif(mydensity7$y,3)
plot(mydensity7,main='Optcosine Kernel',xlab=xlab,ylab=ylab)
grid()
dev.off()
load(file='createtable')
a<-table.start()
a<-table.row.start(a)
a<-table.element(a,'Properties of Density Trace',2,TRUE)
a<-table.row.end(a)
a<-table.row.start(a)
a<-table.element(a,'Bandwidth',header=TRUE)
a<-table.element(a,mydensity1$bw)
a<-table.row.end(a)
a<-table.row.start(a)
a<-table.element(a,'#Observations',header=TRUE)
a<-table.element(a,mydensity1$n)
a<-table.row.end(a)
a<-table.end(a)
table.save(a,file='mytable.tab')
a<-table.start()
a<-table.row.start(a)
a<-table.element(a,'Maximum Density Values',3,TRUE)
a<-table.row.end(a)
a<-table.row.start(a)
a<-table.element(a,'Kernel',1,TRUE)
a<-table.element(a,'x-value',1,TRUE)
a<-table.element(a,'max. density',1,TRUE)
a<-table.row.end(a)
a<-table.row.start(a)
a<-table.element(a,'Gaussian',1,TRUE)
a<-table.element(a,mydensity1$x[mydensity1$y==max(mydensity1$y)],1)
a<-table.element(a,mydensity1$y[mydensity1$y==max(mydensity1$y)],1)
a<-table.row.end(a)
a<-table.row.start(a)
a<-table.element(a,'Epanechnikov',1,TRUE)
a<-table.element(a,mydensity2$x[mydensity2$y==max(mydensity2$y)],1)
a<-table.element(a,mydensity2$y[mydensity2$y==max(mydensity2$y)],1)
a<-table.row.end(a)
a<-table.row.start(a)
a<-table.element(a,'Rectangular',1,TRUE)
a<-table.element(a,mydensity3$x[mydensity3$y==max(mydensity3$y)],1)
a<-table.element(a,mydensity3$y[mydensity3$y==max(mydensity3$y)],1)
a<-table.row.end(a)
a<-table.row.start(a)
a<-table.element(a,'Triangular',1,TRUE)
a<-table.element(a,mydensity4$x[mydensity4$y==max(mydensity4$y)],1)
a<-table.element(a,mydensity4$y[mydensity4$y==max(mydensity4$y)],1)
a<-table.row.end(a)
a<-table.row.start(a)
a<-table.element(a,'Biweight',1,TRUE)
a<-table.element(a,mydensity5$x[mydensity5$y==max(mydensity5$y)],1)
a<-table.element(a,mydensity5$y[mydensity5$y==max(mydensity5$y)],1)
a<-table.row.end(a)
a<-table.row.start(a)
a<-table.element(a,'Cosine',1,TRUE)
a<-table.element(a,mydensity6$x[mydensity6$y==max(mydensity6$y)],1)
a<-table.element(a,mydensity6$y[mydensity6$y==max(mydensity6$y)],1)
a<-table.row.end(a)
a<-table.row.start(a)
a<-table.element(a,'Optcosine',1,TRUE)
a<-table.element(a,mydensity7$x[mydensity7$y==max(mydensity7$y)],1)
a<-table.element(a,mydensity7$y[mydensity7$y==max(mydensity7$y)],1)
a<-table.row.end(a)
a<-table.end(a)
table.save(a,file='mytable2.tab')
if (par2=='yes') {
a<-table.start()
a<-table.row.start(a)
a<-table.element(a,'Kernel Density Values',8,TRUE)
a<-table.row.end(a)
a<-table.row.start(a)
a<-table.element(a,'x-value',1,TRUE)
a<-table.element(a,'Gaussian',1,TRUE)
a<-table.element(a,'Epanechnikov',1,TRUE)
a<-table.element(a,'Rectangular',1,TRUE)
a<-table.element(a,'Triangular',1,TRUE)
a<-table.element(a,'Biweight',1,TRUE)
a<-table.element(a,'Cosine',1,TRUE)
a<-table.element(a,'Optcosine',1,TRUE)
a<-table.row.end(a)
for(i in 1:par3) {
a<-table.row.start(a)
a<-table.element(a,mydensity[i,8],1,TRUE)
for(j in 1:7) {
a<-table.element(a,mydensity[i,j],1)
}
a<-table.row.end(a)
}
a<-table.end(a)
table.save(a,file='mytable1.tab')
}