\begin{tabular}{lllllllll}
\hline
Summary of computational transaction \tabularnewline
Raw Input & view raw input (R code)  \tabularnewline
Raw Output & view raw output of R engine  \tabularnewline
Computing time & 1 seconds \tabularnewline
R Server & 'Gwilym Jenkins' @ jenkins.wessa.net \tabularnewline
\hline
\end{tabular}
%Source: https://freestatistics.org/blog/index.php?pk=276704&T=0
[TABLE]
[ROW][C]Summary of computational transaction[/C][/ROW]
[ROW][C]Raw Input[/C][C]view raw input (R code) [/C][/ROW]
[ROW][C]Raw Output[/C][C]view raw output of R engine [/C][/ROW]
[ROW][C]Computing time[/C][C]1 seconds[/C][/ROW]
[ROW][C]R Server[/C][C]'Gwilym Jenkins' @ jenkins.wessa.net[/C][/ROW]
[/TABLE]
Source: https://freestatistics.org/blog/index.php?pk=276704&T=0
If you paste this QR Code into your document, anyone with a smartphone or tablet will be able to scan it and view this table in a browser.
If you paste this QR Code into your document, anyone with a smartphone or tablet will be able to scan it and view this table in a browser.
If you paste this QR Code into your document, anyone with a smartphone or tablet will be able to scan it and view this table in a browser.
If you paste this QR Code into your document, anyone with a smartphone or tablet will be able to scan it and view this table in a browser.
If you paste this QR Code into your document, anyone with a smartphone or tablet will be able to scan it and view this table in a browser.
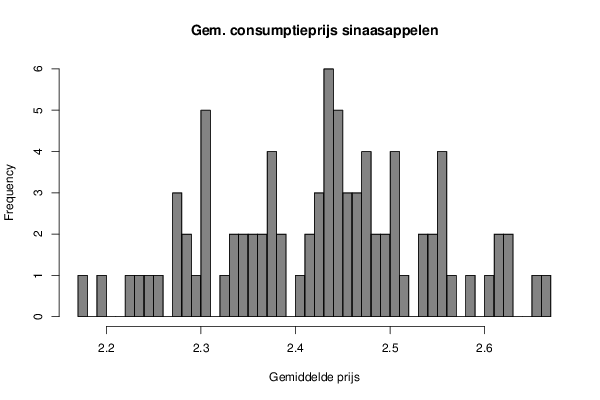
| Frequency Table (Histogram) | | Bins | Midpoint | Abs. Frequency | Rel. Frequency | Cumul. Rel. Freq. | Density | | [2.17,2.18[ | 2.175 | 1 | 0.011765 | 0.011765 | 1.176471 | | [2.18,2.19[ | 2.185 | 0 | 0 | 0.011765 | 0 | | [2.19,2.2[ | 2.195 | 1 | 0.011765 | 0.023529 | 1.176471 | | [2.2,2.21[ | 2.205 | 0 | 0 | 0.023529 | 0 | | [2.21,2.22[ | 2.215 | 0 | 0 | 0.023529 | 0 | | [2.22,2.23[ | 2.225 | 1 | 0.011765 | 0.035294 | 1.176471 | | [2.23,2.24[ | 2.235 | 1 | 0.011765 | 0.047059 | 1.176471 | | [2.24,2.25[ | 2.245 | 1 | 0.011765 | 0.058824 | 1.176471 | | [2.25,2.26[ | 2.255 | 1 | 0.011765 | 0.070588 | 1.176471 | | [2.26,2.27[ | 2.265 | 0 | 0 | 0.070588 | 0 | | [2.27,2.28[ | 2.275 | 3 | 0.035294 | 0.105882 | 3.529412 | | [2.28,2.29[ | 2.285 | 2 | 0.023529 | 0.129412 | 2.352941 | | [2.29,2.3[ | 2.295 | 1 | 0.011765 | 0.141176 | 1.176471 | | [2.3,2.31[ | 2.305 | 5 | 0.058824 | 0.2 | 5.882353 | | [2.31,2.32[ | 2.315 | 0 | 0 | 0.2 | 0 | | [2.32,2.33[ | 2.325 | 1 | 0.011765 | 0.211765 | 1.176471 | | [2.33,2.34[ | 2.335 | 2 | 0.023529 | 0.235294 | 2.352941 | | [2.34,2.35[ | 2.345 | 2 | 0.023529 | 0.258824 | 2.352941 | | [2.35,2.36[ | 2.355 | 2 | 0.023529 | 0.282353 | 2.352941 | | [2.36,2.37[ | 2.365 | 2 | 0.023529 | 0.305882 | 2.352941 | | [2.37,2.38[ | 2.375 | 4 | 0.047059 | 0.352941 | 4.705882 | | [2.38,2.39[ | 2.385 | 2 | 0.023529 | 0.376471 | 2.352941 | | [2.39,2.4[ | 2.395 | 0 | 0 | 0.376471 | 0 | | [2.4,2.41[ | 2.405 | 1 | 0.011765 | 0.388235 | 1.176471 | | [2.41,2.42[ | 2.415 | 2 | 0.023529 | 0.411765 | 2.352941 | | [2.42,2.43[ | 2.425 | 3 | 0.035294 | 0.447059 | 3.529412 | | [2.43,2.44[ | 2.435 | 6 | 0.070588 | 0.517647 | 7.058824 | | [2.44,2.45[ | 2.445 | 5 | 0.058824 | 0.576471 | 5.882353 | | [2.45,2.46[ | 2.455 | 3 | 0.035294 | 0.611765 | 3.529412 | | [2.46,2.47[ | 2.465 | 3 | 0.035294 | 0.647059 | 3.529412 | | [2.47,2.48[ | 2.475 | 4 | 0.047059 | 0.694118 | 4.705882 | | [2.48,2.49[ | 2.485 | 2 | 0.023529 | 0.717647 | 2.352941 | | [2.49,2.5[ | 2.495 | 2 | 0.023529 | 0.741176 | 2.352941 | | [2.5,2.51[ | 2.505 | 4 | 0.047059 | 0.788235 | 4.705882 | | [2.51,2.52[ | 2.515 | 1 | 0.011765 | 0.8 | 1.176471 | | [2.52,2.53[ | 2.525 | 0 | 0 | 0.8 | 0 | | [2.53,2.54[ | 2.535 | 2 | 0.023529 | 0.823529 | 2.352941 | | [2.54,2.55[ | 2.545 | 2 | 0.023529 | 0.847059 | 2.352941 | | [2.55,2.56[ | 2.555 | 4 | 0.047059 | 0.894118 | 4.705882 | | [2.56,2.57[ | 2.565 | 1 | 0.011765 | 0.905882 | 1.176471 | | [2.57,2.58[ | 2.575 | 0 | 0 | 0.905882 | 0 | | [2.58,2.59[ | 2.585 | 1 | 0.011765 | 0.917647 | 1.176471 | | [2.59,2.6[ | 2.595 | 0 | 0 | 0.917647 | 0 | | [2.6,2.61[ | 2.605 | 1 | 0.011765 | 0.929412 | 1.176471 | | [2.61,2.62[ | 2.615 | 2 | 0.023529 | 0.952941 | 2.352941 | | [2.62,2.63[ | 2.625 | 2 | 0.023529 | 0.976471 | 2.352941 | | [2.63,2.64[ | 2.635 | 0 | 0 | 0.976471 | 0 | | [2.64,2.65[ | 2.645 | 0 | 0 | 0.976471 | 0 | | [2.65,2.66[ | 2.655 | 1 | 0.011765 | 0.988235 | 1.176471 | | [2.66,2.67] | 2.665 | 1 | 0.011765 | 1 | 1.176471 |
\begin{tabular}{lllllllll}
\hline
Frequency Table (Histogram) \tabularnewline
Bins & Midpoint & Abs. Frequency & Rel. Frequency & Cumul. Rel. Freq. & Density \tabularnewline
[2.17,2.18[ & 2.175 & 1 & 0.011765 & 0.011765 & 1.176471 \tabularnewline
[2.18,2.19[ & 2.185 & 0 & 0 & 0.011765 & 0 \tabularnewline
[2.19,2.2[ & 2.195 & 1 & 0.011765 & 0.023529 & 1.176471 \tabularnewline
[2.2,2.21[ & 2.205 & 0 & 0 & 0.023529 & 0 \tabularnewline
[2.21,2.22[ & 2.215 & 0 & 0 & 0.023529 & 0 \tabularnewline
[2.22,2.23[ & 2.225 & 1 & 0.011765 & 0.035294 & 1.176471 \tabularnewline
[2.23,2.24[ & 2.235 & 1 & 0.011765 & 0.047059 & 1.176471 \tabularnewline
[2.24,2.25[ & 2.245 & 1 & 0.011765 & 0.058824 & 1.176471 \tabularnewline
[2.25,2.26[ & 2.255 & 1 & 0.011765 & 0.070588 & 1.176471 \tabularnewline
[2.26,2.27[ & 2.265 & 0 & 0 & 0.070588 & 0 \tabularnewline
[2.27,2.28[ & 2.275 & 3 & 0.035294 & 0.105882 & 3.529412 \tabularnewline
[2.28,2.29[ & 2.285 & 2 & 0.023529 & 0.129412 & 2.352941 \tabularnewline
[2.29,2.3[ & 2.295 & 1 & 0.011765 & 0.141176 & 1.176471 \tabularnewline
[2.3,2.31[ & 2.305 & 5 & 0.058824 & 0.2 & 5.882353 \tabularnewline
[2.31,2.32[ & 2.315 & 0 & 0 & 0.2 & 0 \tabularnewline
[2.32,2.33[ & 2.325 & 1 & 0.011765 & 0.211765 & 1.176471 \tabularnewline
[2.33,2.34[ & 2.335 & 2 & 0.023529 & 0.235294 & 2.352941 \tabularnewline
[2.34,2.35[ & 2.345 & 2 & 0.023529 & 0.258824 & 2.352941 \tabularnewline
[2.35,2.36[ & 2.355 & 2 & 0.023529 & 0.282353 & 2.352941 \tabularnewline
[2.36,2.37[ & 2.365 & 2 & 0.023529 & 0.305882 & 2.352941 \tabularnewline
[2.37,2.38[ & 2.375 & 4 & 0.047059 & 0.352941 & 4.705882 \tabularnewline
[2.38,2.39[ & 2.385 & 2 & 0.023529 & 0.376471 & 2.352941 \tabularnewline
[2.39,2.4[ & 2.395 & 0 & 0 & 0.376471 & 0 \tabularnewline
[2.4,2.41[ & 2.405 & 1 & 0.011765 & 0.388235 & 1.176471 \tabularnewline
[2.41,2.42[ & 2.415 & 2 & 0.023529 & 0.411765 & 2.352941 \tabularnewline
[2.42,2.43[ & 2.425 & 3 & 0.035294 & 0.447059 & 3.529412 \tabularnewline
[2.43,2.44[ & 2.435 & 6 & 0.070588 & 0.517647 & 7.058824 \tabularnewline
[2.44,2.45[ & 2.445 & 5 & 0.058824 & 0.576471 & 5.882353 \tabularnewline
[2.45,2.46[ & 2.455 & 3 & 0.035294 & 0.611765 & 3.529412 \tabularnewline
[2.46,2.47[ & 2.465 & 3 & 0.035294 & 0.647059 & 3.529412 \tabularnewline
[2.47,2.48[ & 2.475 & 4 & 0.047059 & 0.694118 & 4.705882 \tabularnewline
[2.48,2.49[ & 2.485 & 2 & 0.023529 & 0.717647 & 2.352941 \tabularnewline
[2.49,2.5[ & 2.495 & 2 & 0.023529 & 0.741176 & 2.352941 \tabularnewline
[2.5,2.51[ & 2.505 & 4 & 0.047059 & 0.788235 & 4.705882 \tabularnewline
[2.51,2.52[ & 2.515 & 1 & 0.011765 & 0.8 & 1.176471 \tabularnewline
[2.52,2.53[ & 2.525 & 0 & 0 & 0.8 & 0 \tabularnewline
[2.53,2.54[ & 2.535 & 2 & 0.023529 & 0.823529 & 2.352941 \tabularnewline
[2.54,2.55[ & 2.545 & 2 & 0.023529 & 0.847059 & 2.352941 \tabularnewline
[2.55,2.56[ & 2.555 & 4 & 0.047059 & 0.894118 & 4.705882 \tabularnewline
[2.56,2.57[ & 2.565 & 1 & 0.011765 & 0.905882 & 1.176471 \tabularnewline
[2.57,2.58[ & 2.575 & 0 & 0 & 0.905882 & 0 \tabularnewline
[2.58,2.59[ & 2.585 & 1 & 0.011765 & 0.917647 & 1.176471 \tabularnewline
[2.59,2.6[ & 2.595 & 0 & 0 & 0.917647 & 0 \tabularnewline
[2.6,2.61[ & 2.605 & 1 & 0.011765 & 0.929412 & 1.176471 \tabularnewline
[2.61,2.62[ & 2.615 & 2 & 0.023529 & 0.952941 & 2.352941 \tabularnewline
[2.62,2.63[ & 2.625 & 2 & 0.023529 & 0.976471 & 2.352941 \tabularnewline
[2.63,2.64[ & 2.635 & 0 & 0 & 0.976471 & 0 \tabularnewline
[2.64,2.65[ & 2.645 & 0 & 0 & 0.976471 & 0 \tabularnewline
[2.65,2.66[ & 2.655 & 1 & 0.011765 & 0.988235 & 1.176471 \tabularnewline
[2.66,2.67] & 2.665 & 1 & 0.011765 & 1 & 1.176471 \tabularnewline
\hline
\end{tabular}
%Source: https://freestatistics.org/blog/index.php?pk=276704&T=1
[TABLE]
[ROW][C]Frequency Table (Histogram)[/C][/ROW]
[ROW][C]Bins[/C][C]Midpoint[/C][C]Abs. Frequency[/C][C]Rel. Frequency[/C][C]Cumul. Rel. Freq.[/C][C]Density[/C][/ROW]
[ROW][C][2.17,2.18[[/C][C]2.175[/C][C]1[/C][C]0.011765[/C][C]0.011765[/C][C]1.176471[/C][/ROW]
[ROW][C][2.18,2.19[[/C][C]2.185[/C][C]0[/C][C]0[/C][C]0.011765[/C][C]0[/C][/ROW]
[ROW][C][2.19,2.2[[/C][C]2.195[/C][C]1[/C][C]0.011765[/C][C]0.023529[/C][C]1.176471[/C][/ROW]
[ROW][C][2.2,2.21[[/C][C]2.205[/C][C]0[/C][C]0[/C][C]0.023529[/C][C]0[/C][/ROW]
[ROW][C][2.21,2.22[[/C][C]2.215[/C][C]0[/C][C]0[/C][C]0.023529[/C][C]0[/C][/ROW]
[ROW][C][2.22,2.23[[/C][C]2.225[/C][C]1[/C][C]0.011765[/C][C]0.035294[/C][C]1.176471[/C][/ROW]
[ROW][C][2.23,2.24[[/C][C]2.235[/C][C]1[/C][C]0.011765[/C][C]0.047059[/C][C]1.176471[/C][/ROW]
[ROW][C][2.24,2.25[[/C][C]2.245[/C][C]1[/C][C]0.011765[/C][C]0.058824[/C][C]1.176471[/C][/ROW]
[ROW][C][2.25,2.26[[/C][C]2.255[/C][C]1[/C][C]0.011765[/C][C]0.070588[/C][C]1.176471[/C][/ROW]
[ROW][C][2.26,2.27[[/C][C]2.265[/C][C]0[/C][C]0[/C][C]0.070588[/C][C]0[/C][/ROW]
[ROW][C][2.27,2.28[[/C][C]2.275[/C][C]3[/C][C]0.035294[/C][C]0.105882[/C][C]3.529412[/C][/ROW]
[ROW][C][2.28,2.29[[/C][C]2.285[/C][C]2[/C][C]0.023529[/C][C]0.129412[/C][C]2.352941[/C][/ROW]
[ROW][C][2.29,2.3[[/C][C]2.295[/C][C]1[/C][C]0.011765[/C][C]0.141176[/C][C]1.176471[/C][/ROW]
[ROW][C][2.3,2.31[[/C][C]2.305[/C][C]5[/C][C]0.058824[/C][C]0.2[/C][C]5.882353[/C][/ROW]
[ROW][C][2.31,2.32[[/C][C]2.315[/C][C]0[/C][C]0[/C][C]0.2[/C][C]0[/C][/ROW]
[ROW][C][2.32,2.33[[/C][C]2.325[/C][C]1[/C][C]0.011765[/C][C]0.211765[/C][C]1.176471[/C][/ROW]
[ROW][C][2.33,2.34[[/C][C]2.335[/C][C]2[/C][C]0.023529[/C][C]0.235294[/C][C]2.352941[/C][/ROW]
[ROW][C][2.34,2.35[[/C][C]2.345[/C][C]2[/C][C]0.023529[/C][C]0.258824[/C][C]2.352941[/C][/ROW]
[ROW][C][2.35,2.36[[/C][C]2.355[/C][C]2[/C][C]0.023529[/C][C]0.282353[/C][C]2.352941[/C][/ROW]
[ROW][C][2.36,2.37[[/C][C]2.365[/C][C]2[/C][C]0.023529[/C][C]0.305882[/C][C]2.352941[/C][/ROW]
[ROW][C][2.37,2.38[[/C][C]2.375[/C][C]4[/C][C]0.047059[/C][C]0.352941[/C][C]4.705882[/C][/ROW]
[ROW][C][2.38,2.39[[/C][C]2.385[/C][C]2[/C][C]0.023529[/C][C]0.376471[/C][C]2.352941[/C][/ROW]
[ROW][C][2.39,2.4[[/C][C]2.395[/C][C]0[/C][C]0[/C][C]0.376471[/C][C]0[/C][/ROW]
[ROW][C][2.4,2.41[[/C][C]2.405[/C][C]1[/C][C]0.011765[/C][C]0.388235[/C][C]1.176471[/C][/ROW]
[ROW][C][2.41,2.42[[/C][C]2.415[/C][C]2[/C][C]0.023529[/C][C]0.411765[/C][C]2.352941[/C][/ROW]
[ROW][C][2.42,2.43[[/C][C]2.425[/C][C]3[/C][C]0.035294[/C][C]0.447059[/C][C]3.529412[/C][/ROW]
[ROW][C][2.43,2.44[[/C][C]2.435[/C][C]6[/C][C]0.070588[/C][C]0.517647[/C][C]7.058824[/C][/ROW]
[ROW][C][2.44,2.45[[/C][C]2.445[/C][C]5[/C][C]0.058824[/C][C]0.576471[/C][C]5.882353[/C][/ROW]
[ROW][C][2.45,2.46[[/C][C]2.455[/C][C]3[/C][C]0.035294[/C][C]0.611765[/C][C]3.529412[/C][/ROW]
[ROW][C][2.46,2.47[[/C][C]2.465[/C][C]3[/C][C]0.035294[/C][C]0.647059[/C][C]3.529412[/C][/ROW]
[ROW][C][2.47,2.48[[/C][C]2.475[/C][C]4[/C][C]0.047059[/C][C]0.694118[/C][C]4.705882[/C][/ROW]
[ROW][C][2.48,2.49[[/C][C]2.485[/C][C]2[/C][C]0.023529[/C][C]0.717647[/C][C]2.352941[/C][/ROW]
[ROW][C][2.49,2.5[[/C][C]2.495[/C][C]2[/C][C]0.023529[/C][C]0.741176[/C][C]2.352941[/C][/ROW]
[ROW][C][2.5,2.51[[/C][C]2.505[/C][C]4[/C][C]0.047059[/C][C]0.788235[/C][C]4.705882[/C][/ROW]
[ROW][C][2.51,2.52[[/C][C]2.515[/C][C]1[/C][C]0.011765[/C][C]0.8[/C][C]1.176471[/C][/ROW]
[ROW][C][2.52,2.53[[/C][C]2.525[/C][C]0[/C][C]0[/C][C]0.8[/C][C]0[/C][/ROW]
[ROW][C][2.53,2.54[[/C][C]2.535[/C][C]2[/C][C]0.023529[/C][C]0.823529[/C][C]2.352941[/C][/ROW]
[ROW][C][2.54,2.55[[/C][C]2.545[/C][C]2[/C][C]0.023529[/C][C]0.847059[/C][C]2.352941[/C][/ROW]
[ROW][C][2.55,2.56[[/C][C]2.555[/C][C]4[/C][C]0.047059[/C][C]0.894118[/C][C]4.705882[/C][/ROW]
[ROW][C][2.56,2.57[[/C][C]2.565[/C][C]1[/C][C]0.011765[/C][C]0.905882[/C][C]1.176471[/C][/ROW]
[ROW][C][2.57,2.58[[/C][C]2.575[/C][C]0[/C][C]0[/C][C]0.905882[/C][C]0[/C][/ROW]
[ROW][C][2.58,2.59[[/C][C]2.585[/C][C]1[/C][C]0.011765[/C][C]0.917647[/C][C]1.176471[/C][/ROW]
[ROW][C][2.59,2.6[[/C][C]2.595[/C][C]0[/C][C]0[/C][C]0.917647[/C][C]0[/C][/ROW]
[ROW][C][2.6,2.61[[/C][C]2.605[/C][C]1[/C][C]0.011765[/C][C]0.929412[/C][C]1.176471[/C][/ROW]
[ROW][C][2.61,2.62[[/C][C]2.615[/C][C]2[/C][C]0.023529[/C][C]0.952941[/C][C]2.352941[/C][/ROW]
[ROW][C][2.62,2.63[[/C][C]2.625[/C][C]2[/C][C]0.023529[/C][C]0.976471[/C][C]2.352941[/C][/ROW]
[ROW][C][2.63,2.64[[/C][C]2.635[/C][C]0[/C][C]0[/C][C]0.976471[/C][C]0[/C][/ROW]
[ROW][C][2.64,2.65[[/C][C]2.645[/C][C]0[/C][C]0[/C][C]0.976471[/C][C]0[/C][/ROW]
[ROW][C][2.65,2.66[[/C][C]2.655[/C][C]1[/C][C]0.011765[/C][C]0.988235[/C][C]1.176471[/C][/ROW]
[ROW][C][2.66,2.67][/C][C]2.665[/C][C]1[/C][C]0.011765[/C][C]1[/C][C]1.176471[/C][/ROW]
[/TABLE]
Source: https://freestatistics.org/blog/index.php?pk=276704&T=1
Globally Unique Identifier (entire table): ba.freestatistics.org/blog/index.php?pk=276704&T=1
As an alternative you can also use a QR Code:
The GUIDs for individual cells are displayed in the table below:
| Frequency Table (Histogram) | | Bins | Midpoint | Abs. Frequency | Rel. Frequency | Cumul. Rel. Freq. | Density | | [2.17,2.18[ | 2.175 | 1 | 0.011765 | 0.011765 | 1.176471 | | [2.18,2.19[ | 2.185 | 0 | 0 | 0.011765 | 0 | | [2.19,2.2[ | 2.195 | 1 | 0.011765 | 0.023529 | 1.176471 | | [2.2,2.21[ | 2.205 | 0 | 0 | 0.023529 | 0 | | [2.21,2.22[ | 2.215 | 0 | 0 | 0.023529 | 0 | | [2.22,2.23[ | 2.225 | 1 | 0.011765 | 0.035294 | 1.176471 | | [2.23,2.24[ | 2.235 | 1 | 0.011765 | 0.047059 | 1.176471 | | [2.24,2.25[ | 2.245 | 1 | 0.011765 | 0.058824 | 1.176471 | | [2.25,2.26[ | 2.255 | 1 | 0.011765 | 0.070588 | 1.176471 | | [2.26,2.27[ | 2.265 | 0 | 0 | 0.070588 | 0 | | [2.27,2.28[ | 2.275 | 3 | 0.035294 | 0.105882 | 3.529412 | | [2.28,2.29[ | 2.285 | 2 | 0.023529 | 0.129412 | 2.352941 | | [2.29,2.3[ | 2.295 | 1 | 0.011765 | 0.141176 | 1.176471 | | [2.3,2.31[ | 2.305 | 5 | 0.058824 | 0.2 | 5.882353 | | [2.31,2.32[ | 2.315 | 0 | 0 | 0.2 | 0 | | [2.32,2.33[ | 2.325 | 1 | 0.011765 | 0.211765 | 1.176471 | | [2.33,2.34[ | 2.335 | 2 | 0.023529 | 0.235294 | 2.352941 | | [2.34,2.35[ | 2.345 | 2 | 0.023529 | 0.258824 | 2.352941 | | [2.35,2.36[ | 2.355 | 2 | 0.023529 | 0.282353 | 2.352941 | | [2.36,2.37[ | 2.365 | 2 | 0.023529 | 0.305882 | 2.352941 | | [2.37,2.38[ | 2.375 | 4 | 0.047059 | 0.352941 | 4.705882 | | [2.38,2.39[ | 2.385 | 2 | 0.023529 | 0.376471 | 2.352941 | | [2.39,2.4[ | 2.395 | 0 | 0 | 0.376471 | 0 | | [2.4,2.41[ | 2.405 | 1 | 0.011765 | 0.388235 | 1.176471 | | [2.41,2.42[ | 2.415 | 2 | 0.023529 | 0.411765 | 2.352941 | | [2.42,2.43[ | 2.425 | 3 | 0.035294 | 0.447059 | 3.529412 | | [2.43,2.44[ | 2.435 | 6 | 0.070588 | 0.517647 | 7.058824 | | [2.44,2.45[ | 2.445 | 5 | 0.058824 | 0.576471 | 5.882353 | | [2.45,2.46[ | 2.455 | 3 | 0.035294 | 0.611765 | 3.529412 | | [2.46,2.47[ | 2.465 | 3 | 0.035294 | 0.647059 | 3.529412 | | [2.47,2.48[ | 2.475 | 4 | 0.047059 | 0.694118 | 4.705882 | | [2.48,2.49[ | 2.485 | 2 | 0.023529 | 0.717647 | 2.352941 | | [2.49,2.5[ | 2.495 | 2 | 0.023529 | 0.741176 | 2.352941 | | [2.5,2.51[ | 2.505 | 4 | 0.047059 | 0.788235 | 4.705882 | | [2.51,2.52[ | 2.515 | 1 | 0.011765 | 0.8 | 1.176471 | | [2.52,2.53[ | 2.525 | 0 | 0 | 0.8 | 0 | | [2.53,2.54[ | 2.535 | 2 | 0.023529 | 0.823529 | 2.352941 | | [2.54,2.55[ | 2.545 | 2 | 0.023529 | 0.847059 | 2.352941 | | [2.55,2.56[ | 2.555 | 4 | 0.047059 | 0.894118 | 4.705882 | | [2.56,2.57[ | 2.565 | 1 | 0.011765 | 0.905882 | 1.176471 | | [2.57,2.58[ | 2.575 | 0 | 0 | 0.905882 | 0 | | [2.58,2.59[ | 2.585 | 1 | 0.011765 | 0.917647 | 1.176471 | | [2.59,2.6[ | 2.595 | 0 | 0 | 0.917647 | 0 | | [2.6,2.61[ | 2.605 | 1 | 0.011765 | 0.929412 | 1.176471 | | [2.61,2.62[ | 2.615 | 2 | 0.023529 | 0.952941 | 2.352941 | | [2.62,2.63[ | 2.625 | 2 | 0.023529 | 0.976471 | 2.352941 | | [2.63,2.64[ | 2.635 | 0 | 0 | 0.976471 | 0 | | [2.64,2.65[ | 2.645 | 0 | 0 | 0.976471 | 0 | | [2.65,2.66[ | 2.655 | 1 | 0.011765 | 0.988235 | 1.176471 | | [2.66,2.67] | 2.665 | 1 | 0.011765 | 1 | 1.176471 |
If you paste this QR Code into your document, anyone with a smartphone or tablet will be able to scan it and view this table in a browser.
If you paste this QR Code into your document, anyone with a smartphone or tablet will be able to scan it and view this table in a browser.
If you paste this QR Code into your document, anyone with a smartphone or tablet will be able to scan it and view this table in a browser.
If you paste this QR Code into your document, anyone with a smartphone or tablet will be able to scan it and view this table in a browser.
If you paste this QR Code into your document, anyone with a smartphone or tablet will be able to scan it and view this table in a browser.
|