Free Statistics
of Irreproducible Research!
Description of Statistical Computation | |||||||||||||||||||||||||||||||||||||||||
|---|---|---|---|---|---|---|---|---|---|---|---|---|---|---|---|---|---|---|---|---|---|---|---|---|---|---|---|---|---|---|---|---|---|---|---|---|---|---|---|---|---|
| Author's title | |||||||||||||||||||||||||||||||||||||||||
| Author | *Unverified author* | ||||||||||||||||||||||||||||||||||||||||
| R Software Module | rwasp_univariatedataseries.wasp | ||||||||||||||||||||||||||||||||||||||||
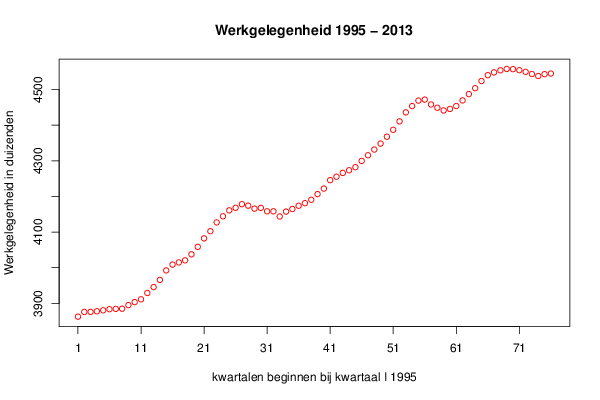
| Title produced by software | Univariate Data Series | ||||||||||||||||||||||||||||||||||||||||
| Date of computation | Wed, 04 Feb 2015 11:47:59 +0000 | ||||||||||||||||||||||||||||||||||||||||
| Cite this page as follows | Statistical Computations at FreeStatistics.org, Office for Research Development and Education, URL https://freestatistics.org/blog/index.php?v=date/2015/Feb/04/t1423050555idjbhpttrqgufcj.htm/, Retrieved Sat, 18 May 2024 07:29:51 +0000 | ||||||||||||||||||||||||||||||||||||||||
| Statistical Computations at FreeStatistics.org, Office for Research Development and Education, URL https://freestatistics.org/blog/index.php?pk=276591, Retrieved Sat, 18 May 2024 07:29:51 +0000 | |||||||||||||||||||||||||||||||||||||||||
| QR Codes: | |||||||||||||||||||||||||||||||||||||||||
|
| |||||||||||||||||||||||||||||||||||||||||
| Original text written by user: | |||||||||||||||||||||||||||||||||||||||||
| IsPrivate? | No (this computation is public) | ||||||||||||||||||||||||||||||||||||||||
| User-defined keywords | |||||||||||||||||||||||||||||||||||||||||
| Estimated Impact | 157 | ||||||||||||||||||||||||||||||||||||||||
Tree of Dependent Computations | |||||||||||||||||||||||||||||||||||||||||
| Family? (F = Feedback message, R = changed R code, M = changed R Module, P = changed Parameters, D = changed Data) | |||||||||||||||||||||||||||||||||||||||||
| - [Univariate Data Series] [Prijs per jaar in...] [2015-01-26 18:32:25] [e0fa3a74ccf797c3f9a13c41db1fd9c0] - R PD [Univariate Data Series] [inflatie vanaf 2008] [2015-01-30 16:52:54] [e0fa3a74ccf797c3f9a13c41db1fd9c0] - PD [Univariate Data Series] [ Binnenlandse wer...] [2015-02-04 11:47:59] [cab9dc260884be88f444bea8f40c034b] [Current] - RMPD [Histogram] [Histogram en freq...] [2015-02-05 19:26:50] [e0fa3a74ccf797c3f9a13c41db1fd9c0] - RMPD [Kernel Density Estimation] [Dichtheidsgrafiek...] [2015-02-05 19:34:20] [e0fa3a74ccf797c3f9a13c41db1fd9c0] - RMPD [Histogram] [Binnenlands werkg...] [2015-02-08 18:50:33] [e0fa3a74ccf797c3f9a13c41db1fd9c0] | |||||||||||||||||||||||||||||||||||||||||
| Feedback Forum | |||||||||||||||||||||||||||||||||||||||||
Post a new message | |||||||||||||||||||||||||||||||||||||||||
Dataset | |||||||||||||||||||||||||||||||||||||||||
| Dataseries X: | |||||||||||||||||||||||||||||||||||||||||
3862,5 3875,7 3875,9 3877,7 3880,4 3883,4 3884,2 3884,8 3894,9 3903,3 3911,2 3928,9 3945,6 3965,7 3992,3 4008,7 4014,8 4020,6 4037,5 4058,5 4082,3 4102,4 4127,1 4144,4 4161 4168,2 4178,3 4174,1 4165,7 4167,9 4158,3 4158,3 4143,7 4157,5 4164,8 4173,9 4181,2 4190,7 4206,6 4222,1 4245,8 4255,4 4266,1 4273,6 4282,1 4299,8 4315,7 4331,7 4348,4 4367,8 4387,2 4410,9 4436 4453,8 4469,1 4472 4458,2 4449 4441,5 4445,7 4453,9 4469,7 4487,5 4504 4524,1 4540,5 4548,4 4554,2 4558 4557,5 4554,5 4550 4543,8 4538,2 4543,3 4545,1 | |||||||||||||||||||||||||||||||||||||||||
Tables (Output of Computation) | |||||||||||||||||||||||||||||||||||||||||
| |||||||||||||||||||||||||||||||||||||||||
Figures (Output of Computation) | |||||||||||||||||||||||||||||||||||||||||
Input Parameters & R Code | |||||||||||||||||||||||||||||||||||||||||
| Parameters (Session): | |||||||||||||||||||||||||||||||||||||||||
| par1 = Binnenlandse werkgelegenheid in duizenden ; par2 = http://www.nbb.be/belgostat/PresentationLinker?Order=true&prop=null ; par3 = Binnenlandse werkgelegenheid beginnen van 1 januari 1995 in per kwartaal. ; par4 = 4 ; | |||||||||||||||||||||||||||||||||||||||||
| Parameters (R input): | |||||||||||||||||||||||||||||||||||||||||
| par1 = Binnenlandse werkgelegenheid in duizenden ; par2 = http://www.nbb.be/belgostat/PresentationLinker?Order=true&prop=null ; par3 = Binnenlandse werkgelegenheid beginnen van 1 januari 1995 in per kwartaal. ; par4 = 4 ; | |||||||||||||||||||||||||||||||||||||||||
| R code (references can be found in the software module): | |||||||||||||||||||||||||||||||||||||||||
par4 <- 'No season' | |||||||||||||||||||||||||||||||||||||||||